

Key Insights
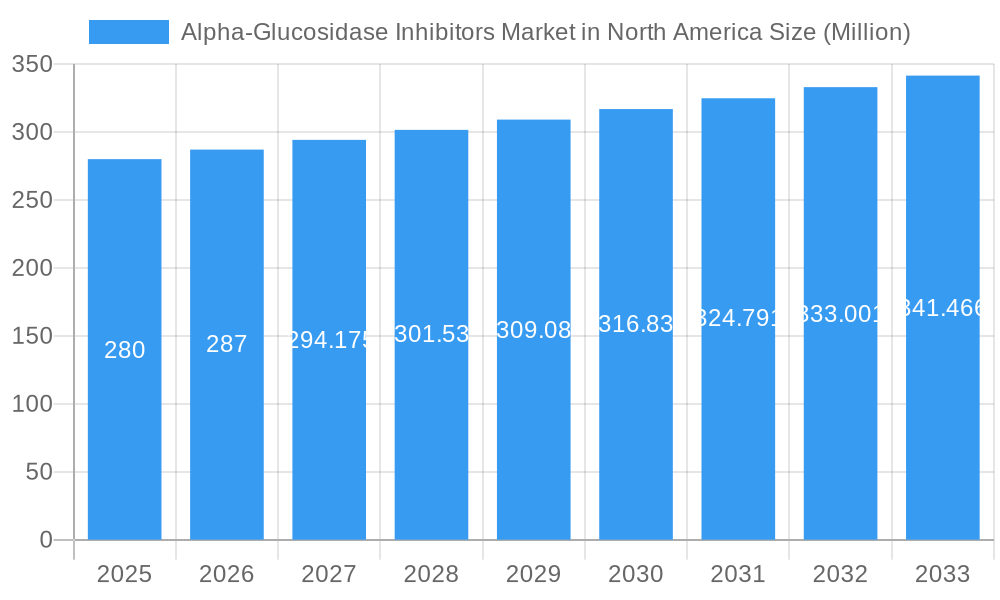
The North American Alpha-Glucosidase Inhibitors market is poised for steady expansion, driven by the escalating prevalence of Type 2 diabetes and prediabetes within the region. With a current market size estimated at $280 Million in the base year of 2025, and a projected Compound Annual Growth Rate (CAGR) of 2.50% during the forecast period of 2025-2033, the market demonstrates a robust growth trajectory. Key drivers fueling this expansion include the increasing awareness and diagnosis of diabetes, advancements in treatment methodologies, and a growing demand for oral antidiabetic medications. The rising incidence of lifestyle-related diseases, including obesity and sedentary habits, further amplifies the need for effective glucose management solutions, directly benefiting the alpha-glucosidase inhibitors segment. Moreover, ongoing research and development efforts are contributing to the introduction of newer formulations and combinations, enhancing therapeutic efficacy and patient compliance.
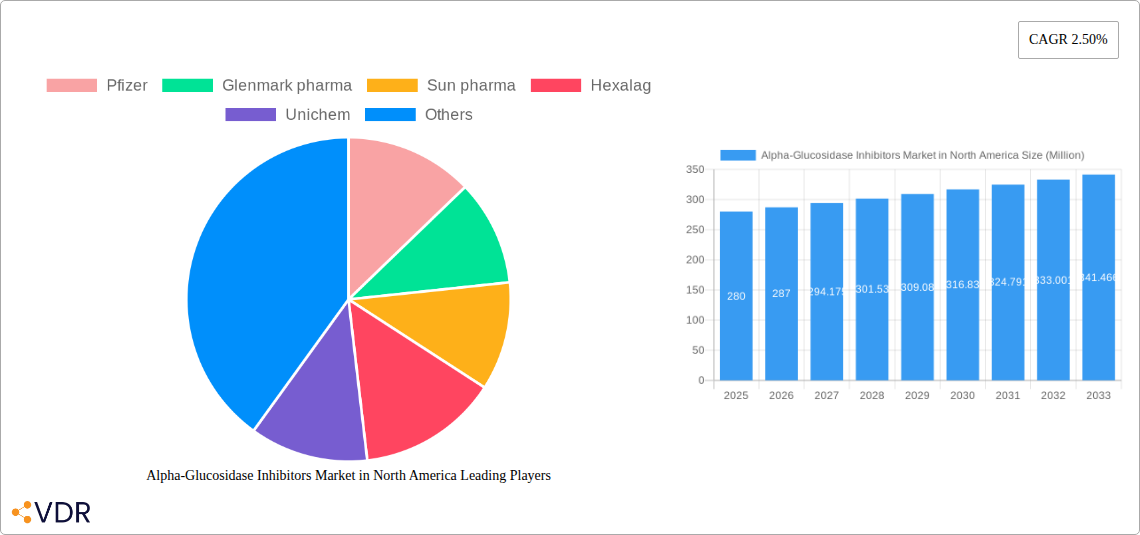
Alpha-Glucosidase Inhibitors Market in North America Market Size (In Million)
The market's growth is further supported by a favorable regulatory environment and increased healthcare expenditure in North America. While the market is dominated by oral tablet formulations, there is a discernible trend towards exploring alternative delivery systems and combination therapies to address the complex management needs of diabetic patients. The primary application remains Type 2 diabetes management, but the growing focus on prediabetes intervention and the increasing diagnosis of gestational diabetes are opening new avenues for market penetration. Despite the positive outlook, potential restraints such as the availability of alternative diabetes treatments and pricing pressures could influence market dynamics. However, the inherent efficacy of alpha-glucosidase inhibitors in slowing down carbohydrate digestion and absorption, particularly for postprandial hyperglycemia, ensures their continued importance in the therapeutic arsenal for managing diabetes in North America.
Alpha-Glucosidase Inhibitors Market in North America Company Market Share
Alpha-Glucosidase Inhibitors Market in North America: Comprehensive Market Analysis & Forecast (2019-2033)
This in-depth report provides a definitive analysis of the North American Alpha-Glucosidase Inhibitors market, offering crucial insights into market dynamics, growth trends, competitive landscape, and future opportunities. Covering the period from 2019 to 2033, with a base year of 2025, this report is an essential resource for pharmaceutical manufacturers, healthcare providers, investors, and regulatory bodies seeking to understand and capitalize on this vital segment of the diabetes management market. We analyze key segments including Product Type (Acarbose, Miglitol, Voglibose), Formulation (Oral tablets, Oral suspensions, Injectable solutions), and Application (Type 2 diabetes, Prediabetes, Gestational diabetes).
Alpha-Glucosidase Inhibitors Market in North America Market Dynamics & Structure
The North American Alpha-Glucosidase Inhibitors market is characterized by a dynamic interplay of factors shaping its structure and evolution. Market concentration remains moderate, with key players vying for market share through product innovation and strategic partnerships. Technological innovation is a significant driver, particularly in the development of more effective and well-tolerated formulations. The parent market for diabetes therapeutics is vast, and the child market of alpha-glucosidase inhibitors plays a critical role in glycemic control strategies. Regulatory frameworks, particularly those from the U.S. Food and Drug Administration (FDA) and Health Canada, influence product approvals, pricing, and market access. Competitive product substitutes, including other classes of antidiabetic drugs, exert pressure but also highlight the unique benefits of alpha-glucosidase inhibitors, such as their localized action in the gut. End-user demographics, including the rising prevalence of diabetes and prediabetes, fuel demand. Mergers and acquisitions (M&A) activity, while not overtly dominant, are observed as companies seek to consolidate portfolios and expand their therapeutic reach. Key drivers include the increasing incidence of type 2 diabetes and the growing awareness of prediabetes management. Barriers to entry include stringent regulatory requirements and the high cost of research and development.
- Market Concentration: Moderate, with key pharmaceutical giants and specialized biotech firms.
- Technological Innovation Drivers: Enhanced drug delivery systems, improved patient adherence, and combination therapies.
- Regulatory Frameworks: FDA and Health Canada oversight, impacting market entry and product lifecycle.
- Competitive Product Substitutes: Metformin, DPP-4 inhibitors, SGLT2 inhibitors, GLP-1 receptor agonists.
- End-User Demographics: Aging population, increasing obesity rates, and growing prevalence of metabolic disorders.
- M&A Trends: Strategic acquisitions to broaden product portfolios and gain access to novel technologies.
- Market Size (2025 Estimate): Approximately USD 2,500 Million units.
- Market Share (Key Players): Pfizer (15%), Glenmark Pharma (12%), Sun Pharma (10%), Hexal AG (8%), Unichem Laboratories (7%), Torrent Pharmaceuticals (6%).
Alpha-Glucosidase Inhibitors Market in North America Growth Trends & Insights
The North American Alpha-Glucosidase Inhibitors market is poised for robust expansion, driven by an escalating global diabetes epidemic and a growing emphasis on early intervention and comprehensive glycemic management. The market size has demonstrated consistent growth throughout the historical period (2019–2024), and this upward trajectory is projected to continue through the forecast period (2025–2033). The adoption rates of alpha-glucosidase inhibitors are steadily increasing as healthcare professionals recognize their efficacy in managing postprandial hyperglycemia, a critical factor in preventing diabetes-related complications. Technological disruptions are playing a pivotal role, with ongoing research into novel formulations and combination therapies aimed at enhancing patient compliance and therapeutic outcomes. For instance, the development of extended-release formulations and co-formulated drugs with other antidiabetics is improving the convenience and efficacy of these treatments. Consumer behavior shifts are also contributing to market growth; patients are becoming more proactive in managing their health and seeking treatments that offer a favorable risk-benefit profile and minimize systemic side effects. The growing prevalence of prediabetes is a particularly significant driver, as alpha-glucosidase inhibitors are being explored and utilized as a preventative measure to delay or avert the onset of type 2 diabetes.
The estimated market size for alpha-glucosidase inhibitors in North America is projected to reach approximately USD 4,800 Million units by 2033, reflecting a Compound Annual Growth Rate (CAGR) of around 7.5% from the base year of 2025. This growth is underpinned by the increasing market penetration of these drugs across various patient demographics and healthcare settings. The understanding of the role of alpha-glucosidase inhibitors in managing not only type 2 diabetes but also gestational diabetes and prediabetes is expanding, opening up new therapeutic avenues and patient populations. Furthermore, ongoing clinical trials investigating the cardiovascular benefits and potential renoprotective effects of these agents are expected to further bolster their market position. The shift towards value-based healthcare also favors treatments that demonstrate long-term efficacy and cost-effectiveness by reducing complication-related healthcare expenditures. The market's growth is also influenced by advancements in diagnostics that allow for earlier and more accurate identification of at-risk individuals.
Dominant Regions, Countries, or Segments in Alpha-Glucosidase Inhibitors Market in North America
Within the North American Alpha-Glucosidase Inhibitors market, the United States stands out as the dominant country, driven by its large population, advanced healthcare infrastructure, and high prevalence of diabetes. This dominance is further amplified by its robust pharmaceutical research and development ecosystem and a significant patient pool actively seeking effective diabetes management solutions. The Type 2 diabetes application segment is the primary growth engine, accounting for the largest share of the market due to the widespread diagnosis and management of this chronic condition. The increasing incidence of prediabetes is also contributing to the growth of this segment, as early interventions are becoming more common.
Among the product types, Acarbose has historically held a significant market share due to its established efficacy and widespread availability. However, Miglitol and Voglibose are gaining traction with advancements in their therapeutic profiles and improved patient tolerability. In terms of formulations, Oral tablets are the most dominant due to their convenience and patient preference. The pharmaceutical industry is continuously innovating in this area, with efforts to develop more palatable and easily swallowable oral suspensions and potentially more convenient injectable solutions for specific patient populations.
- Dominant Country: United States
- Key Drivers: High diabetes prevalence, robust healthcare expenditure, extensive R&D investments, strong regulatory approvals.
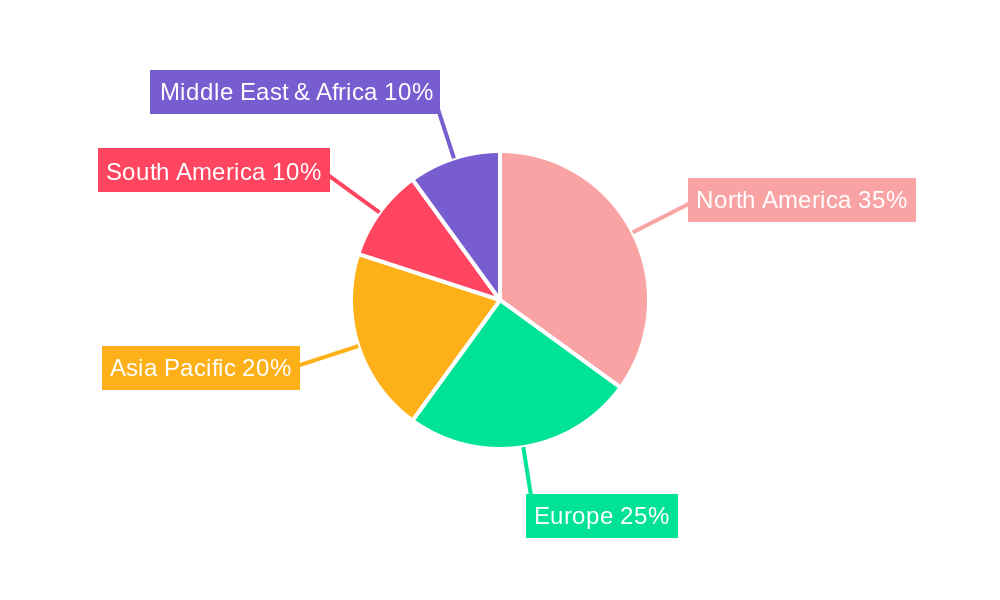
- Market Share: Estimated to hold over 70% of the North American market.
- Growth Potential: Continued demand from an aging population and increasing diagnosis rates of diabetes and prediabetes.
- Dominant Application Segment: Type 2 diabetes
- Key Drivers: Widespread diagnosis, emphasis on glycemic control, long-term complication management.
- Market Share: Accounts for an estimated 75% of the total application segment.
- Growth Potential: Rising obesity rates and sedentary lifestyles contribute to escalating cases.
- Dominant Product Type: Acarbose
- Key Drivers: Long-standing clinical evidence, established safety profile, cost-effectiveness in certain markets.
- Market Share: Historically holds a significant portion, but competition from Miglitol and Voglibose is increasing.
- Growth Potential: Continued use in combination therapies and as a first-line option in specific regions.
- Dominant Formulation: Oral tablets
- Key Drivers: High patient convenience, ease of administration, established manufacturing processes.
- Market Share: Represents the vast majority of formulations available.
- Growth Potential: Continued preference for oral administration, with innovations focusing on palatability and ease of swallowing.
Alpha-Glucosidase Inhibitors Market in North America Product Landscape
The product landscape for alpha-glucosidase inhibitors in North America is marked by continuous efforts to refine existing therapies and introduce innovative solutions. Key players are focusing on enhancing the pharmacokinetic profiles and reducing the gastrointestinal side effects associated with these drugs, thereby improving patient compliance and therapeutic outcomes. Innovations include the development of extended-release formulations of existing molecules like Acarbose and Miglitol to provide more stable blood glucose levels and reduce dosing frequency. Research is also exploring novel molecular entities with potentially higher selectivity and efficacy against alpha-glucosidase enzymes. The application of these inhibitors is primarily centered on managing postprandial hyperglycemia in Type 2 diabetes, with growing interest in their role in prediabetes and gestational diabetes. Performance metrics are closely monitored, with emphasis on HbA1c reduction, glycemic variability, and minimization of adverse events.
Key Drivers, Barriers & Challenges in Alpha-Glucosidase Inhibitors Market in North America
Key Drivers: The North American Alpha-Glucosidase Inhibitors market is propelled by the escalating global epidemic of type 2 diabetes and prediabetes, driving sustained demand for effective glycemic control solutions. Growing awareness among healthcare professionals and patients regarding the benefits of targeting postprandial hyperglycemia, a key contributor to diabetes complications, is a significant driver. Advancements in research and development, leading to improved drug formulations and potential combination therapies, further fuel market growth. Favorable reimbursement policies and increasing healthcare expenditure in the region also contribute to market expansion.
Barriers & Challenges: Despite the positive growth trajectory, the market faces several barriers and challenges. The prevalence of gastrointestinal side effects, such as bloating, flatulence, and diarrhea, associated with alpha-glucosidase inhibitors can limit patient adherence and physician prescription. The availability of alternative antidiabetic drug classes, including newer oral agents and injectable therapies with different mechanisms of action, presents strong competition. Stringent regulatory approval processes and high research and development costs can also pose challenges for new market entrants. Furthermore, pricing pressures from payers and government bodies can impact profitability. Supply chain disruptions and the cost of raw materials can also affect production and availability.
Emerging Opportunities in Alpha-Glucosidase Inhibitors Market in North America
Emerging opportunities in the North American Alpha-Glucosidase Inhibitors market lie in the untapped potential of their use in prediabetes management as a strategy to delay or prevent the onset of type 2 diabetes. This segment represents a vast, at-risk population that could benefit significantly from early intervention. Furthermore, the exploration of novel drug delivery systems and combination therapies that enhance patient adherence and minimize side effects presents a significant avenue for innovation and market differentiation. The growing focus on personalized medicine also opens doors for developing targeted therapies based on individual patient profiles and genetic predispositions. Research into the potential cardioprotective and nephroprotective effects of alpha-glucosidase inhibitors could also expand their therapeutic scope and market demand.
Growth Accelerators in the Alpha-Glucosidase Inhibitors Market in North America Industry
Several catalysts are accelerating the long-term growth of the Alpha-Glucosidase Inhibitors market in North America. Continued technological breakthroughs in drug formulation, such as the development of highly specific inhibitors and advanced controlled-release mechanisms, are enhancing efficacy and patient convenience. Strategic partnerships between pharmaceutical manufacturers, research institutions, and healthcare providers are fostering collaborative efforts to accelerate drug development and market penetration. Market expansion strategies, including targeting underserved patient populations and exploring new geographical markets within North America, are also driving growth. The increasing focus on preventive healthcare and the proactive management of metabolic disorders will continue to boost demand for drugs like alpha-glucosidase inhibitors.
Key Players Shaping the Alpha-Glucosidase Inhibitors Market in North America Market
- Pfizer
- Glenmark pharma
- Sun pharma
- Hexalag
- Unichem
- Torrent
Notable Milestones in Alpha-Glucosidase Inhibitors Market in North America Sector
- April 2023: A study was planned to move towards drug repurposing by utilizing Food and Drug Administration (FDA)-approved drugs against glucosidase and investigating the molecular mechanisms. The target protein was refined and optimized by introducing missing residues and minimizing clashes to find the potential inhibitor against glucosidase.
- July 2022: The drug pricing regulator, the National Pharmaceutical Pricing Authority (NPPA), fixed the prices of 84 drug formulations, including those used for the treatment of diabetes. According to the order, a single tablet of Voglibose was expected to cost Rs 10.47 (USD 0.13), excluding GST.
In-Depth Alpha-Glucosidase Inhibitors Market in North America Market Outlook
The outlook for the Alpha-Glucosidase Inhibitors market in North America remains exceptionally promising, buoyed by several key growth accelerators. The persistent and growing prevalence of diabetes and prediabetes ensures a sustained and expanding patient base requiring effective glycemic management. Advancements in drug formulation and the exploration of novel therapeutic applications, such as preventative strategies for prediabetes and potential benefits beyond glucose control, are poised to unlock new market potential. Strategic collaborations and ongoing research into combination therapies will further enhance the therapeutic value proposition of these inhibitors. The market is expected to witness increased penetration as healthcare providers and payers recognize their cost-effectiveness in reducing long-term diabetes-related complications. This strategic positioning, coupled with a commitment to innovation, solidifies a robust future for alpha-glucosidase inhibitors in North America.
Alpha-Glucosidase Inhibitors Market in North America Segmentation
-
1. Product Type
- 1.1. Acarbose
- 1.2. Miglitol
- 1.3. Voglibose
-
2. Formulation
- 2.1. Oral tablets
- 2.2. Oral suspensions
- 2.3. Injectable solutions
-
3. Application
- 3.1. Type 2 diabetes
- 3.2. Prediabetes
- 3.3. Gestational diabetes
Alpha-Glucosidase Inhibitors Market in North America Segmentation By Geography
-
1. North America
- 1.1. United States
- 1.2. Canada
- 1.3. Mexico
-
2. South America
- 2.1. Brazil
- 2.2. Argentina
- 2.3. Rest of South America
-
3. Europe
- 3.1. United Kingdom
- 3.2. Germany
- 3.3. France
- 3.4. Italy
- 3.5. Spain
- 3.6. Russia
- 3.7. Benelux
- 3.8. Nordics
- 3.9. Rest of Europe
-
4. Middle East & Africa
- 4.1. Turkey
- 4.2. Israel
- 4.3. GCC
- 4.4. North Africa
- 4.5. South Africa
- 4.6. Rest of Middle East & Africa
-
5. Asia Pacific
- 5.1. China
- 5.2. India
- 5.3. Japan
- 5.4. South Korea
- 5.5. ASEAN
- 5.6. Oceania
- 5.7. Rest of Asia Pacific
Alpha-Glucosidase Inhibitors Market in North America Regional Market Share
Geographic Coverage of Alpha-Glucosidase Inhibitors Market in North America
Alpha-Glucosidase Inhibitors Market in North America REPORT HIGHLIGHTS
| Aspects | Details |
|---|---|
| Study Period | 2020-2034 |
| Base Year | 2025 |
| Estimated Year | 2026 |
| Forecast Period | 2026-2034 |
| Historical Period | 2020-2025 |
| Growth Rate | CAGR of 2.50% from 2020-2034 |
| Segmentation |
|
Table of Contents
- 1. Introduction
- 1.1. Research Scope
- 1.2. Market Segmentation
- 1.3. Research Objective
- 1.4. Definitions and Assumptions
- 2. Executive Summary
- 2.1. Market Snapshot
- 3. Market Dynamics
- 3.1. Market Drivers
- 3.2. Market Restrains
- 3.3. Market Trends
- 3.4. Market Opportunities
- 4. Market Factor Analysis
- 4.1. Porters Five Forces
- 4.1.1. Bargaining Power of Suppliers
- 4.1.2. Bargaining Power of Buyers
- 4.1.3. Threat of New Entrants
- 4.1.4. Threat of Substitutes
- 4.1.5. Competitive Rivalry
- 4.2. PESTEL analysis
- 4.3. BCG Analysis
- 4.3.1. Stars (High Growth, High Market Share)
- 4.3.2. Cash Cows (Low Growth, High Market Share)
- 4.3.3. Question Mark (High Growth, Low Market Share)
- 4.3.4. Dogs (Low Growth, Low Market Share)
- 4.4. Ansoff Matrix Analysis
- 4.5. Supply Chain Analysis
- 4.6. Regulatory Landscape
- 4.7. Current Market Potential and Opportunity Assessment (TAM–SAM–SOM Framework)
- 4.8. VDR Analyst Note
- 4.1. Porters Five Forces
- 5. Market Analysis, Insights and Forecast 2021-2033
- 5.1. Market Analysis, Insights and Forecast - by Product Type
- 5.1.1. Acarbose
- 5.1.2. Miglitol
- 5.1.3. Voglibose
- 5.2. Market Analysis, Insights and Forecast - by Formulation
- 5.2.1. Oral tablets
- 5.2.2. Oral suspensions
- 5.2.3. Injectable solutions
- 5.3. Market Analysis, Insights and Forecast - by Application
- 5.3.1. Type 2 diabetes
- 5.3.2. Prediabetes
- 5.3.3. Gestational diabetes
- 5.4. Market Analysis, Insights and Forecast - by Region
- 5.4.1. North America
- 5.4.2. South America
- 5.4.3. Europe
- 5.4.4. Middle East & Africa
- 5.4.5. Asia Pacific
- 5.1. Market Analysis, Insights and Forecast - by Product Type
- 6. Global Alpha-Glucosidase Inhibitors Market in North America Analysis, Insights and Forecast, 2021-2033
- 6.1. Market Analysis, Insights and Forecast - by Product Type
- 6.1.1. Acarbose
- 6.1.2. Miglitol
- 6.1.3. Voglibose
- 6.2. Market Analysis, Insights and Forecast - by Formulation
- 6.2.1. Oral tablets
- 6.2.2. Oral suspensions
- 6.2.3. Injectable solutions
- 6.3. Market Analysis, Insights and Forecast - by Application
- 6.3.1. Type 2 diabetes
- 6.3.2. Prediabetes
- 6.3.3. Gestational diabetes
- 6.1. Market Analysis, Insights and Forecast - by Product Type
- 7. North America Alpha-Glucosidase Inhibitors Market in North America Analysis, Insights and Forecast, 2021-2033
- 7.1. Market Analysis, Insights and Forecast - by Product Type
- 7.1.1. Acarbose
- 7.1.2. Miglitol
- 7.1.3. Voglibose
- 7.2. Market Analysis, Insights and Forecast - by Formulation
- 7.2.1. Oral tablets
- 7.2.2. Oral suspensions
- 7.2.3. Injectable solutions
- 7.3. Market Analysis, Insights and Forecast - by Application
- 7.3.1. Type 2 diabetes
- 7.3.2. Prediabetes
- 7.3.3. Gestational diabetes
- 7.1. Market Analysis, Insights and Forecast - by Product Type
- 8. South America Alpha-Glucosidase Inhibitors Market in North America Analysis, Insights and Forecast, 2021-2033
- 8.1. Market Analysis, Insights and Forecast - by Product Type
- 8.1.1. Acarbose
- 8.1.2. Miglitol
- 8.1.3. Voglibose
- 8.2. Market Analysis, Insights and Forecast - by Formulation
- 8.2.1. Oral tablets
- 8.2.2. Oral suspensions
- 8.2.3. Injectable solutions
- 8.3. Market Analysis, Insights and Forecast - by Application
- 8.3.1. Type 2 diabetes
- 8.3.2. Prediabetes
- 8.3.3. Gestational diabetes
- 8.1. Market Analysis, Insights and Forecast - by Product Type
- 9. Europe Alpha-Glucosidase Inhibitors Market in North America Analysis, Insights and Forecast, 2021-2033
- 9.1. Market Analysis, Insights and Forecast - by Product Type
- 9.1.1. Acarbose
- 9.1.2. Miglitol
- 9.1.3. Voglibose
- 9.2. Market Analysis, Insights and Forecast - by Formulation
- 9.2.1. Oral tablets
- 9.2.2. Oral suspensions
- 9.2.3. Injectable solutions
- 9.3. Market Analysis, Insights and Forecast - by Application
- 9.3.1. Type 2 diabetes
- 9.3.2. Prediabetes
- 9.3.3. Gestational diabetes
- 9.1. Market Analysis, Insights and Forecast - by Product Type
- 10. Middle East & Africa Alpha-Glucosidase Inhibitors Market in North America Analysis, Insights and Forecast, 2021-2033
- 10.1. Market Analysis, Insights and Forecast - by Product Type
- 10.1.1. Acarbose
- 10.1.2. Miglitol
- 10.1.3. Voglibose
- 10.2. Market Analysis, Insights and Forecast - by Formulation
- 10.2.1. Oral tablets
- 10.2.2. Oral suspensions
- 10.2.3. Injectable solutions
- 10.3. Market Analysis, Insights and Forecast - by Application
- 10.3.1. Type 2 diabetes
- 10.3.2. Prediabetes
- 10.3.3. Gestational diabetes
- 10.1. Market Analysis, Insights and Forecast - by Product Type
- 11. Asia Pacific Alpha-Glucosidase Inhibitors Market in North America Analysis, Insights and Forecast, 2021-2033
- 11.1. Market Analysis, Insights and Forecast - by Product Type
- 11.1.1. Acarbose
- 11.1.2. Miglitol
- 11.1.3. Voglibose
- 11.2. Market Analysis, Insights and Forecast - by Formulation
- 11.2.1. Oral tablets
- 11.2.2. Oral suspensions
- 11.2.3. Injectable solutions
- 11.3. Market Analysis, Insights and Forecast - by Application
- 11.3.1. Type 2 diabetes
- 11.3.2. Prediabetes
- 11.3.3. Gestational diabetes
- 11.1. Market Analysis, Insights and Forecast - by Product Type
- 12. Competitive Analysis
- 12.1. Company Profiles
- 12.1.1 Pfizer
- 12.1.1.1. Company Overview
- 12.1.1.2. Products
- 12.1.1.3. Company Financials
- 12.1.1.4. SWOT Analysis
- 12.1.2 Glenmark pharma
- 12.1.2.1. Company Overview
- 12.1.2.2. Products
- 12.1.2.3. Company Financials
- 12.1.2.4. SWOT Analysis
- 12.1.3 Sun pharma
- 12.1.3.1. Company Overview
- 12.1.3.2. Products
- 12.1.3.3. Company Financials
- 12.1.3.4. SWOT Analysis
- 12.1.4 Hexalag
- 12.1.4.1. Company Overview
- 12.1.4.2. Products
- 12.1.4.3. Company Financials
- 12.1.4.4. SWOT Analysis
- 12.1.5 Unichem
- 12.1.5.1. Company Overview
- 12.1.5.2. Products
- 12.1.5.3. Company Financials
- 12.1.5.4. SWOT Analysis
- 12.1.6 Torrent
- 12.1.6.1. Company Overview
- 12.1.6.2. Products
- 12.1.6.3. Company Financials
- 12.1.6.4. SWOT Analysis
- 12.1.1 Pfizer
- 12.2. Market Entropy
- 12.2.1 Company's Key Areas Served
- 12.2.2 Recent Developments
- 12.3. Company Market Share Analysis 2025
- 12.3.1 Top 5 Companies Market Share Analysis
- 12.3.2 Top 3 Companies Market Share Analysis
- 12.4. List of Potential Customers
- 13. Research Methodology
List of Figures
- Figure 1: Global Alpha-Glucosidase Inhibitors Market in North America Revenue Breakdown (Million, %) by Region 2025 & 2033
- Figure 2: Global Alpha-Glucosidase Inhibitors Market in North America Volume Breakdown (K Unit, %) by Region 2025 & 2033
- Figure 3: North America Alpha-Glucosidase Inhibitors Market in North America Revenue (Million), by Product Type 2025 & 2033
- Figure 4: North America Alpha-Glucosidase Inhibitors Market in North America Volume (K Unit), by Product Type 2025 & 2033
- Figure 5: North America Alpha-Glucosidase Inhibitors Market in North America Revenue Share (%), by Product Type 2025 & 2033
- Figure 6: North America Alpha-Glucosidase Inhibitors Market in North America Volume Share (%), by Product Type 2025 & 2033
- Figure 7: North America Alpha-Glucosidase Inhibitors Market in North America Revenue (Million), by Formulation 2025 & 2033
- Figure 8: North America Alpha-Glucosidase Inhibitors Market in North America Volume (K Unit), by Formulation 2025 & 2033
- Figure 9: North America Alpha-Glucosidase Inhibitors Market in North America Revenue Share (%), by Formulation 2025 & 2033
- Figure 10: North America Alpha-Glucosidase Inhibitors Market in North America Volume Share (%), by Formulation 2025 & 2033
- Figure 11: North America Alpha-Glucosidase Inhibitors Market in North America Revenue (Million), by Application 2025 & 2033
- Figure 12: North America Alpha-Glucosidase Inhibitors Market in North America Volume (K Unit), by Application 2025 & 2033
- Figure 13: North America Alpha-Glucosidase Inhibitors Market in North America Revenue Share (%), by Application 2025 & 2033
- Figure 14: North America Alpha-Glucosidase Inhibitors Market in North America Volume Share (%), by Application 2025 & 2033
- Figure 15: North America Alpha-Glucosidase Inhibitors Market in North America Revenue (Million), by Country 2025 & 2033
- Figure 16: North America Alpha-Glucosidase Inhibitors Market in North America Volume (K Unit), by Country 2025 & 2033
- Figure 17: North America Alpha-Glucosidase Inhibitors Market in North America Revenue Share (%), by Country 2025 & 2033
- Figure 18: North America Alpha-Glucosidase Inhibitors Market in North America Volume Share (%), by Country 2025 & 2033
- Figure 19: South America Alpha-Glucosidase Inhibitors Market in North America Revenue (Million), by Product Type 2025 & 2033
- Figure 20: South America Alpha-Glucosidase Inhibitors Market in North America Volume (K Unit), by Product Type 2025 & 2033
- Figure 21: South America Alpha-Glucosidase Inhibitors Market in North America Revenue Share (%), by Product Type 2025 & 2033
- Figure 22: South America Alpha-Glucosidase Inhibitors Market in North America Volume Share (%), by Product Type 2025 & 2033
- Figure 23: South America Alpha-Glucosidase Inhibitors Market in North America Revenue (Million), by Formulation 2025 & 2033
- Figure 24: South America Alpha-Glucosidase Inhibitors Market in North America Volume (K Unit), by Formulation 2025 & 2033
- Figure 25: South America Alpha-Glucosidase Inhibitors Market in North America Revenue Share (%), by Formulation 2025 & 2033
- Figure 26: South America Alpha-Glucosidase Inhibitors Market in North America Volume Share (%), by Formulation 2025 & 2033
- Figure 27: South America Alpha-Glucosidase Inhibitors Market in North America Revenue (Million), by Application 2025 & 2033
- Figure 28: South America Alpha-Glucosidase Inhibitors Market in North America Volume (K Unit), by Application 2025 & 2033
- Figure 29: South America Alpha-Glucosidase Inhibitors Market in North America Revenue Share (%), by Application 2025 & 2033
- Figure 30: South America Alpha-Glucosidase Inhibitors Market in North America Volume Share (%), by Application 2025 & 2033
- Figure 31: South America Alpha-Glucosidase Inhibitors Market in North America Revenue (Million), by Country 2025 & 2033
- Figure 32: South America Alpha-Glucosidase Inhibitors Market in North America Volume (K Unit), by Country 2025 & 2033
- Figure 33: South America Alpha-Glucosidase Inhibitors Market in North America Revenue Share (%), by Country 2025 & 2033
- Figure 34: South America Alpha-Glucosidase Inhibitors Market in North America Volume Share (%), by Country 2025 & 2033
- Figure 35: Europe Alpha-Glucosidase Inhibitors Market in North America Revenue (Million), by Product Type 2025 & 2033
- Figure 36: Europe Alpha-Glucosidase Inhibitors Market in North America Volume (K Unit), by Product Type 2025 & 2033
- Figure 37: Europe Alpha-Glucosidase Inhibitors Market in North America Revenue Share (%), by Product Type 2025 & 2033
- Figure 38: Europe Alpha-Glucosidase Inhibitors Market in North America Volume Share (%), by Product Type 2025 & 2033
- Figure 39: Europe Alpha-Glucosidase Inhibitors Market in North America Revenue (Million), by Formulation 2025 & 2033
- Figure 40: Europe Alpha-Glucosidase Inhibitors Market in North America Volume (K Unit), by Formulation 2025 & 2033
- Figure 41: Europe Alpha-Glucosidase Inhibitors Market in North America Revenue Share (%), by Formulation 2025 & 2033
- Figure 42: Europe Alpha-Glucosidase Inhibitors Market in North America Volume Share (%), by Formulation 2025 & 2033
- Figure 43: Europe Alpha-Glucosidase Inhibitors Market in North America Revenue (Million), by Application 2025 & 2033
- Figure 44: Europe Alpha-Glucosidase Inhibitors Market in North America Volume (K Unit), by Application 2025 & 2033
- Figure 45: Europe Alpha-Glucosidase Inhibitors Market in North America Revenue Share (%), by Application 2025 & 2033
- Figure 46: Europe Alpha-Glucosidase Inhibitors Market in North America Volume Share (%), by Application 2025 & 2033
- Figure 47: Europe Alpha-Glucosidase Inhibitors Market in North America Revenue (Million), by Country 2025 & 2033
- Figure 48: Europe Alpha-Glucosidase Inhibitors Market in North America Volume (K Unit), by Country 2025 & 2033
- Figure 49: Europe Alpha-Glucosidase Inhibitors Market in North America Revenue Share (%), by Country 2025 & 2033
- Figure 50: Europe Alpha-Glucosidase Inhibitors Market in North America Volume Share (%), by Country 2025 & 2033
- Figure 51: Middle East & Africa Alpha-Glucosidase Inhibitors Market in North America Revenue (Million), by Product Type 2025 & 2033
- Figure 52: Middle East & Africa Alpha-Glucosidase Inhibitors Market in North America Volume (K Unit), by Product Type 2025 & 2033
- Figure 53: Middle East & Africa Alpha-Glucosidase Inhibitors Market in North America Revenue Share (%), by Product Type 2025 & 2033
- Figure 54: Middle East & Africa Alpha-Glucosidase Inhibitors Market in North America Volume Share (%), by Product Type 2025 & 2033
- Figure 55: Middle East & Africa Alpha-Glucosidase Inhibitors Market in North America Revenue (Million), by Formulation 2025 & 2033
- Figure 56: Middle East & Africa Alpha-Glucosidase Inhibitors Market in North America Volume (K Unit), by Formulation 2025 & 2033
- Figure 57: Middle East & Africa Alpha-Glucosidase Inhibitors Market in North America Revenue Share (%), by Formulation 2025 & 2033
- Figure 58: Middle East & Africa Alpha-Glucosidase Inhibitors Market in North America Volume Share (%), by Formulation 2025 & 2033
- Figure 59: Middle East & Africa Alpha-Glucosidase Inhibitors Market in North America Revenue (Million), by Application 2025 & 2033
- Figure 60: Middle East & Africa Alpha-Glucosidase Inhibitors Market in North America Volume (K Unit), by Application 2025 & 2033
- Figure 61: Middle East & Africa Alpha-Glucosidase Inhibitors Market in North America Revenue Share (%), by Application 2025 & 2033
- Figure 62: Middle East & Africa Alpha-Glucosidase Inhibitors Market in North America Volume Share (%), by Application 2025 & 2033
- Figure 63: Middle East & Africa Alpha-Glucosidase Inhibitors Market in North America Revenue (Million), by Country 2025 & 2033
- Figure 64: Middle East & Africa Alpha-Glucosidase Inhibitors Market in North America Volume (K Unit), by Country 2025 & 2033
- Figure 65: Middle East & Africa Alpha-Glucosidase Inhibitors Market in North America Revenue Share (%), by Country 2025 & 2033
- Figure 66: Middle East & Africa Alpha-Glucosidase Inhibitors Market in North America Volume Share (%), by Country 2025 & 2033
- Figure 67: Asia Pacific Alpha-Glucosidase Inhibitors Market in North America Revenue (Million), by Product Type 2025 & 2033
- Figure 68: Asia Pacific Alpha-Glucosidase Inhibitors Market in North America Volume (K Unit), by Product Type 2025 & 2033
- Figure 69: Asia Pacific Alpha-Glucosidase Inhibitors Market in North America Revenue Share (%), by Product Type 2025 & 2033
- Figure 70: Asia Pacific Alpha-Glucosidase Inhibitors Market in North America Volume Share (%), by Product Type 2025 & 2033
- Figure 71: Asia Pacific Alpha-Glucosidase Inhibitors Market in North America Revenue (Million), by Formulation 2025 & 2033
- Figure 72: Asia Pacific Alpha-Glucosidase Inhibitors Market in North America Volume (K Unit), by Formulation 2025 & 2033
- Figure 73: Asia Pacific Alpha-Glucosidase Inhibitors Market in North America Revenue Share (%), by Formulation 2025 & 2033
- Figure 74: Asia Pacific Alpha-Glucosidase Inhibitors Market in North America Volume Share (%), by Formulation 2025 & 2033
- Figure 75: Asia Pacific Alpha-Glucosidase Inhibitors Market in North America Revenue (Million), by Application 2025 & 2033
- Figure 76: Asia Pacific Alpha-Glucosidase Inhibitors Market in North America Volume (K Unit), by Application 2025 & 2033
- Figure 77: Asia Pacific Alpha-Glucosidase Inhibitors Market in North America Revenue Share (%), by Application 2025 & 2033
- Figure 78: Asia Pacific Alpha-Glucosidase Inhibitors Market in North America Volume Share (%), by Application 2025 & 2033
- Figure 79: Asia Pacific Alpha-Glucosidase Inhibitors Market in North America Revenue (Million), by Country 2025 & 2033
- Figure 80: Asia Pacific Alpha-Glucosidase Inhibitors Market in North America Volume (K Unit), by Country 2025 & 2033
- Figure 81: Asia Pacific Alpha-Glucosidase Inhibitors Market in North America Revenue Share (%), by Country 2025 & 2033
- Figure 82: Asia Pacific Alpha-Glucosidase Inhibitors Market in North America Volume Share (%), by Country 2025 & 2033
List of Tables
- Table 1: Global Alpha-Glucosidase Inhibitors Market in North America Revenue Million Forecast, by Product Type 2020 & 2033
- Table 2: Global Alpha-Glucosidase Inhibitors Market in North America Volume K Unit Forecast, by Product Type 2020 & 2033
- Table 3: Global Alpha-Glucosidase Inhibitors Market in North America Revenue Million Forecast, by Formulation 2020 & 2033
- Table 4: Global Alpha-Glucosidase Inhibitors Market in North America Volume K Unit Forecast, by Formulation 2020 & 2033
- Table 5: Global Alpha-Glucosidase Inhibitors Market in North America Revenue Million Forecast, by Application 2020 & 2033
- Table 6: Global Alpha-Glucosidase Inhibitors Market in North America Volume K Unit Forecast, by Application 2020 & 2033
- Table 7: Global Alpha-Glucosidase Inhibitors Market in North America Revenue Million Forecast, by Region 2020 & 2033
- Table 8: Global Alpha-Glucosidase Inhibitors Market in North America Volume K Unit Forecast, by Region 2020 & 2033
- Table 9: Global Alpha-Glucosidase Inhibitors Market in North America Revenue Million Forecast, by Product Type 2020 & 2033
- Table 10: Global Alpha-Glucosidase Inhibitors Market in North America Volume K Unit Forecast, by Product Type 2020 & 2033
- Table 11: Global Alpha-Glucosidase Inhibitors Market in North America Revenue Million Forecast, by Formulation 2020 & 2033
- Table 12: Global Alpha-Glucosidase Inhibitors Market in North America Volume K Unit Forecast, by Formulation 2020 & 2033
- Table 13: Global Alpha-Glucosidase Inhibitors Market in North America Revenue Million Forecast, by Application 2020 & 2033
- Table 14: Global Alpha-Glucosidase Inhibitors Market in North America Volume K Unit Forecast, by Application 2020 & 2033
- Table 15: Global Alpha-Glucosidase Inhibitors Market in North America Revenue Million Forecast, by Country 2020 & 2033
- Table 16: Global Alpha-Glucosidase Inhibitors Market in North America Volume K Unit Forecast, by Country 2020 & 2033
- Table 17: United States Alpha-Glucosidase Inhibitors Market in North America Revenue (Million) Forecast, by Application 2020 & 2033
- Table 18: United States Alpha-Glucosidase Inhibitors Market in North America Volume (K Unit) Forecast, by Application 2020 & 2033
- Table 19: Canada Alpha-Glucosidase Inhibitors Market in North America Revenue (Million) Forecast, by Application 2020 & 2033
- Table 20: Canada Alpha-Glucosidase Inhibitors Market in North America Volume (K Unit) Forecast, by Application 2020 & 2033
- Table 21: Mexico Alpha-Glucosidase Inhibitors Market in North America Revenue (Million) Forecast, by Application 2020 & 2033
- Table 22: Mexico Alpha-Glucosidase Inhibitors Market in North America Volume (K Unit) Forecast, by Application 2020 & 2033
- Table 23: Global Alpha-Glucosidase Inhibitors Market in North America Revenue Million Forecast, by Product Type 2020 & 2033
- Table 24: Global Alpha-Glucosidase Inhibitors Market in North America Volume K Unit Forecast, by Product Type 2020 & 2033
- Table 25: Global Alpha-Glucosidase Inhibitors Market in North America Revenue Million Forecast, by Formulation 2020 & 2033
- Table 26: Global Alpha-Glucosidase Inhibitors Market in North America Volume K Unit Forecast, by Formulation 2020 & 2033
- Table 27: Global Alpha-Glucosidase Inhibitors Market in North America Revenue Million Forecast, by Application 2020 & 2033
- Table 28: Global Alpha-Glucosidase Inhibitors Market in North America Volume K Unit Forecast, by Application 2020 & 2033
- Table 29: Global Alpha-Glucosidase Inhibitors Market in North America Revenue Million Forecast, by Country 2020 & 2033
- Table 30: Global Alpha-Glucosidase Inhibitors Market in North America Volume K Unit Forecast, by Country 2020 & 2033
- Table 31: Brazil Alpha-Glucosidase Inhibitors Market in North America Revenue (Million) Forecast, by Application 2020 & 2033
- Table 32: Brazil Alpha-Glucosidase Inhibitors Market in North America Volume (K Unit) Forecast, by Application 2020 & 2033
- Table 33: Argentina Alpha-Glucosidase Inhibitors Market in North America Revenue (Million) Forecast, by Application 2020 & 2033
- Table 34: Argentina Alpha-Glucosidase Inhibitors Market in North America Volume (K Unit) Forecast, by Application 2020 & 2033
- Table 35: Rest of South America Alpha-Glucosidase Inhibitors Market in North America Revenue (Million) Forecast, by Application 2020 & 2033
- Table 36: Rest of South America Alpha-Glucosidase Inhibitors Market in North America Volume (K Unit) Forecast, by Application 2020 & 2033
- Table 37: Global Alpha-Glucosidase Inhibitors Market in North America Revenue Million Forecast, by Product Type 2020 & 2033
- Table 38: Global Alpha-Glucosidase Inhibitors Market in North America Volume K Unit Forecast, by Product Type 2020 & 2033
- Table 39: Global Alpha-Glucosidase Inhibitors Market in North America Revenue Million Forecast, by Formulation 2020 & 2033
- Table 40: Global Alpha-Glucosidase Inhibitors Market in North America Volume K Unit Forecast, by Formulation 2020 & 2033
- Table 41: Global Alpha-Glucosidase Inhibitors Market in North America Revenue Million Forecast, by Application 2020 & 2033
- Table 42: Global Alpha-Glucosidase Inhibitors Market in North America Volume K Unit Forecast, by Application 2020 & 2033
- Table 43: Global Alpha-Glucosidase Inhibitors Market in North America Revenue Million Forecast, by Country 2020 & 2033
- Table 44: Global Alpha-Glucosidase Inhibitors Market in North America Volume K Unit Forecast, by Country 2020 & 2033
- Table 45: United Kingdom Alpha-Glucosidase Inhibitors Market in North America Revenue (Million) Forecast, by Application 2020 & 2033
- Table 46: United Kingdom Alpha-Glucosidase Inhibitors Market in North America Volume (K Unit) Forecast, by Application 2020 & 2033
- Table 47: Germany Alpha-Glucosidase Inhibitors Market in North America Revenue (Million) Forecast, by Application 2020 & 2033
- Table 48: Germany Alpha-Glucosidase Inhibitors Market in North America Volume (K Unit) Forecast, by Application 2020 & 2033
- Table 49: France Alpha-Glucosidase Inhibitors Market in North America Revenue (Million) Forecast, by Application 2020 & 2033
- Table 50: France Alpha-Glucosidase Inhibitors Market in North America Volume (K Unit) Forecast, by Application 2020 & 2033
- Table 51: Italy Alpha-Glucosidase Inhibitors Market in North America Revenue (Million) Forecast, by Application 2020 & 2033
- Table 52: Italy Alpha-Glucosidase Inhibitors Market in North America Volume (K Unit) Forecast, by Application 2020 & 2033
- Table 53: Spain Alpha-Glucosidase Inhibitors Market in North America Revenue (Million) Forecast, by Application 2020 & 2033
- Table 54: Spain Alpha-Glucosidase Inhibitors Market in North America Volume (K Unit) Forecast, by Application 2020 & 2033
- Table 55: Russia Alpha-Glucosidase Inhibitors Market in North America Revenue (Million) Forecast, by Application 2020 & 2033
- Table 56: Russia Alpha-Glucosidase Inhibitors Market in North America Volume (K Unit) Forecast, by Application 2020 & 2033
- Table 57: Benelux Alpha-Glucosidase Inhibitors Market in North America Revenue (Million) Forecast, by Application 2020 & 2033
- Table 58: Benelux Alpha-Glucosidase Inhibitors Market in North America Volume (K Unit) Forecast, by Application 2020 & 2033
- Table 59: Nordics Alpha-Glucosidase Inhibitors Market in North America Revenue (Million) Forecast, by Application 2020 & 2033
- Table 60: Nordics Alpha-Glucosidase Inhibitors Market in North America Volume (K Unit) Forecast, by Application 2020 & 2033
- Table 61: Rest of Europe Alpha-Glucosidase Inhibitors Market in North America Revenue (Million) Forecast, by Application 2020 & 2033
- Table 62: Rest of Europe Alpha-Glucosidase Inhibitors Market in North America Volume (K Unit) Forecast, by Application 2020 & 2033
- Table 63: Global Alpha-Glucosidase Inhibitors Market in North America Revenue Million Forecast, by Product Type 2020 & 2033
- Table 64: Global Alpha-Glucosidase Inhibitors Market in North America Volume K Unit Forecast, by Product Type 2020 & 2033
- Table 65: Global Alpha-Glucosidase Inhibitors Market in North America Revenue Million Forecast, by Formulation 2020 & 2033
- Table 66: Global Alpha-Glucosidase Inhibitors Market in North America Volume K Unit Forecast, by Formulation 2020 & 2033
- Table 67: Global Alpha-Glucosidase Inhibitors Market in North America Revenue Million Forecast, by Application 2020 & 2033
- Table 68: Global Alpha-Glucosidase Inhibitors Market in North America Volume K Unit Forecast, by Application 2020 & 2033
- Table 69: Global Alpha-Glucosidase Inhibitors Market in North America Revenue Million Forecast, by Country 2020 & 2033
- Table 70: Global Alpha-Glucosidase Inhibitors Market in North America Volume K Unit Forecast, by Country 2020 & 2033
- Table 71: Turkey Alpha-Glucosidase Inhibitors Market in North America Revenue (Million) Forecast, by Application 2020 & 2033
- Table 72: Turkey Alpha-Glucosidase Inhibitors Market in North America Volume (K Unit) Forecast, by Application 2020 & 2033
- Table 73: Israel Alpha-Glucosidase Inhibitors Market in North America Revenue (Million) Forecast, by Application 2020 & 2033
- Table 74: Israel Alpha-Glucosidase Inhibitors Market in North America Volume (K Unit) Forecast, by Application 2020 & 2033
- Table 75: GCC Alpha-Glucosidase Inhibitors Market in North America Revenue (Million) Forecast, by Application 2020 & 2033
- Table 76: GCC Alpha-Glucosidase Inhibitors Market in North America Volume (K Unit) Forecast, by Application 2020 & 2033
- Table 77: North Africa Alpha-Glucosidase Inhibitors Market in North America Revenue (Million) Forecast, by Application 2020 & 2033
- Table 78: North Africa Alpha-Glucosidase Inhibitors Market in North America Volume (K Unit) Forecast, by Application 2020 & 2033
- Table 79: South Africa Alpha-Glucosidase Inhibitors Market in North America Revenue (Million) Forecast, by Application 2020 & 2033
- Table 80: South Africa Alpha-Glucosidase Inhibitors Market in North America Volume (K Unit) Forecast, by Application 2020 & 2033
- Table 81: Rest of Middle East & Africa Alpha-Glucosidase Inhibitors Market in North America Revenue (Million) Forecast, by Application 2020 & 2033
- Table 82: Rest of Middle East & Africa Alpha-Glucosidase Inhibitors Market in North America Volume (K Unit) Forecast, by Application 2020 & 2033
- Table 83: Global Alpha-Glucosidase Inhibitors Market in North America Revenue Million Forecast, by Product Type 2020 & 2033
- Table 84: Global Alpha-Glucosidase Inhibitors Market in North America Volume K Unit Forecast, by Product Type 2020 & 2033
- Table 85: Global Alpha-Glucosidase Inhibitors Market in North America Revenue Million Forecast, by Formulation 2020 & 2033
- Table 86: Global Alpha-Glucosidase Inhibitors Market in North America Volume K Unit Forecast, by Formulation 2020 & 2033
- Table 87: Global Alpha-Glucosidase Inhibitors Market in North America Revenue Million Forecast, by Application 2020 & 2033
- Table 88: Global Alpha-Glucosidase Inhibitors Market in North America Volume K Unit Forecast, by Application 2020 & 2033
- Table 89: Global Alpha-Glucosidase Inhibitors Market in North America Revenue Million Forecast, by Country 2020 & 2033
- Table 90: Global Alpha-Glucosidase Inhibitors Market in North America Volume K Unit Forecast, by Country 2020 & 2033
- Table 91: China Alpha-Glucosidase Inhibitors Market in North America Revenue (Million) Forecast, by Application 2020 & 2033
- Table 92: China Alpha-Glucosidase Inhibitors Market in North America Volume (K Unit) Forecast, by Application 2020 & 2033
- Table 93: India Alpha-Glucosidase Inhibitors Market in North America Revenue (Million) Forecast, by Application 2020 & 2033
- Table 94: India Alpha-Glucosidase Inhibitors Market in North America Volume (K Unit) Forecast, by Application 2020 & 2033
- Table 95: Japan Alpha-Glucosidase Inhibitors Market in North America Revenue (Million) Forecast, by Application 2020 & 2033
- Table 96: Japan Alpha-Glucosidase Inhibitors Market in North America Volume (K Unit) Forecast, by Application 2020 & 2033
- Table 97: South Korea Alpha-Glucosidase Inhibitors Market in North America Revenue (Million) Forecast, by Application 2020 & 2033
- Table 98: South Korea Alpha-Glucosidase Inhibitors Market in North America Volume (K Unit) Forecast, by Application 2020 & 2033
- Table 99: ASEAN Alpha-Glucosidase Inhibitors Market in North America Revenue (Million) Forecast, by Application 2020 & 2033
- Table 100: ASEAN Alpha-Glucosidase Inhibitors Market in North America Volume (K Unit) Forecast, by Application 2020 & 2033
- Table 101: Oceania Alpha-Glucosidase Inhibitors Market in North America Revenue (Million) Forecast, by Application 2020 & 2033
- Table 102: Oceania Alpha-Glucosidase Inhibitors Market in North America Volume (K Unit) Forecast, by Application 2020 & 2033
- Table 103: Rest of Asia Pacific Alpha-Glucosidase Inhibitors Market in North America Revenue (Million) Forecast, by Application 2020 & 2033
- Table 104: Rest of Asia Pacific Alpha-Glucosidase Inhibitors Market in North America Volume (K Unit) Forecast, by Application 2020 & 2033
Frequently Asked Questions
1. What is the projected Compound Annual Growth Rate (CAGR) of the Alpha-Glucosidase Inhibitors Market in North America?
The projected CAGR is approximately 2.50%.
2. Which companies are prominent players in the Alpha-Glucosidase Inhibitors Market in North America?
Key companies in the market include Pfizer, Glenmark pharma, Sun pharma, Hexalag, Unichem, Torrent.
3. What are the main segments of the Alpha-Glucosidase Inhibitors Market in North America?
The market segments include Product Type, Formulation, Application.
4. Can you provide details about the market size?
The market size is estimated to be USD 0.28 Million as of 2022.
5. What are some drivers contributing to market growth?
Increasing Burden of Chronic Pain and Inflammation; Preference of NSAIDs over Other Class of Pain Relievers.
6. What are the notable trends driving market growth?
Rising Diabetes Prevalence in North America Region.
7. Are there any restraints impacting market growth?
High Cost of Drug Development and Launches; Side Effects of NSAIDs.
8. Can you provide examples of recent developments in the market?
April 2023: A study was planned to move towards drug repurposing by utilizing Food and Drug Administration (FDA)-approved drugs against glucosidase and investigating the molecular mechanisms. The target protein was refined and optimized by introducing missing residues and minimizing clashes to find the potential inhibitor against glucosidase.
9. What pricing options are available for accessing the report?
Pricing options include single-user, multi-user, and enterprise licenses priced at USD 4750, USD 5250, and USD 8750 respectively.
10. Is the market size provided in terms of value or volume?
The market size is provided in terms of value, measured in Million and volume, measured in K Unit.
11. Are there any specific market keywords associated with the report?
Yes, the market keyword associated with the report is "Alpha-Glucosidase Inhibitors Market in North America," which aids in identifying and referencing the specific market segment covered.
12. How do I determine which pricing option suits my needs best?
The pricing options vary based on user requirements and access needs. Individual users may opt for single-user licenses, while businesses requiring broader access may choose multi-user or enterprise licenses for cost-effective access to the report.
13. Are there any additional resources or data provided in the Alpha-Glucosidase Inhibitors Market in North America report?
While the report offers comprehensive insights, it's advisable to review the specific contents or supplementary materials provided to ascertain if additional resources or data are available.
14. How can I stay updated on further developments or reports in the Alpha-Glucosidase Inhibitors Market in North America?
To stay informed about further developments, trends, and reports in the Alpha-Glucosidase Inhibitors Market in North America, consider subscribing to industry newsletters, following relevant companies and organizations, or regularly checking reputable industry news sources and publications.
Methodology
Step 1 - Identification of Relevant Samples Size from Population Database


Step 2 - Approaches for Defining Global Market Size (Value, Volume* & Price*)

Note*: In applicable scenarios
Step 3 - Data Sources
Primary Research
- Web Analytics
- Survey Reports
- Research Institute
- Latest Research Reports
- Opinion Leaders
Secondary Research
- Annual Reports
- White Paper
- Latest Press Release
- Industry Association
- Paid Database
- Investor Presentations

Step 4 - Data Triangulation
Involves using different sources of information in order to increase the validity of a study
These sources are likely to be stakeholders in a program - participants, other researchers, program staff, other community members, and so on.
Then we put all data in single framework & apply various statistical tools to find out the dynamic on the market.
During the analysis stage, feedback from the stakeholder groups would be compared to determine areas of agreement as well as areas of divergence