

Key Insights
The global algaculture market is poised for significant expansion, driven by escalating demand for algal biomass across various industries. The estimated market size for 2025 is projected to reach $39.9 billion, reflecting the substantial growth trajectory of seaweed farming and the increasing adoption of sustainable bioproducts. Key growth drivers include the rising popularity of algal-based food products, such as supplements and functional foods, expanding applications in biofuels and bioplastics to address environmental concerns, and the growing utilization of algae in pharmaceuticals and cosmetics for their potent bioactive compounds. Government support for sustainable aquaculture and advancements in cultivation technologies further fuel market growth. However, challenges persist, including ensuring consistent biomass quality, managing the high costs of large-scale cultivation and harvesting, and optimizing extraction processes for valuable compounds. Market segmentation reveals substantial opportunities within specific applications (food, feed, biofuels) and algae types (brown, red, green algae), enabling specialized production and targeted marketing. Leading companies are strategically investing in research and development and expanding production capacities to capitalize on this burgeoning market. The forecast period (2025-2033) anticipates a robust Compound Annual Growth Rate (CAGR) exceeding 8%, indicating considerable market expansion driven by ongoing technological innovation and market diversification.
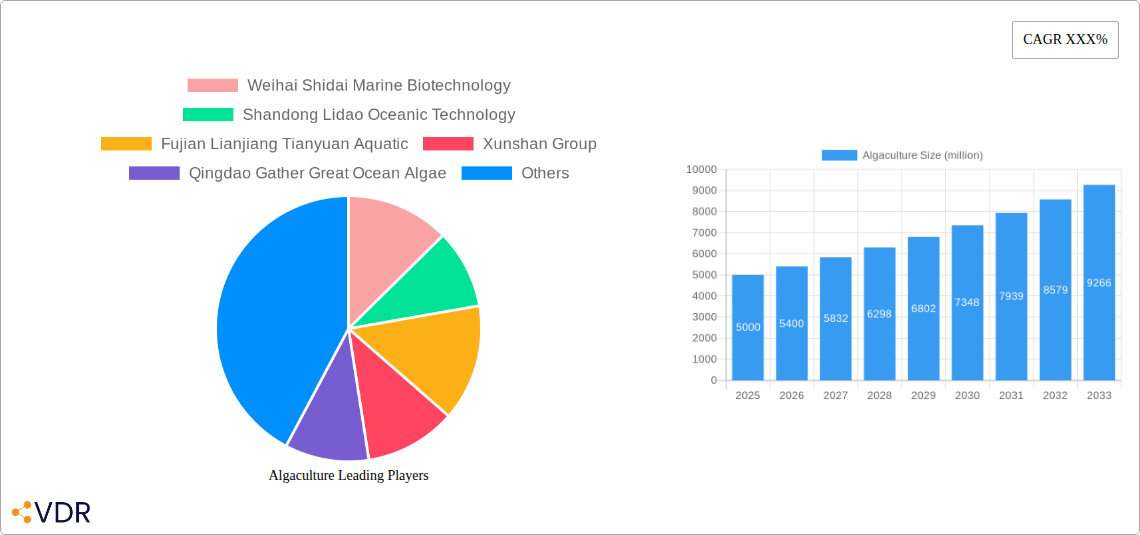
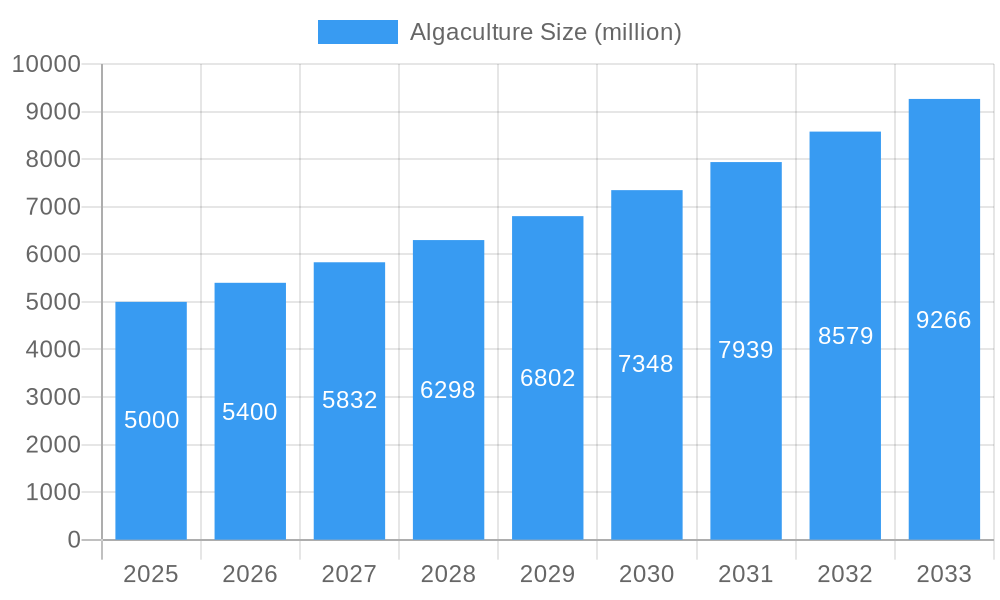
Algaculture Market Size (In Billion)
The competitive landscape features both established industry leaders and innovative emerging companies. Key players are prioritizing advancements in cultivation techniques, the development of value-added products, and strategic market share acquisition. Regional market concentration is expected in areas with favorable climates and established aquaculture infrastructure. Sustained growth will be contingent upon overcoming production scaling challenges, enhancing the sustainability of cultivation practices, and meeting the demand for high-quality algal products. This necessitates strong industry collaboration, dedicated research investment, and effective regulatory frameworks.
Algaculture Company Market Share
Algaculture Market Report: 2019-2033
This comprehensive report provides a detailed analysis of the global algaculture market, encompassing market dynamics, growth trends, regional insights, product landscape, key players, and future outlook. The study period covers 2019-2033, with 2025 serving as the base and estimated year. The forecast period spans 2025-2033, and the historical period encompasses 2019-2024. The report caters to industry professionals, investors, and researchers seeking in-depth understanding of this rapidly evolving sector, with a focus on the parent market of aquaculture and the child market of food and feed applications. The total market size in 2025 is estimated at $XX billion.
Algaculture Market Dynamics & Structure
The global algaculture market exhibits a moderately concentrated structure, with several large players and numerous smaller, regional producers. Technological innovation, particularly in cultivation techniques and downstream processing, is a key driver, alongside increasing demand for sustainable food and feed sources. Regulatory frameworks vary significantly across regions, influencing production costs and market access. Competitive substitutes, such as traditional protein sources, pose a challenge, though the unique nutritional and functional properties of algae are increasingly recognized. End-user demographics are expanding, with growing consumer interest in plant-based diets and sustainable products. M&A activity in the sector has been moderate, with a focus on consolidating production capacity and expanding geographical reach. Over the historical period (2019-2024), approximately xx M&A deals were recorded, with a total value of $xx billion.
- Market Concentration: Moderately concentrated, with top 5 players holding xx% market share in 2025.
- Technological Innovation: Focus on automation, genetic engineering, and improved harvesting techniques.
- Regulatory Landscape: Varying regulations across countries impacting production costs and market access.
- Competitive Substitutes: Traditional protein sources and other feed ingredients.
- End-User Demographics: Growing consumer awareness of sustainable and healthy food choices driving demand.
- M&A Activity: Moderate activity, primarily focused on consolidation and expansion.
Algaculture Growth Trends & Insights
The algaculture market has witnessed robust growth over the historical period, driven by increasing demand for sustainable food and feed, alongside advancements in cultivation technologies. The market size expanded from $xx billion in 2019 to an estimated $xx billion in 2025, exhibiting a compound annual growth rate (CAGR) of xx% during this period. Market penetration remains relatively low in many regions, indicating significant growth potential. Technological disruptions, such as automation and precision fermentation, are poised to further enhance productivity and reduce costs. Consumer behavior is shifting towards more sustainable and plant-based options, creating favorable market conditions for algae-based products. The adoption rate of algae-based products is projected to increase by xx% annually in the forecast period, reaching xx% market penetration by 2033.
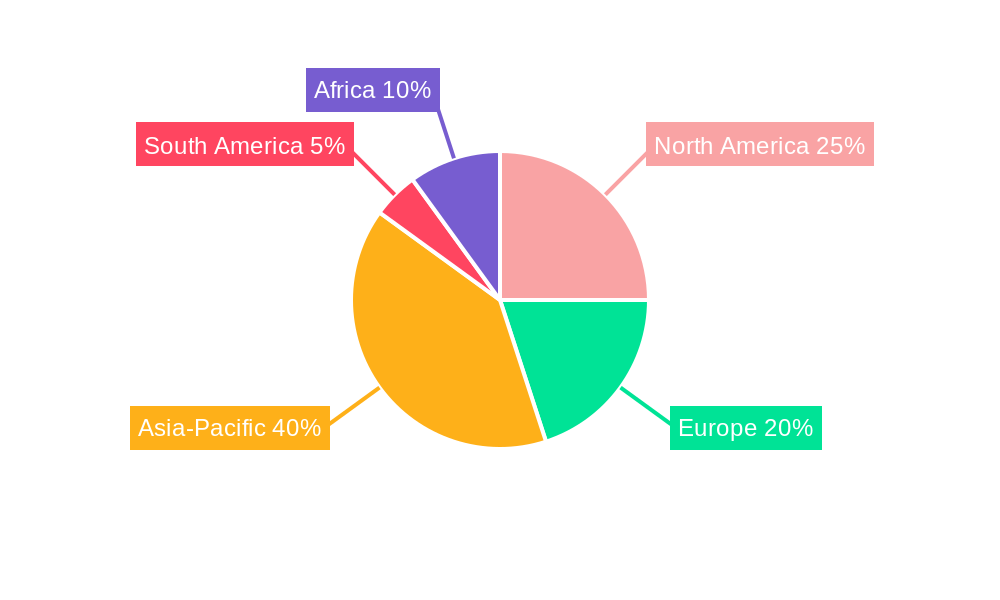
Dominant Regions, Countries, or Segments in Algaculture
Asia, particularly China, dominates the global algaculture market, accounting for xx% of the global market share in 2025. This dominance is driven by favorable climatic conditions, established cultivation practices, and a large domestic market for food and feed applications. Strong government support for aquaculture and the bioeconomy further strengthens the region's position. Specific countries like China, Indonesia, and Japan exhibit significant growth potential within the region due to their established infrastructure, large populations and strategic investment.
- Key Drivers in Asia:
- Favorable climatic conditions and existing infrastructure.
- Government support for aquaculture and the bioeconomy.
- Large domestic market for food and feed.
- Abundant resources and low labor costs.
- Dominance Factors:
- Established cultivation practices and substantial production capacity.
- Strong governmental policies promoting aquaculture.
- High demand for algae-based products in the food and feed industries.
Algaculture Product Landscape
The algaculture product landscape is diverse, encompassing various types of algae cultivated for food, feed, biofuels, and other applications. Innovation focuses on improving cultivation efficiency, enhancing nutritional profiles, and developing new applications. Key trends include the development of high-value extracts, functional foods incorporating algae ingredients, and advanced processing techniques to improve product quality and shelf life. Unique selling propositions often center around sustainability, nutritional benefits, and novel functionalities.
Key Drivers, Barriers & Challenges in Algaculture
Key Drivers:
- Growing demand for sustainable food and feed.
- Technological advancements in cultivation and processing.
- Increasing consumer awareness of algae's nutritional benefits.
- Government support for the bioeconomy.
Challenges:
- High initial investment costs for cultivation infrastructure.
- Fluctuations in algae biomass yields due to environmental factors.
- Limited consumer familiarity with algae-based products in some markets.
- Regulatory uncertainty surrounding algae-derived food and feed products. The estimated cost associated with regulatory hurdles could reach $xx million annually.
Emerging Opportunities in Algaculture
- Expansion into untapped markets, especially in the developed world.
- Development of new applications for algae in cosmetics, pharmaceuticals, and bioplastics.
- Customization of algae strains for specific applications, improving efficiency and yield.
- Collaboration between researchers, producers, and end-users to facilitate market penetration and product development.
Growth Accelerators in the Algaculture Industry
Technological breakthroughs in strain improvement and cultivation techniques are driving efficiency and reducing costs. Strategic partnerships between producers, researchers and end-users are accelerating product development and market penetration. Government policies supporting the bioeconomy and providing incentives for algae cultivation are creating a positive market environment. Market expansion strategies, including diversification of applications and exploration of new geographical regions, promise substantial growth opportunities.
Key Players Shaping the Algaculture Market
- Weihai Shidai Marine Biotechnology
- Shandong Lidao Oceanic Technology
- Fujian Lianjiang Tianyuan Aquatic
- Xunshan Group
- Qingdao Gather Great Ocean Algae
- Fujian Yiyuan Sea Food Company
- Fujian Huangqiwan Sea Food Biotechnology
- Rongcheng Lidao Chenfenzhuang Hongqiang Kelp Factory
- Rongcheng Lidao Chenfenzhuang Weijian Kelp Factory
- Rongcheng Yandunjiao Aquatic Company
- Shandong Gaolv Aquatic Company
- Shandong Haizhibao Technology
- Matsumaeya
- Shemberg
- Karagen Indonesia
- MCPI
Notable Milestones in Algaculture Sector
- 2020: Successful field trials of a high-yield algae strain by a leading research institute.
- 2022: Launch of a novel algae-based food product by a major food company.
- 2023: Acquisition of a smaller algae producer by a multinational corporation.
- 2024: Government announcement of significant funding for algae research and development.
In-Depth Algaculture Market Outlook
The algaculture market is poised for significant growth in the coming years, driven by converging factors including increasing demand for sustainable food and feed, advancements in cultivation technologies, and growing consumer awareness. Strategic opportunities abound for companies that can effectively leverage technological innovation, establish efficient supply chains, and cater to the evolving needs of consumers. The market is anticipated to reach $xx billion by 2033, with significant potential for expansion into new applications and markets.
Algaculture Segmentation
-
1. Application
- 1.1. undefined
-
2. Type
- 2.1. undefined
Algaculture Segmentation By Geography
- 1. undefined
- 2. undefined
- 3. undefined
- 4. undefined
- 5. undefined
Algaculture Regional Market Share
Geographic Coverage of Algaculture
Algaculture REPORT HIGHLIGHTS
| Aspects | Details |
|---|---|
| Study Period | 2020-2034 |
| Base Year | 2025 |
| Estimated Year | 2026 |
| Forecast Period | 2026-2034 |
| Historical Period | 2020-2025 |
| Growth Rate | CAGR of 8% from 2020-2034 |
| Segmentation |
|
Table of Contents
- 1. Introduction
- 1.1. Research Scope
- 1.2. Market Segmentation
- 1.3. Research Objective
- 1.4. Definitions and Assumptions
- 2. Executive Summary
- 2.1. Market Snapshot
- 3. Market Dynamics
- 3.1. Market Drivers
- 3.2. Market Restrains
- 3.3. Market Trends
- 3.4. Market Opportunities
- 4. Market Factor Analysis
- 4.1. Porters Five Forces
- 4.1.1. Bargaining Power of Suppliers
- 4.1.2. Bargaining Power of Buyers
- 4.1.3. Threat of New Entrants
- 4.1.4. Threat of Substitutes
- 4.1.5. Competitive Rivalry
- 4.2. PESTEL analysis
- 4.3. BCG Analysis
- 4.3.1. Stars (High Growth, High Market Share)
- 4.3.2. Cash Cows (Low Growth, High Market Share)
- 4.3.3. Question Mark (High Growth, Low Market Share)
- 4.3.4. Dogs (Low Growth, Low Market Share)
- 4.4. Ansoff Matrix Analysis
- 4.5. Supply Chain Analysis
- 4.6. Regulatory Landscape
- 4.7. Current Market Potential and Opportunity Assessment (TAM–SAM–SOM Framework)
- 4.8. VDR Analyst Note
- 4.1. Porters Five Forces
- 5. Market Analysis, Insights and Forecast 2021-2033
- 5.1. Market Analysis, Insights and Forecast - by Application
- 5.1.1.
- 5.2. Market Analysis, Insights and Forecast - by Type
- 5.2.1.
- 5.3. Market Analysis, Insights and Forecast - by Region
- 5.3.1.
- 5.3.2.
- 5.3.3.
- 5.3.4.
- 5.3.5.
- 5.1. Market Analysis, Insights and Forecast - by Application
- 6. Global Algaculture Analysis, Insights and Forecast, 2021-2033
- 6.1. Market Analysis, Insights and Forecast - by Application
- 6.1.1.
- 6.2. Market Analysis, Insights and Forecast - by Type
- 6.2.1.
- 6.1. Market Analysis, Insights and Forecast - by Application
- 7. undefined Algaculture Analysis, Insights and Forecast, 2021-2033
- 7.1. Market Analysis, Insights and Forecast - by Application
- 7.1.1.
- 7.2. Market Analysis, Insights and Forecast - by Type
- 7.2.1.
- 7.1. Market Analysis, Insights and Forecast - by Application
- 8. undefined Algaculture Analysis, Insights and Forecast, 2021-2033
- 8.1. Market Analysis, Insights and Forecast - by Application
- 8.1.1.
- 8.2. Market Analysis, Insights and Forecast - by Type
- 8.2.1.
- 8.1. Market Analysis, Insights and Forecast - by Application
- 9. undefined Algaculture Analysis, Insights and Forecast, 2021-2033
- 9.1. Market Analysis, Insights and Forecast - by Application
- 9.1.1.
- 9.2. Market Analysis, Insights and Forecast - by Type
- 9.2.1.
- 9.1. Market Analysis, Insights and Forecast - by Application
- 10. undefined Algaculture Analysis, Insights and Forecast, 2021-2033
- 10.1. Market Analysis, Insights and Forecast - by Application
- 10.1.1.
- 10.2. Market Analysis, Insights and Forecast - by Type
- 10.2.1.
- 10.1. Market Analysis, Insights and Forecast - by Application
- 11. undefined Algaculture Analysis, Insights and Forecast, 2021-2033
- 11.1. Market Analysis, Insights and Forecast - by Application
- 11.1.1.
- 11.2. Market Analysis, Insights and Forecast - by Type
- 11.2.1.
- 11.1. Market Analysis, Insights and Forecast - by Application
- 12. Competitive Analysis
- 12.1. Company Profiles
- 12.1.1 Weihai Shidai Marine Biotechnology
- 12.1.1.1. Company Overview
- 12.1.1.2. Products
- 12.1.1.3. Company Financials
- 12.1.1.4. SWOT Analysis
- 12.1.2 Shandong Lidao Oceanic Technology
- 12.1.2.1. Company Overview
- 12.1.2.2. Products
- 12.1.2.3. Company Financials
- 12.1.2.4. SWOT Analysis
- 12.1.3 Fujian Lianjiang Tianyuan Aquatic
- 12.1.3.1. Company Overview
- 12.1.3.2. Products
- 12.1.3.3. Company Financials
- 12.1.3.4. SWOT Analysis
- 12.1.4 Xunshan Group
- 12.1.4.1. Company Overview
- 12.1.4.2. Products
- 12.1.4.3. Company Financials
- 12.1.4.4. SWOT Analysis
- 12.1.5 Qingdao Gather Great Ocean Algae
- 12.1.5.1. Company Overview
- 12.1.5.2. Products
- 12.1.5.3. Company Financials
- 12.1.5.4. SWOT Analysis
- 12.1.6 Fujian Yiyuan Sea Food Company
- 12.1.6.1. Company Overview
- 12.1.6.2. Products
- 12.1.6.3. Company Financials
- 12.1.6.4. SWOT Analysis
- 12.1.7 Fujian Huangqiwan Sea Food Biotechnology
- 12.1.7.1. Company Overview
- 12.1.7.2. Products
- 12.1.7.3. Company Financials
- 12.1.7.4. SWOT Analysis
- 12.1.8 Rongcheng Lidao Chenfenzhuang Hongqiang Kelp Factory
- 12.1.8.1. Company Overview
- 12.1.8.2. Products
- 12.1.8.3. Company Financials
- 12.1.8.4. SWOT Analysis
- 12.1.9 Rongcheng Lidao Chenfenzhuang Weijian Kelp Factory
- 12.1.9.1. Company Overview
- 12.1.9.2. Products
- 12.1.9.3. Company Financials
- 12.1.9.4. SWOT Analysis
- 12.1.10 Rongcheng Yandunjiao Aquatic Company
- 12.1.10.1. Company Overview
- 12.1.10.2. Products
- 12.1.10.3. Company Financials
- 12.1.10.4. SWOT Analysis
- 12.1.11 Shandong Gaolv Aquatic Company
- 12.1.11.1. Company Overview
- 12.1.11.2. Products
- 12.1.11.3. Company Financials
- 12.1.11.4. SWOT Analysis
- 12.1.12 Shandong Haizhibao Technology
- 12.1.12.1. Company Overview
- 12.1.12.2. Products
- 12.1.12.3. Company Financials
- 12.1.12.4. SWOT Analysis
- 12.1.13 Matsumaeya
- 12.1.13.1. Company Overview
- 12.1.13.2. Products
- 12.1.13.3. Company Financials
- 12.1.13.4. SWOT Analysis
- 12.1.14 Shemberg
- 12.1.14.1. Company Overview
- 12.1.14.2. Products
- 12.1.14.3. Company Financials
- 12.1.14.4. SWOT Analysis
- 12.1.15 Karagen Indonesia
- 12.1.15.1. Company Overview
- 12.1.15.2. Products
- 12.1.15.3. Company Financials
- 12.1.15.4. SWOT Analysis
- 12.1.16 MCPI
- 12.1.16.1. Company Overview
- 12.1.16.2. Products
- 12.1.16.3. Company Financials
- 12.1.16.4. SWOT Analysis
- 12.1.1 Weihai Shidai Marine Biotechnology
- 12.2. Market Entropy
- 12.2.1 Company's Key Areas Served
- 12.2.2 Recent Developments
- 12.3. Company Market Share Analysis 2025
- 12.3.1 Top 5 Companies Market Share Analysis
- 12.3.2 Top 3 Companies Market Share Analysis
- 12.4. List of Potential Customers
- 13. Research Methodology
List of Figures
- Figure 1: Global Algaculture Revenue Breakdown (billion, %) by Region 2025 & 2033
- Figure 2: Global Algaculture Volume Breakdown (K, %) by Region 2025 & 2033
- Figure 3: undefined Algaculture Revenue (billion), by Application 2025 & 2033
- Figure 4: undefined Algaculture Volume (K), by Application 2025 & 2033
- Figure 5: undefined Algaculture Revenue Share (%), by Application 2025 & 2033
- Figure 6: undefined Algaculture Volume Share (%), by Application 2025 & 2033
- Figure 7: undefined Algaculture Revenue (billion), by Type 2025 & 2033
- Figure 8: undefined Algaculture Volume (K), by Type 2025 & 2033
- Figure 9: undefined Algaculture Revenue Share (%), by Type 2025 & 2033
- Figure 10: undefined Algaculture Volume Share (%), by Type 2025 & 2033
- Figure 11: undefined Algaculture Revenue (billion), by Country 2025 & 2033
- Figure 12: undefined Algaculture Volume (K), by Country 2025 & 2033
- Figure 13: undefined Algaculture Revenue Share (%), by Country 2025 & 2033
- Figure 14: undefined Algaculture Volume Share (%), by Country 2025 & 2033
- Figure 15: undefined Algaculture Revenue (billion), by Application 2025 & 2033
- Figure 16: undefined Algaculture Volume (K), by Application 2025 & 2033
- Figure 17: undefined Algaculture Revenue Share (%), by Application 2025 & 2033
- Figure 18: undefined Algaculture Volume Share (%), by Application 2025 & 2033
- Figure 19: undefined Algaculture Revenue (billion), by Type 2025 & 2033
- Figure 20: undefined Algaculture Volume (K), by Type 2025 & 2033
- Figure 21: undefined Algaculture Revenue Share (%), by Type 2025 & 2033
- Figure 22: undefined Algaculture Volume Share (%), by Type 2025 & 2033
- Figure 23: undefined Algaculture Revenue (billion), by Country 2025 & 2033
- Figure 24: undefined Algaculture Volume (K), by Country 2025 & 2033
- Figure 25: undefined Algaculture Revenue Share (%), by Country 2025 & 2033
- Figure 26: undefined Algaculture Volume Share (%), by Country 2025 & 2033
- Figure 27: undefined Algaculture Revenue (billion), by Application 2025 & 2033
- Figure 28: undefined Algaculture Volume (K), by Application 2025 & 2033
- Figure 29: undefined Algaculture Revenue Share (%), by Application 2025 & 2033
- Figure 30: undefined Algaculture Volume Share (%), by Application 2025 & 2033
- Figure 31: undefined Algaculture Revenue (billion), by Type 2025 & 2033
- Figure 32: undefined Algaculture Volume (K), by Type 2025 & 2033
- Figure 33: undefined Algaculture Revenue Share (%), by Type 2025 & 2033
- Figure 34: undefined Algaculture Volume Share (%), by Type 2025 & 2033
- Figure 35: undefined Algaculture Revenue (billion), by Country 2025 & 2033
- Figure 36: undefined Algaculture Volume (K), by Country 2025 & 2033
- Figure 37: undefined Algaculture Revenue Share (%), by Country 2025 & 2033
- Figure 38: undefined Algaculture Volume Share (%), by Country 2025 & 2033
- Figure 39: undefined Algaculture Revenue (billion), by Application 2025 & 2033
- Figure 40: undefined Algaculture Volume (K), by Application 2025 & 2033
- Figure 41: undefined Algaculture Revenue Share (%), by Application 2025 & 2033
- Figure 42: undefined Algaculture Volume Share (%), by Application 2025 & 2033
- Figure 43: undefined Algaculture Revenue (billion), by Type 2025 & 2033
- Figure 44: undefined Algaculture Volume (K), by Type 2025 & 2033
- Figure 45: undefined Algaculture Revenue Share (%), by Type 2025 & 2033
- Figure 46: undefined Algaculture Volume Share (%), by Type 2025 & 2033
- Figure 47: undefined Algaculture Revenue (billion), by Country 2025 & 2033
- Figure 48: undefined Algaculture Volume (K), by Country 2025 & 2033
- Figure 49: undefined Algaculture Revenue Share (%), by Country 2025 & 2033
- Figure 50: undefined Algaculture Volume Share (%), by Country 2025 & 2033
- Figure 51: undefined Algaculture Revenue (billion), by Application 2025 & 2033
- Figure 52: undefined Algaculture Volume (K), by Application 2025 & 2033
- Figure 53: undefined Algaculture Revenue Share (%), by Application 2025 & 2033
- Figure 54: undefined Algaculture Volume Share (%), by Application 2025 & 2033
- Figure 55: undefined Algaculture Revenue (billion), by Type 2025 & 2033
- Figure 56: undefined Algaculture Volume (K), by Type 2025 & 2033
- Figure 57: undefined Algaculture Revenue Share (%), by Type 2025 & 2033
- Figure 58: undefined Algaculture Volume Share (%), by Type 2025 & 2033
- Figure 59: undefined Algaculture Revenue (billion), by Country 2025 & 2033
- Figure 60: undefined Algaculture Volume (K), by Country 2025 & 2033
- Figure 61: undefined Algaculture Revenue Share (%), by Country 2025 & 2033
- Figure 62: undefined Algaculture Volume Share (%), by Country 2025 & 2033
List of Tables
- Table 1: Global Algaculture Revenue billion Forecast, by Application 2020 & 2033
- Table 2: Global Algaculture Volume K Forecast, by Application 2020 & 2033
- Table 3: Global Algaculture Revenue billion Forecast, by Type 2020 & 2033
- Table 4: Global Algaculture Volume K Forecast, by Type 2020 & 2033
- Table 5: Global Algaculture Revenue billion Forecast, by Region 2020 & 2033
- Table 6: Global Algaculture Volume K Forecast, by Region 2020 & 2033
- Table 7: Global Algaculture Revenue billion Forecast, by Application 2020 & 2033
- Table 8: Global Algaculture Volume K Forecast, by Application 2020 & 2033
- Table 9: Global Algaculture Revenue billion Forecast, by Type 2020 & 2033
- Table 10: Global Algaculture Volume K Forecast, by Type 2020 & 2033
- Table 11: Global Algaculture Revenue billion Forecast, by Country 2020 & 2033
- Table 12: Global Algaculture Volume K Forecast, by Country 2020 & 2033
- Table 13: Global Algaculture Revenue billion Forecast, by Application 2020 & 2033
- Table 14: Global Algaculture Volume K Forecast, by Application 2020 & 2033
- Table 15: Global Algaculture Revenue billion Forecast, by Type 2020 & 2033
- Table 16: Global Algaculture Volume K Forecast, by Type 2020 & 2033
- Table 17: Global Algaculture Revenue billion Forecast, by Country 2020 & 2033
- Table 18: Global Algaculture Volume K Forecast, by Country 2020 & 2033
- Table 19: Global Algaculture Revenue billion Forecast, by Application 2020 & 2033
- Table 20: Global Algaculture Volume K Forecast, by Application 2020 & 2033
- Table 21: Global Algaculture Revenue billion Forecast, by Type 2020 & 2033
- Table 22: Global Algaculture Volume K Forecast, by Type 2020 & 2033
- Table 23: Global Algaculture Revenue billion Forecast, by Country 2020 & 2033
- Table 24: Global Algaculture Volume K Forecast, by Country 2020 & 2033
- Table 25: Global Algaculture Revenue billion Forecast, by Application 2020 & 2033
- Table 26: Global Algaculture Volume K Forecast, by Application 2020 & 2033
- Table 27: Global Algaculture Revenue billion Forecast, by Type 2020 & 2033
- Table 28: Global Algaculture Volume K Forecast, by Type 2020 & 2033
- Table 29: Global Algaculture Revenue billion Forecast, by Country 2020 & 2033
- Table 30: Global Algaculture Volume K Forecast, by Country 2020 & 2033
- Table 31: Global Algaculture Revenue billion Forecast, by Application 2020 & 2033
- Table 32: Global Algaculture Volume K Forecast, by Application 2020 & 2033
- Table 33: Global Algaculture Revenue billion Forecast, by Type 2020 & 2033
- Table 34: Global Algaculture Volume K Forecast, by Type 2020 & 2033
- Table 35: Global Algaculture Revenue billion Forecast, by Country 2020 & 2033
- Table 36: Global Algaculture Volume K Forecast, by Country 2020 & 2033
Frequently Asked Questions
1. What is the projected Compound Annual Growth Rate (CAGR) of the Algaculture?
The projected CAGR is approximately 8%.
2. Which companies are prominent players in the Algaculture?
Key companies in the market include Weihai Shidai Marine Biotechnology, Shandong Lidao Oceanic Technology, Fujian Lianjiang Tianyuan Aquatic, Xunshan Group, Qingdao Gather Great Ocean Algae, Fujian Yiyuan Sea Food Company, Fujian Huangqiwan Sea Food Biotechnology, Rongcheng Lidao Chenfenzhuang Hongqiang Kelp Factory, Rongcheng Lidao Chenfenzhuang Weijian Kelp Factory, Rongcheng Yandunjiao Aquatic Company, Shandong Gaolv Aquatic Company, Shandong Haizhibao Technology, Matsumaeya, Shemberg, Karagen Indonesia, MCPI.
3. What are the main segments of the Algaculture?
The market segments include Application, Type.
4. Can you provide details about the market size?
The market size is estimated to be USD 39.9 billion as of 2022.
5. What are some drivers contributing to market growth?
N/A
6. What are the notable trends driving market growth?
N/A
7. Are there any restraints impacting market growth?
N/A
8. Can you provide examples of recent developments in the market?
N/A
9. What pricing options are available for accessing the report?
Pricing options include single-user, multi-user, and enterprise licenses priced at USD 3950.00, USD 5925.00, and USD 7900.00 respectively.
10. Is the market size provided in terms of value or volume?
The market size is provided in terms of value, measured in billion and volume, measured in K.
11. Are there any specific market keywords associated with the report?
Yes, the market keyword associated with the report is "Algaculture," which aids in identifying and referencing the specific market segment covered.
12. How do I determine which pricing option suits my needs best?
The pricing options vary based on user requirements and access needs. Individual users may opt for single-user licenses, while businesses requiring broader access may choose multi-user or enterprise licenses for cost-effective access to the report.
13. Are there any additional resources or data provided in the Algaculture report?
While the report offers comprehensive insights, it's advisable to review the specific contents or supplementary materials provided to ascertain if additional resources or data are available.
14. How can I stay updated on further developments or reports in the Algaculture?
To stay informed about further developments, trends, and reports in the Algaculture, consider subscribing to industry newsletters, following relevant companies and organizations, or regularly checking reputable industry news sources and publications.
Methodology
Step 1 - Identification of Relevant Samples Size from Population Database


Step 2 - Approaches for Defining Global Market Size (Value, Volume* & Price*)

Note*: In applicable scenarios
Step 3 - Data Sources
Primary Research
- Web Analytics
- Survey Reports
- Research Institute
- Latest Research Reports
- Opinion Leaders
Secondary Research
- Annual Reports
- White Paper
- Latest Press Release
- Industry Association
- Paid Database
- Investor Presentations

Step 4 - Data Triangulation
Involves using different sources of information in order to increase the validity of a study
These sources are likely to be stakeholders in a program - participants, other researchers, program staff, other community members, and so on.
Then we put all data in single framework & apply various statistical tools to find out the dynamic on the market.
During the analysis stage, feedback from the stakeholder groups would be compared to determine areas of agreement as well as areas of divergence