

Key Insights
The Global Alcohol Ethoxylates Market is poised for robust expansion, projected to reach $5.2 billion by 2025, with a compound annual growth rate (CAGR) of 4.1% from 2025 to 2033. This growth is underpinned by escalating demand for surfactants across diverse sectors, notably detergents, cleaning agents, and personal care. Rising disposable incomes in emerging economies and a growing consumer emphasis on hygiene and personal care products further stimulate market traction. Advancements in ethoxylation processes, enhancing efficiency and reducing environmental impact, also contribute positively. Key market restraints include volatile raw material prices (ethylene oxide and fatty alcohols), stringent environmental regulations on surfactant use, and the potential emergence of bio-based alternatives. The market is segmented by origin (oleochemical, petrochemical) and application (agricultural chemicals, industrial & institutional cleaning, paints & coatings, personal care, soaps & detergents, textile processing, and others). The oleochemical segment is anticipated to grow faster, driven by the demand for biodegradable and eco-friendly surfactants. Geographically, the Asia-Pacific region, led by China and India, is expected to dominate due to strong economic growth and expanding manufacturing capabilities. North America and Europe, while mature, will remain significant contributors owing to established players and high per capita consumption.
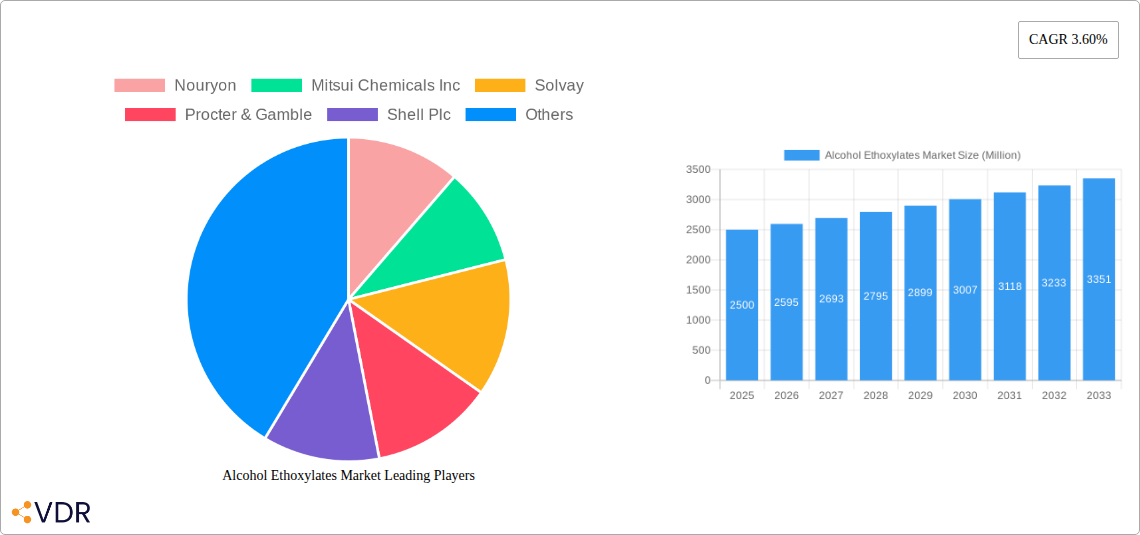
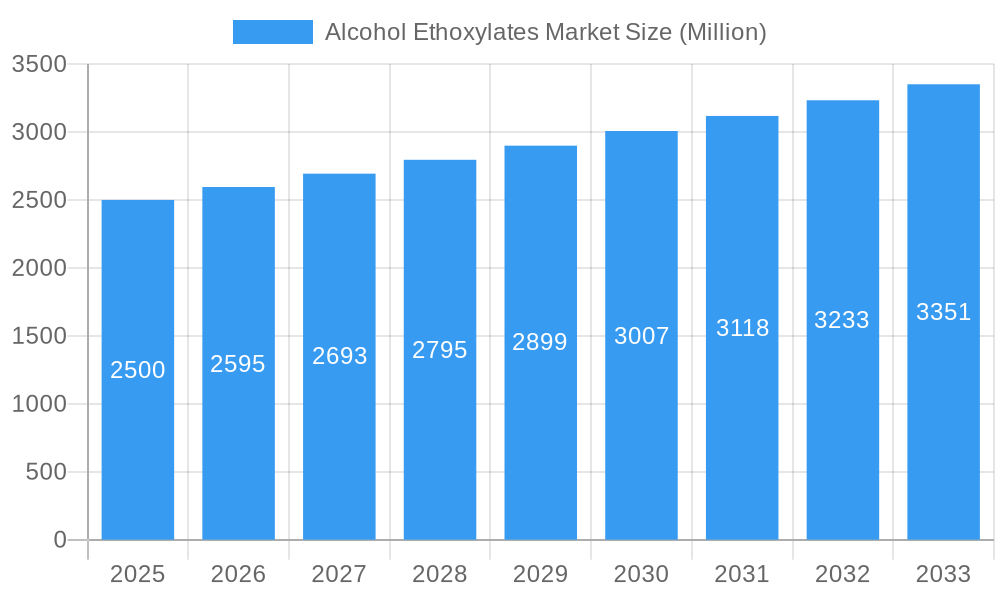
Alcohol Ethoxylates Market Market Size (In Billion)
The Alcohol Ethoxylates market is characterized by intense competition, with leading companies including Nouryon, Mitsui Chemicals Inc., Solvay, Procter & Gamble, Shell Plc, Evonik Industries AG, Stepan Company, BASF SE, and Huntsman International LLC. Strategic priorities for these players involve product innovation, capacity expansion, and mergers and acquisitions to solidify market positions. The growing focus on sustainable and eco-friendly alternatives presents both opportunities and challenges. Investment in research and development for biodegradable and bio-based alcohol ethoxylates is crucial to address evolving environmental concerns. The market's future trajectory will be shaped by end-use sector growth, raw material cost competitiveness, regulatory landscapes, and successful innovation in sustainable alternatives. The forecast period (2025-2033) offers significant potential for market expansion, presenting lucrative prospects for both established and emerging players.
Alcohol Ethoxylates Market Company Market Share
Alcohol Ethoxylates Market: A Comprehensive Market Report (2019-2033)
This comprehensive report provides an in-depth analysis of the Alcohol Ethoxylates market, encompassing market dynamics, growth trends, regional performance, product landscape, and key players. The study period covers 2019-2033, with 2025 as the base and estimated year. The report is crucial for industry professionals, investors, and strategists seeking a holistic understanding of this dynamic sector. The market is segmented by origin type (Oleochemical, Petrochemical) and application (Agricultural Chemicals, Industrial and Institutional Cleaning, Paints and Coatings, Personal Care, Soaps and Detergents, Textile Processing, Other Applications), providing a granular view of market opportunities. The total market size is expected to reach xx Million by 2033.
Alcohol Ethoxylates Market Market Dynamics & Structure
The Alcohol Ethoxylates market is characterized by a moderately concentrated landscape with several major players holding significant market share. Technological innovation, particularly in bio-based feedstocks and sustainable production methods, is a key driver. Stringent environmental regulations are shaping product development and manufacturing processes. Competitive pressures from substitute products, particularly in specific applications, are also notable. Mergers and acquisitions (M&A) activity has been moderate, primarily focused on expanding production capacity and geographical reach. The market exhibits a complex interplay of factors including:
- Market Concentration: The top 5 players account for approximately xx% of the global market share in 2025.
- Technological Innovation: Focus on bio-based alternatives and improved efficiency is driving innovation. Barriers include high R&D costs and complex regulatory approvals.
- Regulatory Framework: Stringent environmental regulations regarding emissions and waste disposal are impacting production costs and processes.
- Competitive Substitutes: Competition from other surfactants and emulsifiers varies across applications.
- End-User Demographics: Growth is driven by increasing demand from key end-use sectors, especially personal care and industrial cleaning.
- M&A Trends: A moderate number of M&A deals (xx deals in the last 5 years) have focused on expansion and diversification.
Alcohol Ethoxylates Market Growth Trends & Insights
The Alcohol Ethoxylates market experienced a CAGR of xx% during the historical period (2019-2024) and is projected to grow at a CAGR of xx% during the forecast period (2025-2033). This growth is fueled by several factors including rising demand from key application segments (Soaps and Detergents, Personal Care) and the increasing adoption of alcohol ethoxylates in various industrial applications. The market penetration rate is currently at xx% and is expected to reach xx% by 2033. Technological advancements, particularly in bio-based production methods and customized formulations for specific applications, are driving market growth. Shifting consumer preferences towards sustainable and eco-friendly products are further contributing to market expansion. The market size is estimated to be xx Million in 2025, reaching xx Million by 2033.
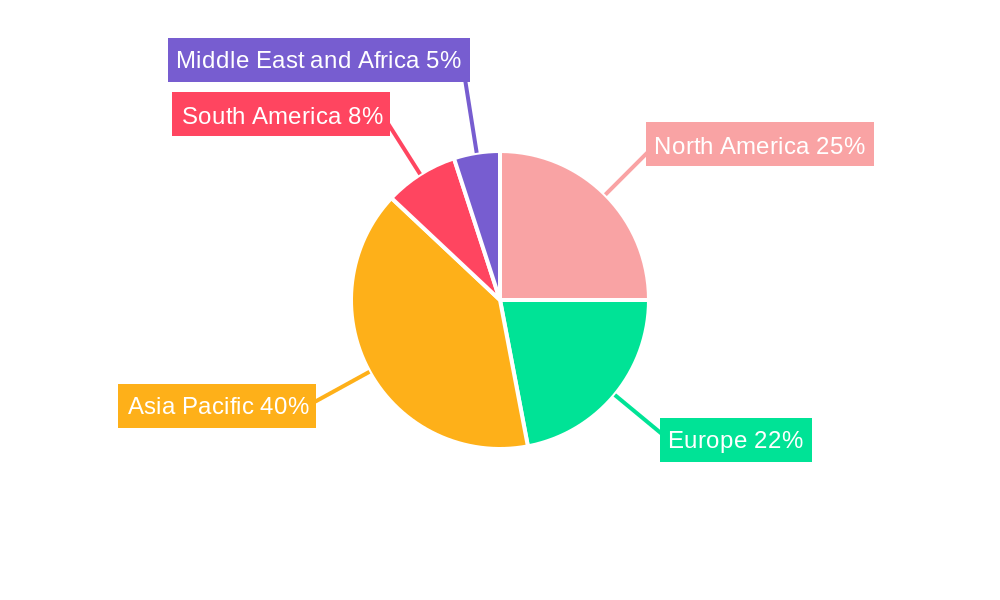
Dominant Regions, Countries, or Segments in Alcohol Ethoxylates Market
The Asia-Pacific region is projected to be the dominant market for alcohol ethoxylates during the forecast period, driven by robust economic growth, expanding industrial sectors, and increasing demand from developing economies. Within this region, China and India are key growth markets. In terms of segments, the Soaps and Detergents application segment is expected to remain the largest revenue contributor, followed by the Personal Care segment.
- Key Drivers in Asia-Pacific: Rapid industrialization, expanding consumer base, and favorable government policies supporting the chemical industry.
- Dominance Factors: High population density, strong economic growth, and increasing disposable incomes in key Asian markets.
- Growth Potential: Untapped markets in emerging economies within the Asia-Pacific region present significant growth opportunities.
- Oleochemical Segment: Growing demand for bio-based alternatives is driving the growth of this segment.
- Petrochemical Segment: Cost-effectiveness and widespread availability continue to make this segment dominant.
Alcohol Ethoxylates Market Product Landscape
Alcohol ethoxylates are available in a wide range of products with varying properties tailored to specific applications. Innovations focus on improving biodegradability, reducing toxicity, and enhancing performance characteristics like emulsification and detergency. The market offers customized formulations to meet the needs of diverse industries. Unique selling propositions often emphasize sustainability, high performance, and cost-effectiveness.
Key Drivers, Barriers & Challenges in Alcohol Ethoxylates Market
Key Drivers:
- Increasing demand from key applications like personal care and industrial cleaning.
- Growing adoption of bio-based alcohol ethoxylates.
- Favorable government policies and investments in the chemical industry in certain regions.
Key Challenges and Restraints:
- Fluctuations in raw material prices (petrochemicals and oleochemicals).
- Stringent environmental regulations impacting production costs.
- Intense competition from substitute products and alternative technologies.
- Supply chain disruptions due to geopolitical factors. This has resulted in a xx% increase in raw material costs in 2022.
Emerging Opportunities in Alcohol Ethoxylates Market
- Growing demand for sustainable and bio-based alcohol ethoxylates presents significant opportunities.
- Expansion into new applications, such as pharmaceuticals and agrochemicals, holds considerable potential.
- Customized formulations and niche product development tailored to specific needs are emerging as opportunities.
Growth Accelerators in the Alcohol Ethoxylates Market Industry
Technological advancements in bio-based feedstock utilization, coupled with strategic partnerships and acquisitions, are key growth catalysts. Market expansion into new geographical regions and untapped applications like advanced cleaning solutions will further fuel market expansion. Focus on sustainable and eco-friendly production methods is attracting new investments and shaping market dynamics.
Key Players Shaping the Alcohol Ethoxylates Market Market
- Nouryon
- Mitsui Chemicals Inc
- Solvay
- Procter & Gamble
- Shell Plc
- Evonik Industries AG
- Stepan Company
- Kemipex
- BASF SE
- India Glycols Limited
- Huntsman International LLC
- SABIC
- Sasol
- Dow
- Thai Ethoxylate Co Ltd (TEX)
- Oxiteno
- CLARIANT
Notable Milestones in Alcohol Ethoxylates Market Sector
- December 2022: Clariant announces investment in a Chinese ethoxylation plant to expand production capacity for personal and home care, and industrial applications.
- May 2022: Shell Plc plans to increase capacity for bio-based feedstocks to produce alcohol and alcohol ethoxylates at its Norco, Louisiana site.
In-Depth Alcohol Ethoxylates Market Market Outlook
The Alcohol Ethoxylates market is poised for significant growth driven by technological innovation, increasing demand from key applications, and a growing focus on sustainability. Strategic partnerships, capacity expansions, and entry into new markets will shape the competitive landscape. The market's long-term potential is promising, with opportunities for players who can adapt to evolving consumer preferences and regulatory requirements.
Alcohol Ethoxylates Market Segmentation
-
1. Origin Type
- 1.1. Oleochemical
- 1.2. Petrochemical
-
2. Application
- 2.1. Agricultural Chemicals
- 2.2. Industrial and Institutional Cleaning
- 2.3. Paints and Coatings
- 2.4. Personal Care
- 2.5. Soaps and Detergents
- 2.6. Textile Processing
- 2.7. Other Applications
Alcohol Ethoxylates Market Segmentation By Geography
-
1. Asia Pacific
- 1.1. China
- 1.2. India
- 1.3. Japan
- 1.4. South Korea
- 1.5. ASEAN Countries
- 1.6. Rest of Asia Pacific
-
2. North America
- 2.1. United States
- 2.2. Mexico
- 2.3. Canada
-
3. Europe
- 3.1. Germany
- 3.2. United Kingdom
- 3.3. Italy
- 3.4. France
- 3.5. Rest of Europe
-
4. South America
- 4.1. Brazil
- 4.2. Argentina
- 4.3. Rest of South America
-
5. Middle East and Africa
- 5.1. Saudi Arabia
- 5.2. South Africa
- 5.3. Rest of Middle East and Africa
Alcohol Ethoxylates Market Regional Market Share
Geographic Coverage of Alcohol Ethoxylates Market
Alcohol Ethoxylates Market REPORT HIGHLIGHTS
| Aspects | Details |
|---|---|
| Study Period | 2020-2034 |
| Base Year | 2025 |
| Estimated Year | 2026 |
| Forecast Period | 2026-2034 |
| Historical Period | 2020-2025 |
| Growth Rate | CAGR of 4.1% from 2020-2034 |
| Segmentation |
|
Table of Contents
- 1. Introduction
- 1.1. Research Scope
- 1.2. Market Segmentation
- 1.3. Research Objective
- 1.4. Definitions and Assumptions
- 2. Executive Summary
- 2.1. Market Snapshot
- 3. Market Dynamics
- 3.1. Market Drivers
- 3.2. Market Restrains
- 3.3. Market Trends
- 3.4. Market Opportunities
- 4. Market Factor Analysis
- 4.1. Porters Five Forces
- 4.1.1. Bargaining Power of Suppliers
- 4.1.2. Bargaining Power of Buyers
- 4.1.3. Threat of New Entrants
- 4.1.4. Threat of Substitutes
- 4.1.5. Competitive Rivalry
- 4.2. PESTEL analysis
- 4.3. BCG Analysis
- 4.3.1. Stars (High Growth, High Market Share)
- 4.3.2. Cash Cows (Low Growth, High Market Share)
- 4.3.3. Question Mark (High Growth, Low Market Share)
- 4.3.4. Dogs (Low Growth, Low Market Share)
- 4.4. Ansoff Matrix Analysis
- 4.5. Supply Chain Analysis
- 4.6. Regulatory Landscape
- 4.7. Current Market Potential and Opportunity Assessment (TAM–SAM–SOM Framework)
- 4.8. VDR Analyst Note
- 4.1. Porters Five Forces
- 5. Market Analysis, Insights and Forecast 2021-2033
- 5.1. Market Analysis, Insights and Forecast - by Origin Type
- 5.1.1. Oleochemical
- 5.1.2. Petrochemical
- 5.2. Market Analysis, Insights and Forecast - by Application
- 5.2.1. Agricultural Chemicals
- 5.2.2. Industrial and Institutional Cleaning
- 5.2.3. Paints and Coatings
- 5.2.4. Personal Care
- 5.2.5. Soaps and Detergents
- 5.2.6. Textile Processing
- 5.2.7. Other Applications
- 5.3. Market Analysis, Insights and Forecast - by Region
- 5.3.1. Asia Pacific
- 5.3.2. North America
- 5.3.3. Europe
- 5.3.4. South America
- 5.3.5. Middle East and Africa
- 5.1. Market Analysis, Insights and Forecast - by Origin Type
- 6. Global Alcohol Ethoxylates Market Analysis, Insights and Forecast, 2021-2033
- 6.1. Market Analysis, Insights and Forecast - by Origin Type
- 6.1.1. Oleochemical
- 6.1.2. Petrochemical
- 6.2. Market Analysis, Insights and Forecast - by Application
- 6.2.1. Agricultural Chemicals
- 6.2.2. Industrial and Institutional Cleaning
- 6.2.3. Paints and Coatings
- 6.2.4. Personal Care
- 6.2.5. Soaps and Detergents
- 6.2.6. Textile Processing
- 6.2.7. Other Applications
- 6.1. Market Analysis, Insights and Forecast - by Origin Type
- 7. Asia Pacific Alcohol Ethoxylates Market Analysis, Insights and Forecast, 2021-2033
- 7.1. Market Analysis, Insights and Forecast - by Origin Type
- 7.1.1. Oleochemical
- 7.1.2. Petrochemical
- 7.2. Market Analysis, Insights and Forecast - by Application
- 7.2.1. Agricultural Chemicals
- 7.2.2. Industrial and Institutional Cleaning
- 7.2.3. Paints and Coatings
- 7.2.4. Personal Care
- 7.2.5. Soaps and Detergents
- 7.2.6. Textile Processing
- 7.2.7. Other Applications
- 7.1. Market Analysis, Insights and Forecast - by Origin Type
- 8. North America Alcohol Ethoxylates Market Analysis, Insights and Forecast, 2021-2033
- 8.1. Market Analysis, Insights and Forecast - by Origin Type
- 8.1.1. Oleochemical
- 8.1.2. Petrochemical
- 8.2. Market Analysis, Insights and Forecast - by Application
- 8.2.1. Agricultural Chemicals
- 8.2.2. Industrial and Institutional Cleaning
- 8.2.3. Paints and Coatings
- 8.2.4. Personal Care
- 8.2.5. Soaps and Detergents
- 8.2.6. Textile Processing
- 8.2.7. Other Applications
- 8.1. Market Analysis, Insights and Forecast - by Origin Type
- 9. Europe Alcohol Ethoxylates Market Analysis, Insights and Forecast, 2021-2033
- 9.1. Market Analysis, Insights and Forecast - by Origin Type
- 9.1.1. Oleochemical
- 9.1.2. Petrochemical
- 9.2. Market Analysis, Insights and Forecast - by Application
- 9.2.1. Agricultural Chemicals
- 9.2.2. Industrial and Institutional Cleaning
- 9.2.3. Paints and Coatings
- 9.2.4. Personal Care
- 9.2.5. Soaps and Detergents
- 9.2.6. Textile Processing
- 9.2.7. Other Applications
- 9.1. Market Analysis, Insights and Forecast - by Origin Type
- 10. South America Alcohol Ethoxylates Market Analysis, Insights and Forecast, 2021-2033
- 10.1. Market Analysis, Insights and Forecast - by Origin Type
- 10.1.1. Oleochemical
- 10.1.2. Petrochemical
- 10.2. Market Analysis, Insights and Forecast - by Application
- 10.2.1. Agricultural Chemicals
- 10.2.2. Industrial and Institutional Cleaning
- 10.2.3. Paints and Coatings
- 10.2.4. Personal Care
- 10.2.5. Soaps and Detergents
- 10.2.6. Textile Processing
- 10.2.7. Other Applications
- 10.1. Market Analysis, Insights and Forecast - by Origin Type
- 11. Middle East and Africa Alcohol Ethoxylates Market Analysis, Insights and Forecast, 2021-2033
- 11.1. Market Analysis, Insights and Forecast - by Origin Type
- 11.1.1. Oleochemical
- 11.1.2. Petrochemical
- 11.2. Market Analysis, Insights and Forecast - by Application
- 11.2.1. Agricultural Chemicals
- 11.2.2. Industrial and Institutional Cleaning
- 11.2.3. Paints and Coatings
- 11.2.4. Personal Care
- 11.2.5. Soaps and Detergents
- 11.2.6. Textile Processing
- 11.2.7. Other Applications
- 11.1. Market Analysis, Insights and Forecast - by Origin Type
- 12. Competitive Analysis
- 12.1. Company Profiles
- 12.1.1 Nouryon
- 12.1.1.1. Company Overview
- 12.1.1.2. Products
- 12.1.1.3. Company Financials
- 12.1.1.4. SWOT Analysis
- 12.1.2 Mitsui Chemicals Inc
- 12.1.2.1. Company Overview
- 12.1.2.2. Products
- 12.1.2.3. Company Financials
- 12.1.2.4. SWOT Analysis
- 12.1.3 Solvay
- 12.1.3.1. Company Overview
- 12.1.3.2. Products
- 12.1.3.3. Company Financials
- 12.1.3.4. SWOT Analysis
- 12.1.4 Procter & Gamble
- 12.1.4.1. Company Overview
- 12.1.4.2. Products
- 12.1.4.3. Company Financials
- 12.1.4.4. SWOT Analysis
- 12.1.5 Shell Plc
- 12.1.5.1. Company Overview
- 12.1.5.2. Products
- 12.1.5.3. Company Financials
- 12.1.5.4. SWOT Analysis
- 12.1.6 Evonik Industries AG
- 12.1.6.1. Company Overview
- 12.1.6.2. Products
- 12.1.6.3. Company Financials
- 12.1.6.4. SWOT Analysis
- 12.1.7 Stepan Company
- 12.1.7.1. Company Overview
- 12.1.7.2. Products
- 12.1.7.3. Company Financials
- 12.1.7.4. SWOT Analysis
- 12.1.8 Kemipex
- 12.1.8.1. Company Overview
- 12.1.8.2. Products
- 12.1.8.3. Company Financials
- 12.1.8.4. SWOT Analysis
- 12.1.9 BASF SE
- 12.1.9.1. Company Overview
- 12.1.9.2. Products
- 12.1.9.3. Company Financials
- 12.1.9.4. SWOT Analysis
- 12.1.10 India Glycols Limited
- 12.1.10.1. Company Overview
- 12.1.10.2. Products
- 12.1.10.3. Company Financials
- 12.1.10.4. SWOT Analysis
- 12.1.11 Huntsman International LLC
- 12.1.11.1. Company Overview
- 12.1.11.2. Products
- 12.1.11.3. Company Financials
- 12.1.11.4. SWOT Analysis
- 12.1.12 SABIC
- 12.1.12.1. Company Overview
- 12.1.12.2. Products
- 12.1.12.3. Company Financials
- 12.1.12.4. SWOT Analysis
- 12.1.13 Sasol
- 12.1.13.1. Company Overview
- 12.1.13.2. Products
- 12.1.13.3. Company Financials
- 12.1.13.4. SWOT Analysis
- 12.1.14 Dow
- 12.1.14.1. Company Overview
- 12.1.14.2. Products
- 12.1.14.3. Company Financials
- 12.1.14.4. SWOT Analysis
- 12.1.15 Thai Ethoxylate Co Ltd ( TEX )*List Not Exhaustive
- 12.1.15.1. Company Overview
- 12.1.15.2. Products
- 12.1.15.3. Company Financials
- 12.1.15.4. SWOT Analysis
- 12.1.16 Oxiteno
- 12.1.16.1. Company Overview
- 12.1.16.2. Products
- 12.1.16.3. Company Financials
- 12.1.16.4. SWOT Analysis
- 12.1.17 CLARIANT
- 12.1.17.1. Company Overview
- 12.1.17.2. Products
- 12.1.17.3. Company Financials
- 12.1.17.4. SWOT Analysis
- 12.1.1 Nouryon
- 12.2. Market Entropy
- 12.2.1 Company's Key Areas Served
- 12.2.2 Recent Developments
- 12.3. Company Market Share Analysis 2025
- 12.3.1 Top 5 Companies Market Share Analysis
- 12.3.2 Top 3 Companies Market Share Analysis
- 12.4. List of Potential Customers
- 13. Research Methodology
List of Figures
- Figure 1: Global Alcohol Ethoxylates Market Revenue Breakdown (billion, %) by Region 2025 & 2033
- Figure 2: Global Alcohol Ethoxylates Market Volume Breakdown (Million, %) by Region 2025 & 2033
- Figure 3: Asia Pacific Alcohol Ethoxylates Market Revenue (billion), by Origin Type 2025 & 2033
- Figure 4: Asia Pacific Alcohol Ethoxylates Market Volume (Million), by Origin Type 2025 & 2033
- Figure 5: Asia Pacific Alcohol Ethoxylates Market Revenue Share (%), by Origin Type 2025 & 2033
- Figure 6: Asia Pacific Alcohol Ethoxylates Market Volume Share (%), by Origin Type 2025 & 2033
- Figure 7: Asia Pacific Alcohol Ethoxylates Market Revenue (billion), by Application 2025 & 2033
- Figure 8: Asia Pacific Alcohol Ethoxylates Market Volume (Million), by Application 2025 & 2033
- Figure 9: Asia Pacific Alcohol Ethoxylates Market Revenue Share (%), by Application 2025 & 2033
- Figure 10: Asia Pacific Alcohol Ethoxylates Market Volume Share (%), by Application 2025 & 2033
- Figure 11: Asia Pacific Alcohol Ethoxylates Market Revenue (billion), by Country 2025 & 2033
- Figure 12: Asia Pacific Alcohol Ethoxylates Market Volume (Million), by Country 2025 & 2033
- Figure 13: Asia Pacific Alcohol Ethoxylates Market Revenue Share (%), by Country 2025 & 2033
- Figure 14: Asia Pacific Alcohol Ethoxylates Market Volume Share (%), by Country 2025 & 2033
- Figure 15: North America Alcohol Ethoxylates Market Revenue (billion), by Origin Type 2025 & 2033
- Figure 16: North America Alcohol Ethoxylates Market Volume (Million), by Origin Type 2025 & 2033
- Figure 17: North America Alcohol Ethoxylates Market Revenue Share (%), by Origin Type 2025 & 2033
- Figure 18: North America Alcohol Ethoxylates Market Volume Share (%), by Origin Type 2025 & 2033
- Figure 19: North America Alcohol Ethoxylates Market Revenue (billion), by Application 2025 & 2033
- Figure 20: North America Alcohol Ethoxylates Market Volume (Million), by Application 2025 & 2033
- Figure 21: North America Alcohol Ethoxylates Market Revenue Share (%), by Application 2025 & 2033
- Figure 22: North America Alcohol Ethoxylates Market Volume Share (%), by Application 2025 & 2033
- Figure 23: North America Alcohol Ethoxylates Market Revenue (billion), by Country 2025 & 2033
- Figure 24: North America Alcohol Ethoxylates Market Volume (Million), by Country 2025 & 2033
- Figure 25: North America Alcohol Ethoxylates Market Revenue Share (%), by Country 2025 & 2033
- Figure 26: North America Alcohol Ethoxylates Market Volume Share (%), by Country 2025 & 2033
- Figure 27: Europe Alcohol Ethoxylates Market Revenue (billion), by Origin Type 2025 & 2033
- Figure 28: Europe Alcohol Ethoxylates Market Volume (Million), by Origin Type 2025 & 2033
- Figure 29: Europe Alcohol Ethoxylates Market Revenue Share (%), by Origin Type 2025 & 2033
- Figure 30: Europe Alcohol Ethoxylates Market Volume Share (%), by Origin Type 2025 & 2033
- Figure 31: Europe Alcohol Ethoxylates Market Revenue (billion), by Application 2025 & 2033
- Figure 32: Europe Alcohol Ethoxylates Market Volume (Million), by Application 2025 & 2033
- Figure 33: Europe Alcohol Ethoxylates Market Revenue Share (%), by Application 2025 & 2033
- Figure 34: Europe Alcohol Ethoxylates Market Volume Share (%), by Application 2025 & 2033
- Figure 35: Europe Alcohol Ethoxylates Market Revenue (billion), by Country 2025 & 2033
- Figure 36: Europe Alcohol Ethoxylates Market Volume (Million), by Country 2025 & 2033
- Figure 37: Europe Alcohol Ethoxylates Market Revenue Share (%), by Country 2025 & 2033
- Figure 38: Europe Alcohol Ethoxylates Market Volume Share (%), by Country 2025 & 2033
- Figure 39: South America Alcohol Ethoxylates Market Revenue (billion), by Origin Type 2025 & 2033
- Figure 40: South America Alcohol Ethoxylates Market Volume (Million), by Origin Type 2025 & 2033
- Figure 41: South America Alcohol Ethoxylates Market Revenue Share (%), by Origin Type 2025 & 2033
- Figure 42: South America Alcohol Ethoxylates Market Volume Share (%), by Origin Type 2025 & 2033
- Figure 43: South America Alcohol Ethoxylates Market Revenue (billion), by Application 2025 & 2033
- Figure 44: South America Alcohol Ethoxylates Market Volume (Million), by Application 2025 & 2033
- Figure 45: South America Alcohol Ethoxylates Market Revenue Share (%), by Application 2025 & 2033
- Figure 46: South America Alcohol Ethoxylates Market Volume Share (%), by Application 2025 & 2033
- Figure 47: South America Alcohol Ethoxylates Market Revenue (billion), by Country 2025 & 2033
- Figure 48: South America Alcohol Ethoxylates Market Volume (Million), by Country 2025 & 2033
- Figure 49: South America Alcohol Ethoxylates Market Revenue Share (%), by Country 2025 & 2033
- Figure 50: South America Alcohol Ethoxylates Market Volume Share (%), by Country 2025 & 2033
- Figure 51: Middle East and Africa Alcohol Ethoxylates Market Revenue (billion), by Origin Type 2025 & 2033
- Figure 52: Middle East and Africa Alcohol Ethoxylates Market Volume (Million), by Origin Type 2025 & 2033
- Figure 53: Middle East and Africa Alcohol Ethoxylates Market Revenue Share (%), by Origin Type 2025 & 2033
- Figure 54: Middle East and Africa Alcohol Ethoxylates Market Volume Share (%), by Origin Type 2025 & 2033
- Figure 55: Middle East and Africa Alcohol Ethoxylates Market Revenue (billion), by Application 2025 & 2033
- Figure 56: Middle East and Africa Alcohol Ethoxylates Market Volume (Million), by Application 2025 & 2033
- Figure 57: Middle East and Africa Alcohol Ethoxylates Market Revenue Share (%), by Application 2025 & 2033
- Figure 58: Middle East and Africa Alcohol Ethoxylates Market Volume Share (%), by Application 2025 & 2033
- Figure 59: Middle East and Africa Alcohol Ethoxylates Market Revenue (billion), by Country 2025 & 2033
- Figure 60: Middle East and Africa Alcohol Ethoxylates Market Volume (Million), by Country 2025 & 2033
- Figure 61: Middle East and Africa Alcohol Ethoxylates Market Revenue Share (%), by Country 2025 & 2033
- Figure 62: Middle East and Africa Alcohol Ethoxylates Market Volume Share (%), by Country 2025 & 2033
List of Tables
- Table 1: Global Alcohol Ethoxylates Market Revenue billion Forecast, by Origin Type 2020 & 2033
- Table 2: Global Alcohol Ethoxylates Market Volume Million Forecast, by Origin Type 2020 & 2033
- Table 3: Global Alcohol Ethoxylates Market Revenue billion Forecast, by Application 2020 & 2033
- Table 4: Global Alcohol Ethoxylates Market Volume Million Forecast, by Application 2020 & 2033
- Table 5: Global Alcohol Ethoxylates Market Revenue billion Forecast, by Region 2020 & 2033
- Table 6: Global Alcohol Ethoxylates Market Volume Million Forecast, by Region 2020 & 2033
- Table 7: Global Alcohol Ethoxylates Market Revenue billion Forecast, by Origin Type 2020 & 2033
- Table 8: Global Alcohol Ethoxylates Market Volume Million Forecast, by Origin Type 2020 & 2033
- Table 9: Global Alcohol Ethoxylates Market Revenue billion Forecast, by Application 2020 & 2033
- Table 10: Global Alcohol Ethoxylates Market Volume Million Forecast, by Application 2020 & 2033
- Table 11: Global Alcohol Ethoxylates Market Revenue billion Forecast, by Country 2020 & 2033
- Table 12: Global Alcohol Ethoxylates Market Volume Million Forecast, by Country 2020 & 2033
- Table 13: China Alcohol Ethoxylates Market Revenue (billion) Forecast, by Application 2020 & 2033
- Table 14: China Alcohol Ethoxylates Market Volume (Million) Forecast, by Application 2020 & 2033
- Table 15: India Alcohol Ethoxylates Market Revenue (billion) Forecast, by Application 2020 & 2033
- Table 16: India Alcohol Ethoxylates Market Volume (Million) Forecast, by Application 2020 & 2033
- Table 17: Japan Alcohol Ethoxylates Market Revenue (billion) Forecast, by Application 2020 & 2033
- Table 18: Japan Alcohol Ethoxylates Market Volume (Million) Forecast, by Application 2020 & 2033
- Table 19: South Korea Alcohol Ethoxylates Market Revenue (billion) Forecast, by Application 2020 & 2033
- Table 20: South Korea Alcohol Ethoxylates Market Volume (Million) Forecast, by Application 2020 & 2033
- Table 21: ASEAN Countries Alcohol Ethoxylates Market Revenue (billion) Forecast, by Application 2020 & 2033
- Table 22: ASEAN Countries Alcohol Ethoxylates Market Volume (Million) Forecast, by Application 2020 & 2033
- Table 23: Rest of Asia Pacific Alcohol Ethoxylates Market Revenue (billion) Forecast, by Application 2020 & 2033
- Table 24: Rest of Asia Pacific Alcohol Ethoxylates Market Volume (Million) Forecast, by Application 2020 & 2033
- Table 25: Global Alcohol Ethoxylates Market Revenue billion Forecast, by Origin Type 2020 & 2033
- Table 26: Global Alcohol Ethoxylates Market Volume Million Forecast, by Origin Type 2020 & 2033
- Table 27: Global Alcohol Ethoxylates Market Revenue billion Forecast, by Application 2020 & 2033
- Table 28: Global Alcohol Ethoxylates Market Volume Million Forecast, by Application 2020 & 2033
- Table 29: Global Alcohol Ethoxylates Market Revenue billion Forecast, by Country 2020 & 2033
- Table 30: Global Alcohol Ethoxylates Market Volume Million Forecast, by Country 2020 & 2033
- Table 31: United States Alcohol Ethoxylates Market Revenue (billion) Forecast, by Application 2020 & 2033
- Table 32: United States Alcohol Ethoxylates Market Volume (Million) Forecast, by Application 2020 & 2033
- Table 33: Mexico Alcohol Ethoxylates Market Revenue (billion) Forecast, by Application 2020 & 2033
- Table 34: Mexico Alcohol Ethoxylates Market Volume (Million) Forecast, by Application 2020 & 2033
- Table 35: Canada Alcohol Ethoxylates Market Revenue (billion) Forecast, by Application 2020 & 2033
- Table 36: Canada Alcohol Ethoxylates Market Volume (Million) Forecast, by Application 2020 & 2033
- Table 37: Global Alcohol Ethoxylates Market Revenue billion Forecast, by Origin Type 2020 & 2033
- Table 38: Global Alcohol Ethoxylates Market Volume Million Forecast, by Origin Type 2020 & 2033
- Table 39: Global Alcohol Ethoxylates Market Revenue billion Forecast, by Application 2020 & 2033
- Table 40: Global Alcohol Ethoxylates Market Volume Million Forecast, by Application 2020 & 2033
- Table 41: Global Alcohol Ethoxylates Market Revenue billion Forecast, by Country 2020 & 2033
- Table 42: Global Alcohol Ethoxylates Market Volume Million Forecast, by Country 2020 & 2033
- Table 43: Germany Alcohol Ethoxylates Market Revenue (billion) Forecast, by Application 2020 & 2033
- Table 44: Germany Alcohol Ethoxylates Market Volume (Million) Forecast, by Application 2020 & 2033
- Table 45: United Kingdom Alcohol Ethoxylates Market Revenue (billion) Forecast, by Application 2020 & 2033
- Table 46: United Kingdom Alcohol Ethoxylates Market Volume (Million) Forecast, by Application 2020 & 2033
- Table 47: Italy Alcohol Ethoxylates Market Revenue (billion) Forecast, by Application 2020 & 2033
- Table 48: Italy Alcohol Ethoxylates Market Volume (Million) Forecast, by Application 2020 & 2033
- Table 49: France Alcohol Ethoxylates Market Revenue (billion) Forecast, by Application 2020 & 2033
- Table 50: France Alcohol Ethoxylates Market Volume (Million) Forecast, by Application 2020 & 2033
- Table 51: Rest of Europe Alcohol Ethoxylates Market Revenue (billion) Forecast, by Application 2020 & 2033
- Table 52: Rest of Europe Alcohol Ethoxylates Market Volume (Million) Forecast, by Application 2020 & 2033
- Table 53: Global Alcohol Ethoxylates Market Revenue billion Forecast, by Origin Type 2020 & 2033
- Table 54: Global Alcohol Ethoxylates Market Volume Million Forecast, by Origin Type 2020 & 2033
- Table 55: Global Alcohol Ethoxylates Market Revenue billion Forecast, by Application 2020 & 2033
- Table 56: Global Alcohol Ethoxylates Market Volume Million Forecast, by Application 2020 & 2033
- Table 57: Global Alcohol Ethoxylates Market Revenue billion Forecast, by Country 2020 & 2033
- Table 58: Global Alcohol Ethoxylates Market Volume Million Forecast, by Country 2020 & 2033
- Table 59: Brazil Alcohol Ethoxylates Market Revenue (billion) Forecast, by Application 2020 & 2033
- Table 60: Brazil Alcohol Ethoxylates Market Volume (Million) Forecast, by Application 2020 & 2033
- Table 61: Argentina Alcohol Ethoxylates Market Revenue (billion) Forecast, by Application 2020 & 2033
- Table 62: Argentina Alcohol Ethoxylates Market Volume (Million) Forecast, by Application 2020 & 2033
- Table 63: Rest of South America Alcohol Ethoxylates Market Revenue (billion) Forecast, by Application 2020 & 2033
- Table 64: Rest of South America Alcohol Ethoxylates Market Volume (Million) Forecast, by Application 2020 & 2033
- Table 65: Global Alcohol Ethoxylates Market Revenue billion Forecast, by Origin Type 2020 & 2033
- Table 66: Global Alcohol Ethoxylates Market Volume Million Forecast, by Origin Type 2020 & 2033
- Table 67: Global Alcohol Ethoxylates Market Revenue billion Forecast, by Application 2020 & 2033
- Table 68: Global Alcohol Ethoxylates Market Volume Million Forecast, by Application 2020 & 2033
- Table 69: Global Alcohol Ethoxylates Market Revenue billion Forecast, by Country 2020 & 2033
- Table 70: Global Alcohol Ethoxylates Market Volume Million Forecast, by Country 2020 & 2033
- Table 71: Saudi Arabia Alcohol Ethoxylates Market Revenue (billion) Forecast, by Application 2020 & 2033
- Table 72: Saudi Arabia Alcohol Ethoxylates Market Volume (Million) Forecast, by Application 2020 & 2033
- Table 73: South Africa Alcohol Ethoxylates Market Revenue (billion) Forecast, by Application 2020 & 2033
- Table 74: South Africa Alcohol Ethoxylates Market Volume (Million) Forecast, by Application 2020 & 2033
- Table 75: Rest of Middle East and Africa Alcohol Ethoxylates Market Revenue (billion) Forecast, by Application 2020 & 2033
- Table 76: Rest of Middle East and Africa Alcohol Ethoxylates Market Volume (Million) Forecast, by Application 2020 & 2033
Frequently Asked Questions
1. What is the projected Compound Annual Growth Rate (CAGR) of the Alcohol Ethoxylates Market?
The projected CAGR is approximately 4.1%.
2. Which companies are prominent players in the Alcohol Ethoxylates Market?
Key companies in the market include Nouryon, Mitsui Chemicals Inc, Solvay, Procter & Gamble, Shell Plc, Evonik Industries AG, Stepan Company, Kemipex, BASF SE, India Glycols Limited, Huntsman International LLC, SABIC, Sasol, Dow, Thai Ethoxylate Co Ltd ( TEX )*List Not Exhaustive, Oxiteno, CLARIANT.
3. What are the main segments of the Alcohol Ethoxylates Market?
The market segments include Origin Type, Application.
4. Can you provide details about the market size?
The market size is estimated to be USD 5.2 billion as of 2022.
5. What are some drivers contributing to market growth?
Growing Personal Care Industry in Asia-Pacific; Increasing Demand for Industrial Cleaners; Other Drivers.
6. What are the notable trends driving market growth?
Increasing Demand from Personal Care Industry.
7. Are there any restraints impacting market growth?
Increasing Environmental Concerns; Volatility in Raw Materials Costs.
8. Can you provide examples of recent developments in the market?
In December 2022, Clariant announced to invest in the Chinese ethoxylation plant to expand the existing production capacity for personal and home care, as well as industrial applications.
9. What pricing options are available for accessing the report?
Pricing options include single-user, multi-user, and enterprise licenses priced at USD 4750, USD 5250, and USD 8750 respectively.
10. Is the market size provided in terms of value or volume?
The market size is provided in terms of value, measured in billion and volume, measured in Million.
11. Are there any specific market keywords associated with the report?
Yes, the market keyword associated with the report is "Alcohol Ethoxylates Market," which aids in identifying and referencing the specific market segment covered.
12. How do I determine which pricing option suits my needs best?
The pricing options vary based on user requirements and access needs. Individual users may opt for single-user licenses, while businesses requiring broader access may choose multi-user or enterprise licenses for cost-effective access to the report.
13. Are there any additional resources or data provided in the Alcohol Ethoxylates Market report?
While the report offers comprehensive insights, it's advisable to review the specific contents or supplementary materials provided to ascertain if additional resources or data are available.
14. How can I stay updated on further developments or reports in the Alcohol Ethoxylates Market?
To stay informed about further developments, trends, and reports in the Alcohol Ethoxylates Market, consider subscribing to industry newsletters, following relevant companies and organizations, or regularly checking reputable industry news sources and publications.
Methodology
Step 1 - Identification of Relevant Samples Size from Population Database


Step 2 - Approaches for Defining Global Market Size (Value, Volume* & Price*)

Note*: In applicable scenarios
Step 3 - Data Sources
Primary Research
- Web Analytics
- Survey Reports
- Research Institute
- Latest Research Reports
- Opinion Leaders
Secondary Research
- Annual Reports
- White Paper
- Latest Press Release
- Industry Association
- Paid Database
- Investor Presentations

Step 4 - Data Triangulation
Involves using different sources of information in order to increase the validity of a study
These sources are likely to be stakeholders in a program - participants, other researchers, program staff, other community members, and so on.
Then we put all data in single framework & apply various statistical tools to find out the dynamic on the market.
During the analysis stage, feedback from the stakeholder groups would be compared to determine areas of agreement as well as areas of divergence