Agrochemicals Market 2025-2033 Trends: Unveiling Growth Opportunities and Competitor Dynamics

Agrochemicals Market by Production Analysis, by Consumption Analysis, by Import Market Analysis (Value & Volume), by Export Market Analysis (Value & Volume), by Price Trend Analysis, by North America (United States, Canada, Mexico), by South America (Brazil, Argentina, Rest of South America), by Europe (United Kingdom, Germany, France, Italy, Spain, Russia, Benelux, Nordics, Rest of Europe), by Middle East & Africa (Turkey, Israel, GCC, North Africa, South Africa, Rest of Middle East & Africa), by Asia Pacific (China, India, Japan, South Korea, ASEAN, Oceania, Rest of Asia Pacific) Forecast 2025-2033

Jun 24 2025
Base Year: 2024

150 Pages
Main Logo

Agrochemicals Market 2025-2033 Trends: Unveiling Growth Opportunities and Competitor Dynamics


Home
Industries
Agriculture
sponsor image

Tailored for you

  • In-depth Analysis Tailored to Specified Regions or Segments
  • Company Profiles Customized to User Preferences
  • Comprehensive Insights Focused on Specific Segments or Regions
  • Customized Evaluation of Competitive Landscape to Meet Your Needs
  • Tailored Customization to Address Other Specific Requirements
Ask for customization


Key Insights

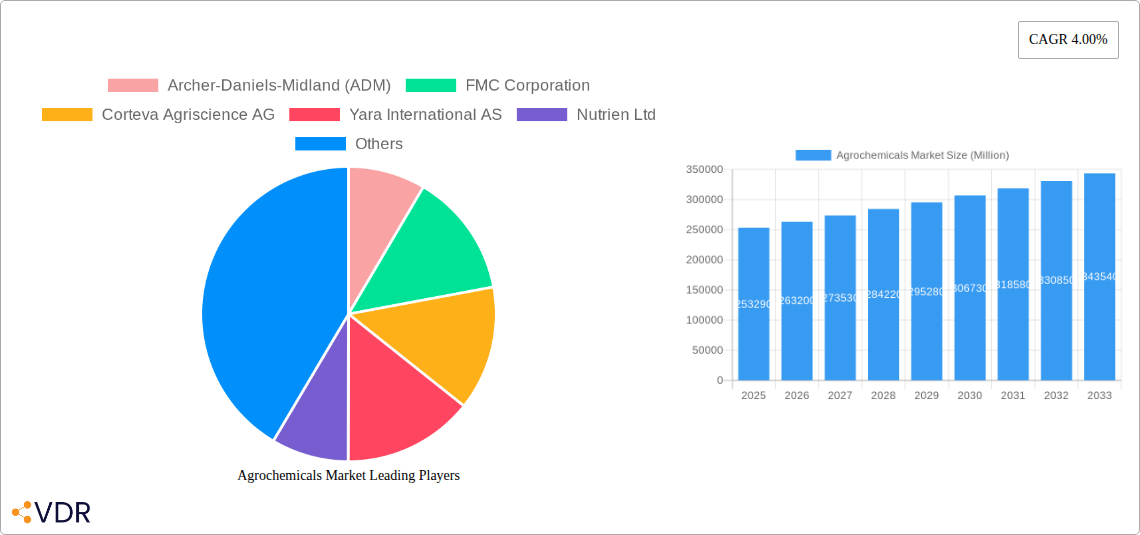
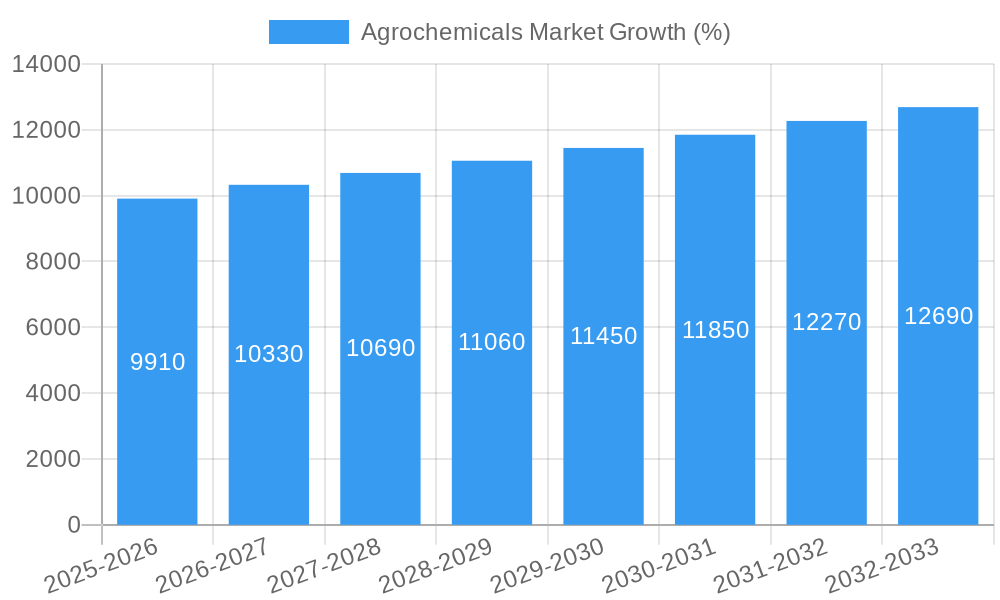
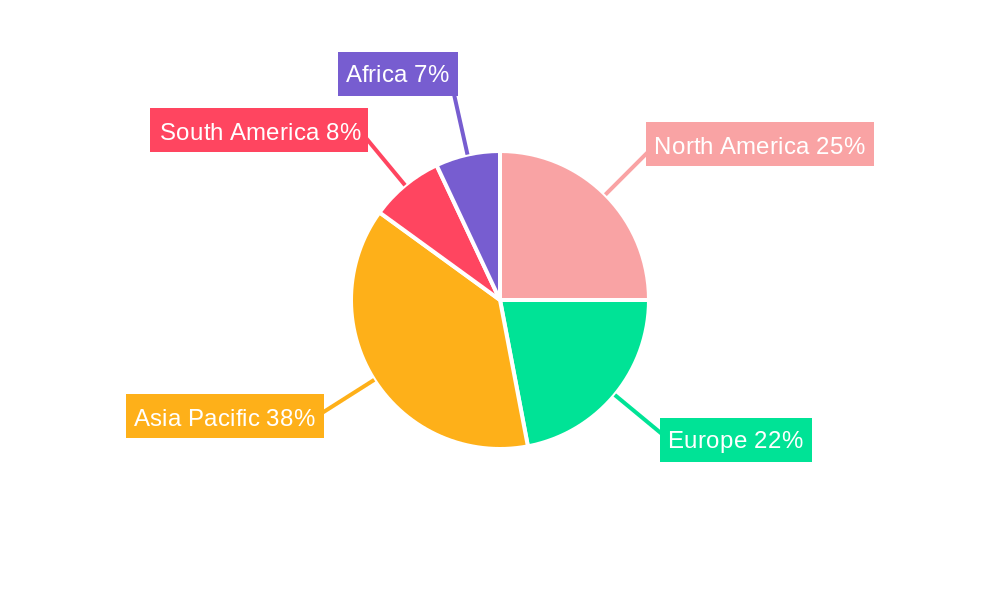
The global agrochemicals market, valued at $253.29 billion in 2025, is projected to experience robust growth, driven by a compound annual growth rate (CAGR) of 4.00% from 2025 to 2033. This expansion is fueled by several key factors. Increasing global population necessitates higher agricultural yields to meet food demands, leading to increased reliance on agrochemicals for crop protection and enhancement. Furthermore, the growing adoption of advanced farming techniques, including precision agriculture and sustainable farming practices, is boosting the demand for specialized agrochemicals. Climate change, with its unpredictable weather patterns and increasing pest infestations, is another significant driver, necessitating the use of effective and efficient agrochemicals to mitigate crop losses. The market is segmented by product type (fertilizers, pesticides, adjuvants, plant growth regulators) and application (crop-based, fruits and vegetables, non-crop-based), with crop-based applications currently dominating market share. Major players like Archer-Daniels-Midland (ADM), FMC Corporation, and Corteva Agriscience are actively engaged in research and development to introduce innovative and sustainable agrochemical solutions, further driving market growth. However, stringent government regulations concerning the environmental impact of agrochemicals and growing consumer awareness of potential health risks pose significant challenges to market expansion. Regional variations in market growth are expected, with developing economies in Asia-Pacific and South America exhibiting faster growth rates compared to mature markets in North America and Europe, owing to increasing agricultural activities and rising disposable incomes.

The forecast period of 2025-2033 will witness significant shifts within the agrochemical market. Innovation in biopesticides and biofertilizers will become increasingly crucial, driven by the rising demand for environmentally friendly and sustainable solutions. Furthermore, digital technologies will play a pivotal role in precision agriculture, optimizing agrochemical application and minimizing environmental impact. The market will also experience consolidation, with mergers and acquisitions among key players likely to shape the competitive landscape. Companies will focus on developing value-added services and integrated solutions to enhance their offerings and cater to the evolving needs of farmers. Addressing the challenges of regulatory compliance and sustainable practices will be critical for long-term success in this dynamic market. The anticipated growth trajectory indicates a promising future for the agrochemical industry, though strategic adaptations are necessary to navigate the complexities of environmental concerns and technological advancements.

Agrochemicals Market Research Report - Market Size, Growth & Forecast

Agrochemicals Market: A Comprehensive Report (2019-2033)

This in-depth report provides a comprehensive analysis of the global Agrochemicals market, encompassing market dynamics, growth trends, regional dominance, product landscapes, key players, and future outlook. The study period spans from 2019 to 2033, with 2025 serving as the base and estimated year. The report segments the market by product type (Fertilizers, Pesticides, Adjuvants, Plant Growth Regulators) and application (Crop-based, Fruits and Vegetables, Non-crop-based), offering granular insights into each segment's performance. The market size is valued in Million units.

Agrochemicals Market Dynamics & Structure

The global agrochemicals market is characterized by moderate concentration, with a few major players holding significant market share. Technological innovation, driven by the need for higher yields and sustainable agricultural practices, is a primary growth driver. Stringent regulatory frameworks, varying across regions, significantly impact market access and product development. The presence of competitive product substitutes, particularly biopesticides and organic farming methods, poses challenges to traditional agrochemical players. End-user demographics, including the increasing number of smallholder farmers in developing economies, influence market demand. Mergers and acquisitions (M&A) activity has been substantial in recent years, with xx major deals completed between 2019 and 2024, representing a xx% increase compared to the previous period.

  • Market Concentration: Moderately concentrated, with top 10 players holding xx% market share in 2024.
  • Technological Innovation: Focus on precision agriculture, biopesticides, and targeted delivery systems.
  • Regulatory Frameworks: Vary significantly across regions, impacting product registration and market access.
  • Competitive Substitutes: Biopesticides, organic farming methods, and integrated pest management (IPM) strategies.
  • M&A Activity: xx major deals (2019-2024), driven by market consolidation and expansion into new regions.
  • Innovation Barriers: High R&D costs, stringent regulatory approvals, and competition from bio-based alternatives.

Agrochemicals Market Growth Trends & Insights

The global agrochemicals market has experienced robust growth in recent years, driven by factors such as rising global population, increasing demand for food, and the adoption of intensive farming practices. The market size expanded from xx million units in 2019 to xx million units in 2024, exhibiting a CAGR of xx% during the historical period. Technological disruptions, such as the introduction of precision agriculture techniques and the development of advanced formulations, are accelerating market growth. Consumer behavior is shifting towards more sustainable and environmentally friendly agrochemicals, influencing product development and marketing strategies. Market penetration of advanced products like biopesticides is steadily increasing, albeit from a small base, expected to reach xx% by 2033. The forecast period (2025-2033) projects continued growth, with a projected CAGR of xx%, reaching xx million units by 2033.

Agrochemicals Market Growth

Dominant Regions, Countries, or Segments in Agrochemicals Market

North America and Asia-Pacific currently dominate the global agrochemicals market, driven by factors such as high agricultural productivity in North America, and rapidly expanding agricultural sector in Asia-Pacific. Within product types, the fertilizers segment holds the largest market share, driven by the significant demand for nutrient enrichment to boost crop yields. However, the pesticides segment is projected to exhibit the highest growth rate in the forecast period, driven by increasing pest and disease resistance.

  • North America: High agricultural output, significant adoption of advanced technologies.
  • Asia-Pacific: Rapidly growing agricultural sector, increasing demand for food security.
  • Europe: Stringent regulations, focus on sustainable agriculture practices.
  • Fertilizers: Largest market share, driven by high demand for nutrient enrichment.
  • Pesticides: Highest projected growth rate due to pest resistance and increasing crop diseases.
  • Crop-based applications: Dominant segment due to larger acreage and greater demand for yield enhancement.

Agrochemicals Market Product Landscape

Recent innovations in the agrochemicals industry include the development of targeted formulations, smart delivery systems and biological alternatives. These products offer higher efficacy, reduced environmental impact, and improved safety for farmers. The focus is on enhancing product performance through improved solubility, targeted application methods, and controlled release formulations, thereby maximizing efficacy while minimizing negative environmental consequences. These advancements increase the efficiency of the agricultural production and reduce the overall cost of cultivation.

Key Drivers, Barriers & Challenges in Agrochemicals Market

Key Drivers:

  • Growing global population and rising demand for food.
  • Intensification of farming practices and increased crop yields.
  • Technological advancements in formulation and delivery systems.
  • Favorable government policies and subsidies in several regions.

Challenges & Restraints:

  • Stringent regulations and environmental concerns regarding agrochemical usage.
  • Fluctuations in raw material prices and supply chain disruptions.
  • Growing adoption of organic and sustainable farming practices.
  • Intense competition among existing and new players.
  • xx% increase in regulatory hurdles between 2019 and 2024, leading to increased product development costs.

Emerging Opportunities in Agrochemicals Market

  • Growing demand for biopesticides and other sustainable agrochemicals.
  • Expansion into emerging markets with high agricultural potential.
  • Development of precision agriculture technologies for targeted application.
  • Focus on creating value-added services such as crop advisory services.
  • Increased adoption of digital technologies for farm management.

Growth Accelerators in the Agrochemicals Market Industry

Long-term growth in the agrochemicals market will be driven by technological advancements like artificial intelligence and machine learning in precision agriculture, coupled with strategic partnerships between agrochemical companies and agricultural technology providers. Expansion into untapped markets in developing countries and adoption of sustainable agricultural practices will significantly contribute to growth. Innovative business models and collaborations will unlock new avenues for market penetration.

Key Players Shaping the Agrochemicals Market Market

  • Archer-Daniels-Midland (ADM)
  • FMC Corporation
  • Corteva Agriscience AG
  • Yara International AS
  • Nutrien Ltd
  • Adama Agricultural Solutions
  • Bayer CropScience AG
  • Potash Corporation of Saskatchewan
  • Nufarm Ltd
  • BASF SE

Notable Milestones in Agrochemicals Market Sector

  • November 2022: Corteva Agriscience launched Kyro herbicide, a postemergence corn herbicide combining acetochlor, topramezone, and clopyralid.
  • November 2022: Adama registered its innovative herbicide Araddo® (Clethodim + Fluroxypyr-meptyl) for sale in Paraguay, planning further expansion in Latin America.
  • February 2022: Adama launched Timeline® FX, an advanced cross-spectrum spring foliar herbicide for cereals.
  • January 2022: Yara and Lantmännen signed a commercial agreement to bring fossil-free fertilizers to the market in Sweden starting in 2023.

In-Depth Agrochemicals Market Market Outlook

The future of the agrochemicals market looks promising, driven by the continuous need for increased food production to meet a growing global population. Strategic investments in R&D, focus on sustainable practices, and expansion into new geographical areas will determine the success of key players. The market is expected to witness sustained growth, driven by technological advancements and a growing emphasis on improving crop yields while minimizing environmental impact. The increasing awareness of climate change and its effects on agriculture will create further opportunities for the development and adoption of climate-smart agrochemicals.

Agrochemicals Market Segmentation

  • 1. Production Analysis
  • 2. Consumption Analysis
  • 3. Import Market Analysis (Value & Volume)
  • 4. Export Market Analysis (Value & Volume)
  • 5. Price Trend Analysis

Agrochemicals Market Segmentation By Geography

  • 1. North America
    • 1.1. United States
    • 1.2. Canada
    • 1.3. Mexico
  • 2. South America
    • 2.1. Brazil
    • 2.2. Argentina
    • 2.3. Rest of South America
  • 3. Europe
    • 3.1. United Kingdom
    • 3.2. Germany
    • 3.3. France
    • 3.4. Italy
    • 3.5. Spain
    • 3.6. Russia
    • 3.7. Benelux
    • 3.8. Nordics
    • 3.9. Rest of Europe
  • 4. Middle East & Africa
    • 4.1. Turkey
    • 4.2. Israel
    • 4.3. GCC
    • 4.4. North Africa
    • 4.5. South Africa
    • 4.6. Rest of Middle East & Africa
  • 5. Asia Pacific
    • 5.1. China
    • 5.2. India
    • 5.3. Japan
    • 5.4. South Korea
    • 5.5. ASEAN
    • 5.6. Oceania
    • 5.7. Rest of Asia Pacific
Agrochemicals Market Regional Share


Agrochemicals Market REPORT HIGHLIGHTS

AspectsDetails
Study Period 2019-2033
Base Year 2024
Estimated Year 2025
Forecast Period2025-2033
Historical Period2019-2024
Growth RateCAGR of 4.00% from 2019-2033
Segmentation
    • By Production Analysis
    • By Consumption Analysis
    • By Import Market Analysis (Value & Volume)
    • By Export Market Analysis (Value & Volume)
    • By Price Trend Analysis
  • By Geography
    • North America
      • United States
      • Canada
      • Mexico
    • South America
      • Brazil
      • Argentina
      • Rest of South America
    • Europe
      • United Kingdom
      • Germany
      • France
      • Italy
      • Spain
      • Russia
      • Benelux
      • Nordics
      • Rest of Europe
    • Middle East & Africa
      • Turkey
      • Israel
      • GCC
      • North Africa
      • South Africa
      • Rest of Middle East & Africa
    • Asia Pacific
      • China
      • India
      • Japan
      • South Korea
      • ASEAN
      • Oceania
      • Rest of Asia Pacific


Table of Contents

  1. 1. Introduction
    • 1.1. Research Scope
    • 1.2. Market Segmentation
    • 1.3. Research Methodology
    • 1.4. Definitions and Assumptions
  2. 2. Executive Summary
    • 2.1. Introduction
  3. 3. Market Dynamics
    • 3.1. Introduction
      • 3.2. Market Drivers
        • 3.2.1. Adoption of Organic and Eco-friendly Farming Practices; Declining Area of Arable Land and Rising Food Security Concerns
      • 3.3. Market Restrains
        • 3.3.1. High Demand for Conventional and Synthetic Products; Lack of Awareness and Other Factors Limiting the Adoption of Agricultural Inoculants
      • 3.4. Market Trends
        • 3.4.1. Increasing Population and Consequent Rise in Food Demand
  4. 4. Market Factor Analysis
    • 4.1. Porters Five Forces
    • 4.2. Supply/Value Chain
    • 4.3. PESTEL analysis
    • 4.4. Market Entropy
    • 4.5. Patent/Trademark Analysis
  5. 5. Global Agrochemicals Market Analysis, Insights and Forecast, 2019-2031
    • 5.1. Market Analysis, Insights and Forecast - by Production Analysis
      • 5.2. Market Analysis, Insights and Forecast - by Consumption Analysis
        • 5.3. Market Analysis, Insights and Forecast - by Import Market Analysis (Value & Volume)
          • 5.4. Market Analysis, Insights and Forecast - by Export Market Analysis (Value & Volume)
            • 5.5. Market Analysis, Insights and Forecast - by Price Trend Analysis
              • 5.6. Market Analysis, Insights and Forecast - by Region
                • 5.6.1. North America
                • 5.6.2. South America
                • 5.6.3. Europe
                • 5.6.4. Middle East & Africa
                • 5.6.5. Asia Pacific
            • 6. North America Agrochemicals Market Analysis, Insights and Forecast, 2019-2031
              • 6.1. Market Analysis, Insights and Forecast - by Production Analysis
                • 6.2. Market Analysis, Insights and Forecast - by Consumption Analysis
                  • 6.3. Market Analysis, Insights and Forecast - by Import Market Analysis (Value & Volume)
                    • 6.4. Market Analysis, Insights and Forecast - by Export Market Analysis (Value & Volume)
                      • 6.5. Market Analysis, Insights and Forecast - by Price Trend Analysis
                      • 7. South America Agrochemicals Market Analysis, Insights and Forecast, 2019-2031
                        • 7.1. Market Analysis, Insights and Forecast - by Production Analysis
                          • 7.2. Market Analysis, Insights and Forecast - by Consumption Analysis
                            • 7.3. Market Analysis, Insights and Forecast - by Import Market Analysis (Value & Volume)
                              • 7.4. Market Analysis, Insights and Forecast - by Export Market Analysis (Value & Volume)
                                • 7.5. Market Analysis, Insights and Forecast - by Price Trend Analysis
                                • 8. Europe Agrochemicals Market Analysis, Insights and Forecast, 2019-2031
                                  • 8.1. Market Analysis, Insights and Forecast - by Production Analysis
                                    • 8.2. Market Analysis, Insights and Forecast - by Consumption Analysis
                                      • 8.3. Market Analysis, Insights and Forecast - by Import Market Analysis (Value & Volume)
                                        • 8.4. Market Analysis, Insights and Forecast - by Export Market Analysis (Value & Volume)
                                          • 8.5. Market Analysis, Insights and Forecast - by Price Trend Analysis
                                          • 9. Middle East & Africa Agrochemicals Market Analysis, Insights and Forecast, 2019-2031
                                            • 9.1. Market Analysis, Insights and Forecast - by Production Analysis
                                              • 9.2. Market Analysis, Insights and Forecast - by Consumption Analysis
                                                • 9.3. Market Analysis, Insights and Forecast - by Import Market Analysis (Value & Volume)
                                                  • 9.4. Market Analysis, Insights and Forecast - by Export Market Analysis (Value & Volume)
                                                    • 9.5. Market Analysis, Insights and Forecast - by Price Trend Analysis
                                                    • 10. Asia Pacific Agrochemicals Market Analysis, Insights and Forecast, 2019-2031
                                                      • 10.1. Market Analysis, Insights and Forecast - by Production Analysis
                                                        • 10.2. Market Analysis, Insights and Forecast - by Consumption Analysis
                                                          • 10.3. Market Analysis, Insights and Forecast - by Import Market Analysis (Value & Volume)
                                                            • 10.4. Market Analysis, Insights and Forecast - by Export Market Analysis (Value & Volume)
                                                              • 10.5. Market Analysis, Insights and Forecast - by Price Trend Analysis
                                                              • 11. North America Agrochemicals Market Analysis, Insights and Forecast, 2019-2031
                                                                  • 11.1. Market Analysis, Insights and Forecast - By Country/Sub-region
                                                                    • 11.1.1 United States
                                                                    • 11.1.2 Canada
                                                                    • 11.1.3 Mexico
                                                                    • 11.1.4 Rest of North America
                                                              • 12. Europe Agrochemicals Market Analysis, Insights and Forecast, 2019-2031
                                                                  • 12.1. Market Analysis, Insights and Forecast - By Country/Sub-region
                                                                    • 12.1.1 Spain
                                                                    • 12.1.2 United Kingdom
                                                                    • 12.1.3 France
                                                                    • 12.1.4 Germany
                                                                    • 12.1.5 Russia
                                                                    • 12.1.6 Italy
                                                                    • 12.1.7 Rest of Europe
                                                              • 13. Asia Pacific Agrochemicals Market Analysis, Insights and Forecast, 2019-2031
                                                                  • 13.1. Market Analysis, Insights and Forecast - By Country/Sub-region
                                                                    • 13.1.1 China
                                                                    • 13.1.2 India
                                                                    • 13.1.3 Japan
                                                                    • 13.1.4 Australia
                                                                    • 13.1.5 Rest of Asia Pacific
                                                              • 14. South America Agrochemicals Market Analysis, Insights and Forecast, 2019-2031
                                                                  • 14.1. Market Analysis, Insights and Forecast - By Country/Sub-region
                                                                    • 14.1.1 Brazil
                                                                    • 14.1.2 Argentina
                                                                    • 14.1.3 Rest of South America
                                                              • 15. Africa Agrochemicals Market Analysis, Insights and Forecast, 2019-2031
                                                                  • 15.1. Market Analysis, Insights and Forecast - By Country/Sub-region
                                                                    • 15.1.1 South Africa
                                                                    • 15.1.2 Rest of Africa
                                                              • 16. Competitive Analysis
                                                                • 16.1. Global Market Share Analysis 2024
                                                                  • 16.2. Company Profiles
                                                                    • 16.2.1 Archer-Daniels-Midland (ADM)
                                                                      • 16.2.1.1. Overview
                                                                      • 16.2.1.2. Products
                                                                      • 16.2.1.3. SWOT Analysis
                                                                      • 16.2.1.4. Recent Developments
                                                                      • 16.2.1.5. Financials (Based on Availability)
                                                                    • 16.2.2 FMC Corporation
                                                                      • 16.2.2.1. Overview
                                                                      • 16.2.2.2. Products
                                                                      • 16.2.2.3. SWOT Analysis
                                                                      • 16.2.2.4. Recent Developments
                                                                      • 16.2.2.5. Financials (Based on Availability)
                                                                    • 16.2.3 Corteva Agriscience AG
                                                                      • 16.2.3.1. Overview
                                                                      • 16.2.3.2. Products
                                                                      • 16.2.3.3. SWOT Analysis
                                                                      • 16.2.3.4. Recent Developments
                                                                      • 16.2.3.5. Financials (Based on Availability)
                                                                    • 16.2.4 Yara International AS
                                                                      • 16.2.4.1. Overview
                                                                      • 16.2.4.2. Products
                                                                      • 16.2.4.3. SWOT Analysis
                                                                      • 16.2.4.4. Recent Developments
                                                                      • 16.2.4.5. Financials (Based on Availability)
                                                                    • 16.2.5 Nutrien Ltd
                                                                      • 16.2.5.1. Overview
                                                                      • 16.2.5.2. Products
                                                                      • 16.2.5.3. SWOT Analysis
                                                                      • 16.2.5.4. Recent Developments
                                                                      • 16.2.5.5. Financials (Based on Availability)
                                                                    • 16.2.6 Adama Agricultural Solutions
                                                                      • 16.2.6.1. Overview
                                                                      • 16.2.6.2. Products
                                                                      • 16.2.6.3. SWOT Analysis
                                                                      • 16.2.6.4. Recent Developments
                                                                      • 16.2.6.5. Financials (Based on Availability)
                                                                    • 16.2.7 Bayer CropScience AG
                                                                      • 16.2.7.1. Overview
                                                                      • 16.2.7.2. Products
                                                                      • 16.2.7.3. SWOT Analysis
                                                                      • 16.2.7.4. Recent Developments
                                                                      • 16.2.7.5. Financials (Based on Availability)
                                                                    • 16.2.8 Potash Corporation of Saskatchewan
                                                                      • 16.2.8.1. Overview
                                                                      • 16.2.8.2. Products
                                                                      • 16.2.8.3. SWOT Analysis
                                                                      • 16.2.8.4. Recent Developments
                                                                      • 16.2.8.5. Financials (Based on Availability)
                                                                    • 16.2.9 Nufarm Ltd
                                                                      • 16.2.9.1. Overview
                                                                      • 16.2.9.2. Products
                                                                      • 16.2.9.3. SWOT Analysis
                                                                      • 16.2.9.4. Recent Developments
                                                                      • 16.2.9.5. Financials (Based on Availability)
                                                                    • 16.2.10 BASF SE
                                                                      • 16.2.10.1. Overview
                                                                      • 16.2.10.2. Products
                                                                      • 16.2.10.3. SWOT Analysis
                                                                      • 16.2.10.4. Recent Developments
                                                                      • 16.2.10.5. Financials (Based on Availability)

                                                              List of Figures

                                                              1. Figure 1: Global Agrochemicals Market Revenue Breakdown (Million, %) by Region 2024 & 2032
                                                              2. Figure 2: North America Agrochemicals Market Revenue (Million), by Country 2024 & 2032
                                                              3. Figure 3: North America Agrochemicals Market Revenue Share (%), by Country 2024 & 2032
                                                              4. Figure 4: Europe Agrochemicals Market Revenue (Million), by Country 2024 & 2032
                                                              5. Figure 5: Europe Agrochemicals Market Revenue Share (%), by Country 2024 & 2032
                                                              6. Figure 6: Asia Pacific Agrochemicals Market Revenue (Million), by Country 2024 & 2032
                                                              7. Figure 7: Asia Pacific Agrochemicals Market Revenue Share (%), by Country 2024 & 2032
                                                              8. Figure 8: South America Agrochemicals Market Revenue (Million), by Country 2024 & 2032
                                                              9. Figure 9: South America Agrochemicals Market Revenue Share (%), by Country 2024 & 2032
                                                              10. Figure 10: Africa Agrochemicals Market Revenue (Million), by Country 2024 & 2032
                                                              11. Figure 11: Africa Agrochemicals Market Revenue Share (%), by Country 2024 & 2032
                                                              12. Figure 12: North America Agrochemicals Market Revenue (Million), by Production Analysis 2024 & 2032
                                                              13. Figure 13: North America Agrochemicals Market Revenue Share (%), by Production Analysis 2024 & 2032
                                                              14. Figure 14: North America Agrochemicals Market Revenue (Million), by Consumption Analysis 2024 & 2032
                                                              15. Figure 15: North America Agrochemicals Market Revenue Share (%), by Consumption Analysis 2024 & 2032
                                                              16. Figure 16: North America Agrochemicals Market Revenue (Million), by Import Market Analysis (Value & Volume) 2024 & 2032
                                                              17. Figure 17: North America Agrochemicals Market Revenue Share (%), by Import Market Analysis (Value & Volume) 2024 & 2032
                                                              18. Figure 18: North America Agrochemicals Market Revenue (Million), by Export Market Analysis (Value & Volume) 2024 & 2032
                                                              19. Figure 19: North America Agrochemicals Market Revenue Share (%), by Export Market Analysis (Value & Volume) 2024 & 2032
                                                              20. Figure 20: North America Agrochemicals Market Revenue (Million), by Price Trend Analysis 2024 & 2032
                                                              21. Figure 21: North America Agrochemicals Market Revenue Share (%), by Price Trend Analysis 2024 & 2032
                                                              22. Figure 22: North America Agrochemicals Market Revenue (Million), by Country 2024 & 2032
                                                              23. Figure 23: North America Agrochemicals Market Revenue Share (%), by Country 2024 & 2032
                                                              24. Figure 24: South America Agrochemicals Market Revenue (Million), by Production Analysis 2024 & 2032
                                                              25. Figure 25: South America Agrochemicals Market Revenue Share (%), by Production Analysis 2024 & 2032
                                                              26. Figure 26: South America Agrochemicals Market Revenue (Million), by Consumption Analysis 2024 & 2032
                                                              27. Figure 27: South America Agrochemicals Market Revenue Share (%), by Consumption Analysis 2024 & 2032
                                                              28. Figure 28: South America Agrochemicals Market Revenue (Million), by Import Market Analysis (Value & Volume) 2024 & 2032
                                                              29. Figure 29: South America Agrochemicals Market Revenue Share (%), by Import Market Analysis (Value & Volume) 2024 & 2032
                                                              30. Figure 30: South America Agrochemicals Market Revenue (Million), by Export Market Analysis (Value & Volume) 2024 & 2032
                                                              31. Figure 31: South America Agrochemicals Market Revenue Share (%), by Export Market Analysis (Value & Volume) 2024 & 2032
                                                              32. Figure 32: South America Agrochemicals Market Revenue (Million), by Price Trend Analysis 2024 & 2032
                                                              33. Figure 33: South America Agrochemicals Market Revenue Share (%), by Price Trend Analysis 2024 & 2032
                                                              34. Figure 34: South America Agrochemicals Market Revenue (Million), by Country 2024 & 2032
                                                              35. Figure 35: South America Agrochemicals Market Revenue Share (%), by Country 2024 & 2032
                                                              36. Figure 36: Europe Agrochemicals Market Revenue (Million), by Production Analysis 2024 & 2032
                                                              37. Figure 37: Europe Agrochemicals Market Revenue Share (%), by Production Analysis 2024 & 2032
                                                              38. Figure 38: Europe Agrochemicals Market Revenue (Million), by Consumption Analysis 2024 & 2032
                                                              39. Figure 39: Europe Agrochemicals Market Revenue Share (%), by Consumption Analysis 2024 & 2032
                                                              40. Figure 40: Europe Agrochemicals Market Revenue (Million), by Import Market Analysis (Value & Volume) 2024 & 2032
                                                              41. Figure 41: Europe Agrochemicals Market Revenue Share (%), by Import Market Analysis (Value & Volume) 2024 & 2032
                                                              42. Figure 42: Europe Agrochemicals Market Revenue (Million), by Export Market Analysis (Value & Volume) 2024 & 2032
                                                              43. Figure 43: Europe Agrochemicals Market Revenue Share (%), by Export Market Analysis (Value & Volume) 2024 & 2032
                                                              44. Figure 44: Europe Agrochemicals Market Revenue (Million), by Price Trend Analysis 2024 & 2032
                                                              45. Figure 45: Europe Agrochemicals Market Revenue Share (%), by Price Trend Analysis 2024 & 2032
                                                              46. Figure 46: Europe Agrochemicals Market Revenue (Million), by Country 2024 & 2032
                                                              47. Figure 47: Europe Agrochemicals Market Revenue Share (%), by Country 2024 & 2032
                                                              48. Figure 48: Middle East & Africa Agrochemicals Market Revenue (Million), by Production Analysis 2024 & 2032
                                                              49. Figure 49: Middle East & Africa Agrochemicals Market Revenue Share (%), by Production Analysis 2024 & 2032
                                                              50. Figure 50: Middle East & Africa Agrochemicals Market Revenue (Million), by Consumption Analysis 2024 & 2032
                                                              51. Figure 51: Middle East & Africa Agrochemicals Market Revenue Share (%), by Consumption Analysis 2024 & 2032
                                                              52. Figure 52: Middle East & Africa Agrochemicals Market Revenue (Million), by Import Market Analysis (Value & Volume) 2024 & 2032
                                                              53. Figure 53: Middle East & Africa Agrochemicals Market Revenue Share (%), by Import Market Analysis (Value & Volume) 2024 & 2032
                                                              54. Figure 54: Middle East & Africa Agrochemicals Market Revenue (Million), by Export Market Analysis (Value & Volume) 2024 & 2032
                                                              55. Figure 55: Middle East & Africa Agrochemicals Market Revenue Share (%), by Export Market Analysis (Value & Volume) 2024 & 2032
                                                              56. Figure 56: Middle East & Africa Agrochemicals Market Revenue (Million), by Price Trend Analysis 2024 & 2032
                                                              57. Figure 57: Middle East & Africa Agrochemicals Market Revenue Share (%), by Price Trend Analysis 2024 & 2032
                                                              58. Figure 58: Middle East & Africa Agrochemicals Market Revenue (Million), by Country 2024 & 2032
                                                              59. Figure 59: Middle East & Africa Agrochemicals Market Revenue Share (%), by Country 2024 & 2032
                                                              60. Figure 60: Asia Pacific Agrochemicals Market Revenue (Million), by Production Analysis 2024 & 2032
                                                              61. Figure 61: Asia Pacific Agrochemicals Market Revenue Share (%), by Production Analysis 2024 & 2032
                                                              62. Figure 62: Asia Pacific Agrochemicals Market Revenue (Million), by Consumption Analysis 2024 & 2032
                                                              63. Figure 63: Asia Pacific Agrochemicals Market Revenue Share (%), by Consumption Analysis 2024 & 2032
                                                              64. Figure 64: Asia Pacific Agrochemicals Market Revenue (Million), by Import Market Analysis (Value & Volume) 2024 & 2032
                                                              65. Figure 65: Asia Pacific Agrochemicals Market Revenue Share (%), by Import Market Analysis (Value & Volume) 2024 & 2032
                                                              66. Figure 66: Asia Pacific Agrochemicals Market Revenue (Million), by Export Market Analysis (Value & Volume) 2024 & 2032
                                                              67. Figure 67: Asia Pacific Agrochemicals Market Revenue Share (%), by Export Market Analysis (Value & Volume) 2024 & 2032
                                                              68. Figure 68: Asia Pacific Agrochemicals Market Revenue (Million), by Price Trend Analysis 2024 & 2032
                                                              69. Figure 69: Asia Pacific Agrochemicals Market Revenue Share (%), by Price Trend Analysis 2024 & 2032
                                                              70. Figure 70: Asia Pacific Agrochemicals Market Revenue (Million), by Country 2024 & 2032
                                                              71. Figure 71: Asia Pacific Agrochemicals Market Revenue Share (%), by Country 2024 & 2032

                                                              List of Tables

                                                              1. Table 1: Global Agrochemicals Market Revenue Million Forecast, by Region 2019 & 2032
                                                              2. Table 2: Global Agrochemicals Market Revenue Million Forecast, by Production Analysis 2019 & 2032
                                                              3. Table 3: Global Agrochemicals Market Revenue Million Forecast, by Consumption Analysis 2019 & 2032
                                                              4. Table 4: Global Agrochemicals Market Revenue Million Forecast, by Import Market Analysis (Value & Volume) 2019 & 2032
                                                              5. Table 5: Global Agrochemicals Market Revenue Million Forecast, by Export Market Analysis (Value & Volume) 2019 & 2032
                                                              6. Table 6: Global Agrochemicals Market Revenue Million Forecast, by Price Trend Analysis 2019 & 2032
                                                              7. Table 7: Global Agrochemicals Market Revenue Million Forecast, by Region 2019 & 2032
                                                              8. Table 8: Global Agrochemicals Market Revenue Million Forecast, by Country 2019 & 2032
                                                              9. Table 9: United States Agrochemicals Market Revenue (Million) Forecast, by Application 2019 & 2032
                                                              10. Table 10: Canada Agrochemicals Market Revenue (Million) Forecast, by Application 2019 & 2032
                                                              11. Table 11: Mexico Agrochemicals Market Revenue (Million) Forecast, by Application 2019 & 2032
                                                              12. Table 12: Rest of North America Agrochemicals Market Revenue (Million) Forecast, by Application 2019 & 2032
                                                              13. Table 13: Global Agrochemicals Market Revenue Million Forecast, by Country 2019 & 2032
                                                              14. Table 14: Spain Agrochemicals Market Revenue (Million) Forecast, by Application 2019 & 2032
                                                              15. Table 15: United Kingdom Agrochemicals Market Revenue (Million) Forecast, by Application 2019 & 2032
                                                              16. Table 16: France Agrochemicals Market Revenue (Million) Forecast, by Application 2019 & 2032
                                                              17. Table 17: Germany Agrochemicals Market Revenue (Million) Forecast, by Application 2019 & 2032
                                                              18. Table 18: Russia Agrochemicals Market Revenue (Million) Forecast, by Application 2019 & 2032
                                                              19. Table 19: Italy Agrochemicals Market Revenue (Million) Forecast, by Application 2019 & 2032
                                                              20. Table 20: Rest of Europe Agrochemicals Market Revenue (Million) Forecast, by Application 2019 & 2032
                                                              21. Table 21: Global Agrochemicals Market Revenue Million Forecast, by Country 2019 & 2032
                                                              22. Table 22: China Agrochemicals Market Revenue (Million) Forecast, by Application 2019 & 2032
                                                              23. Table 23: India Agrochemicals Market Revenue (Million) Forecast, by Application 2019 & 2032
                                                              24. Table 24: Japan Agrochemicals Market Revenue (Million) Forecast, by Application 2019 & 2032
                                                              25. Table 25: Australia Agrochemicals Market Revenue (Million) Forecast, by Application 2019 & 2032
                                                              26. Table 26: Rest of Asia Pacific Agrochemicals Market Revenue (Million) Forecast, by Application 2019 & 2032
                                                              27. Table 27: Global Agrochemicals Market Revenue Million Forecast, by Country 2019 & 2032
                                                              28. Table 28: Brazil Agrochemicals Market Revenue (Million) Forecast, by Application 2019 & 2032
                                                              29. Table 29: Argentina Agrochemicals Market Revenue (Million) Forecast, by Application 2019 & 2032
                                                              30. Table 30: Rest of South America Agrochemicals Market Revenue (Million) Forecast, by Application 2019 & 2032
                                                              31. Table 31: Global Agrochemicals Market Revenue Million Forecast, by Country 2019 & 2032
                                                              32. Table 32: South Africa Agrochemicals Market Revenue (Million) Forecast, by Application 2019 & 2032
                                                              33. Table 33: Rest of Africa Agrochemicals Market Revenue (Million) Forecast, by Application 2019 & 2032
                                                              34. Table 34: Global Agrochemicals Market Revenue Million Forecast, by Production Analysis 2019 & 2032
                                                              35. Table 35: Global Agrochemicals Market Revenue Million Forecast, by Consumption Analysis 2019 & 2032
                                                              36. Table 36: Global Agrochemicals Market Revenue Million Forecast, by Import Market Analysis (Value & Volume) 2019 & 2032
                                                              37. Table 37: Global Agrochemicals Market Revenue Million Forecast, by Export Market Analysis (Value & Volume) 2019 & 2032
                                                              38. Table 38: Global Agrochemicals Market Revenue Million Forecast, by Price Trend Analysis 2019 & 2032
                                                              39. Table 39: Global Agrochemicals Market Revenue Million Forecast, by Country 2019 & 2032
                                                              40. Table 40: United States Agrochemicals Market Revenue (Million) Forecast, by Application 2019 & 2032
                                                              41. Table 41: Canada Agrochemicals Market Revenue (Million) Forecast, by Application 2019 & 2032
                                                              42. Table 42: Mexico Agrochemicals Market Revenue (Million) Forecast, by Application 2019 & 2032
                                                              43. Table 43: Global Agrochemicals Market Revenue Million Forecast, by Production Analysis 2019 & 2032
                                                              44. Table 44: Global Agrochemicals Market Revenue Million Forecast, by Consumption Analysis 2019 & 2032
                                                              45. Table 45: Global Agrochemicals Market Revenue Million Forecast, by Import Market Analysis (Value & Volume) 2019 & 2032
                                                              46. Table 46: Global Agrochemicals Market Revenue Million Forecast, by Export Market Analysis (Value & Volume) 2019 & 2032
                                                              47. Table 47: Global Agrochemicals Market Revenue Million Forecast, by Price Trend Analysis 2019 & 2032
                                                              48. Table 48: Global Agrochemicals Market Revenue Million Forecast, by Country 2019 & 2032
                                                              49. Table 49: Brazil Agrochemicals Market Revenue (Million) Forecast, by Application 2019 & 2032
                                                              50. Table 50: Argentina Agrochemicals Market Revenue (Million) Forecast, by Application 2019 & 2032
                                                              51. Table 51: Rest of South America Agrochemicals Market Revenue (Million) Forecast, by Application 2019 & 2032
                                                              52. Table 52: Global Agrochemicals Market Revenue Million Forecast, by Production Analysis 2019 & 2032
                                                              53. Table 53: Global Agrochemicals Market Revenue Million Forecast, by Consumption Analysis 2019 & 2032
                                                              54. Table 54: Global Agrochemicals Market Revenue Million Forecast, by Import Market Analysis (Value & Volume) 2019 & 2032
                                                              55. Table 55: Global Agrochemicals Market Revenue Million Forecast, by Export Market Analysis (Value & Volume) 2019 & 2032
                                                              56. Table 56: Global Agrochemicals Market Revenue Million Forecast, by Price Trend Analysis 2019 & 2032
                                                              57. Table 57: Global Agrochemicals Market Revenue Million Forecast, by Country 2019 & 2032
                                                              58. Table 58: United Kingdom Agrochemicals Market Revenue (Million) Forecast, by Application 2019 & 2032
                                                              59. Table 59: Germany Agrochemicals Market Revenue (Million) Forecast, by Application 2019 & 2032
                                                              60. Table 60: France Agrochemicals Market Revenue (Million) Forecast, by Application 2019 & 2032
                                                              61. Table 61: Italy Agrochemicals Market Revenue (Million) Forecast, by Application 2019 & 2032
                                                              62. Table 62: Spain Agrochemicals Market Revenue (Million) Forecast, by Application 2019 & 2032
                                                              63. Table 63: Russia Agrochemicals Market Revenue (Million) Forecast, by Application 2019 & 2032
                                                              64. Table 64: Benelux Agrochemicals Market Revenue (Million) Forecast, by Application 2019 & 2032
                                                              65. Table 65: Nordics Agrochemicals Market Revenue (Million) Forecast, by Application 2019 & 2032
                                                              66. Table 66: Rest of Europe Agrochemicals Market Revenue (Million) Forecast, by Application 2019 & 2032
                                                              67. Table 67: Global Agrochemicals Market Revenue Million Forecast, by Production Analysis 2019 & 2032
                                                              68. Table 68: Global Agrochemicals Market Revenue Million Forecast, by Consumption Analysis 2019 & 2032
                                                              69. Table 69: Global Agrochemicals Market Revenue Million Forecast, by Import Market Analysis (Value & Volume) 2019 & 2032
                                                              70. Table 70: Global Agrochemicals Market Revenue Million Forecast, by Export Market Analysis (Value & Volume) 2019 & 2032
                                                              71. Table 71: Global Agrochemicals Market Revenue Million Forecast, by Price Trend Analysis 2019 & 2032
                                                              72. Table 72: Global Agrochemicals Market Revenue Million Forecast, by Country 2019 & 2032
                                                              73. Table 73: Turkey Agrochemicals Market Revenue (Million) Forecast, by Application 2019 & 2032
                                                              74. Table 74: Israel Agrochemicals Market Revenue (Million) Forecast, by Application 2019 & 2032
                                                              75. Table 75: GCC Agrochemicals Market Revenue (Million) Forecast, by Application 2019 & 2032
                                                              76. Table 76: North Africa Agrochemicals Market Revenue (Million) Forecast, by Application 2019 & 2032
                                                              77. Table 77: South Africa Agrochemicals Market Revenue (Million) Forecast, by Application 2019 & 2032
                                                              78. Table 78: Rest of Middle East & Africa Agrochemicals Market Revenue (Million) Forecast, by Application 2019 & 2032
                                                              79. Table 79: Global Agrochemicals Market Revenue Million Forecast, by Production Analysis 2019 & 2032
                                                              80. Table 80: Global Agrochemicals Market Revenue Million Forecast, by Consumption Analysis 2019 & 2032
                                                              81. Table 81: Global Agrochemicals Market Revenue Million Forecast, by Import Market Analysis (Value & Volume) 2019 & 2032
                                                              82. Table 82: Global Agrochemicals Market Revenue Million Forecast, by Export Market Analysis (Value & Volume) 2019 & 2032
                                                              83. Table 83: Global Agrochemicals Market Revenue Million Forecast, by Price Trend Analysis 2019 & 2032
                                                              84. Table 84: Global Agrochemicals Market Revenue Million Forecast, by Country 2019 & 2032
                                                              85. Table 85: China Agrochemicals Market Revenue (Million) Forecast, by Application 2019 & 2032
                                                              86. Table 86: India Agrochemicals Market Revenue (Million) Forecast, by Application 2019 & 2032
                                                              87. Table 87: Japan Agrochemicals Market Revenue (Million) Forecast, by Application 2019 & 2032
                                                              88. Table 88: South Korea Agrochemicals Market Revenue (Million) Forecast, by Application 2019 & 2032
                                                              89. Table 89: ASEAN Agrochemicals Market Revenue (Million) Forecast, by Application 2019 & 2032
                                                              90. Table 90: Oceania Agrochemicals Market Revenue (Million) Forecast, by Application 2019 & 2032
                                                              91. Table 91: Rest of Asia Pacific Agrochemicals Market Revenue (Million) Forecast, by Application 2019 & 2032


                                                              Frequently Asked Questions

                                                              1. What is the projected Compound Annual Growth Rate (CAGR) of the Agrochemicals Market?

                                                              The projected CAGR is approximately 4.00%.

                                                              2. Which companies are prominent players in the Agrochemicals Market?

                                                              Key companies in the market include Archer-Daniels-Midland (ADM), FMC Corporation, Corteva Agriscience AG, Yara International AS, Nutrien Ltd, Adama Agricultural Solutions, Bayer CropScience AG, Potash Corporation of Saskatchewan, Nufarm Ltd, BASF SE.

                                                              3. What are the main segments of the Agrochemicals Market?

                                                              The market segments include Production Analysis, Consumption Analysis, Import Market Analysis (Value & Volume), Export Market Analysis (Value & Volume), Price Trend Analysis.

                                                              4. Can you provide details about the market size?

                                                              The market size is estimated to be USD 253.29 Million as of 2022.

                                                              5. What are some drivers contributing to market growth?

                                                              Adoption of Organic and Eco-friendly Farming Practices; Declining Area of Arable Land and Rising Food Security Concerns.

                                                              6. What are the notable trends driving market growth?

                                                              Increasing Population and Consequent Rise in Food Demand.

                                                              7. Are there any restraints impacting market growth?

                                                              High Demand for Conventional and Synthetic Products; Lack of Awareness and Other Factors Limiting the Adoption of Agricultural Inoculants.

                                                              8. Can you provide examples of recent developments in the market?

                                                              November 2022: Corteva Agriscience launched the new postemergence corn herbicide. Kyro herbicide is the first product on the market to combine the active ingredients acetochlor, topramezone, and clopyralid into one premix. The US Environmental Protection Agency (EPA) has approved the registration of Kyro herbicide, and the new solution will be available for US corn farmers for the 2023 growing season, pending individual state registrations.

                                                              9. What pricing options are available for accessing the report?

                                                              Pricing options include single-user, multi-user, and enterprise licenses priced at USD 4750, USD 5250, and USD 8750 respectively.

                                                              10. Is the market size provided in terms of value or volume?

                                                              The market size is provided in terms of value, measured in Million.

                                                              11. Are there any specific market keywords associated with the report?

                                                              Yes, the market keyword associated with the report is "Agrochemicals Market," which aids in identifying and referencing the specific market segment covered.

                                                              12. How do I determine which pricing option suits my needs best?

                                                              The pricing options vary based on user requirements and access needs. Individual users may opt for single-user licenses, while businesses requiring broader access may choose multi-user or enterprise licenses for cost-effective access to the report.

                                                              13. Are there any additional resources or data provided in the Agrochemicals Market report?

                                                              While the report offers comprehensive insights, it's advisable to review the specific contents or supplementary materials provided to ascertain if additional resources or data are available.

                                                              14. How can I stay updated on further developments or reports in the Agrochemicals Market?

                                                              To stay informed about further developments, trends, and reports in the Agrochemicals Market, consider subscribing to industry newsletters, following relevant companies and organizations, or regularly checking reputable industry news sources and publications.


                                                              Methodology

                                                              Step 1 - Identification of Relevant Samples Size from Population Database

                                                              Step Chart
                                                              Bar Chart
                                                              Method Chart

                                                              Step 2 - Approaches for Defining Global Market Size (Value, Volume* & Price*)

                                                              Approach Chart
                                                              Top-down and bottom-up approaches are used to validate the global market size and estimate the market size for manufactures, regional segments, product, and application.

                                                              Note*: In applicable scenarios

                                                              Step 3 - Data Sources

                                                              Primary Research

                                                              • Web Analytics
                                                              • Survey Reports
                                                              • Research Institute
                                                              • Latest Research Reports
                                                              • Opinion Leaders

                                                              Secondary Research

                                                              • Annual Reports
                                                              • White Paper
                                                              • Latest Press Release
                                                              • Industry Association
                                                              • Paid Database
                                                              • Investor Presentations
                                                              Analyst Chart

                                                              Step 4 - Data Triangulation

                                                              Involves using different sources of information in order to increase the validity of a study

                                                              These sources are likely to be stakeholders in a program - participants, other researchers, program staff, other community members, and so on.

                                                              Then we put all data in single framework & apply various statistical tools to find out the dynamic on the market.

                                                              During the analysis stage, feedback from the stakeholder groups would be compared to determine areas of agreement as well as areas of divergence

                                                              Additionally, after gathering mixed and scattered data from a wide range of sources, data is triangulated and correlated to come up with estimated figures which are further validated through primary mediums or industry experts, opinion leaders.

                                                              About Visionary Data Reports

                                                              Visionary Data Reports provides future-focused market research, advanced analytics, and strategic insights for technology, healthcare, green energy, and finance. Our reports help you anticipate trends, innovate, and lead in your industry. Our expert team combines primary research, data science, and industry knowledge to deliver actionable intelligence. We offer syndicated reports, custom analytics, and consulting services tailored to your business needs. At Visionary Data Reports, we are committed to quality, transparency, and client satisfaction. Every report is rigorously validated to ensure accuracy and relevance. Our global perspective and forward-thinking approach help you understand both current and emerging market dynamics.

                                                              Stay ahead with Visionary Data Reports. Subscribe to our newsletter for the latest insights and research highlights, and follow us on social media for real-time updates. Visionary Data Reports – Your Guide to Tomorrow’s Opportunities.

                                                              Business Address

                                                              Head Office

                                                              Office no. A 5010, fifth floor, Solitaire Business Hub, Near Phoenix mall, Pune, Maharashtra 411014

                                                              Contact Information

                                                              Craig Francis

                                                              Business Development Head

                                                              +17162654855

                                                              [email protected]

                                                              Connect With Us

                                                              Secure Payment Partners

                                                              payment image
                                                              RetailLogisticsPackagingAutomotiveHealthcareAgricultureEnergy & PowerFood & BeverageAerospace & DefenseChemicals & MaterialsHospitality and TourismAnimal Nutrition & WellnessConsumer Goods and ServicesReal Estate and ConstructionHome and Property ImprovementTechnology, Media and TelecomManufacturing Products and ServicesFinancial Services and Investment Intelligence

                                                              © 2025 All rights reserved


                                                              Privacy Policy
                                                              Terms and Conditions
                                                              FAQ
                                                              • Home
                                                              • About Us
                                                              • Industries
                                                                • Aerospace & Defense
                                                                • Agriculture
                                                                • Animal Nutrition & Wellness
                                                                • Automotive
                                                                • Chemicals & Materials
                                                                • Consumer Goods and Services
                                                                • Energy & Power
                                                                • Financial Services and Investment Intelligence
                                                                • Food & Beverage
                                                                • Home and Property Improvement
                                                                • Hospitality and Tourism
                                                                • Logistics
                                                                • Manufacturing Products and Services
                                                                • Packaging
                                                                • Professional and Commercial Services
                                                                • Real Estate and Construction
                                                                • Retail
                                                                • Technology, Media and Telecom
                                                                • Healthcare
                                                              • Services
                                                              • Contact
                                                              Main Logo
                                                              • Home
                                                              • About Us
                                                              • Industries
                                                                • Aerospace & Defense
                                                                • Agriculture
                                                                • Animal Nutrition & Wellness
                                                                • Automotive
                                                                • Chemicals & Materials
                                                                • Consumer Goods and Services
                                                                • Energy & Power
                                                                • Financial Services and Investment Intelligence
                                                                • Food & Beverage
                                                                • Home and Property Improvement
                                                                • Hospitality and Tourism
                                                                • Logistics
                                                                • Manufacturing Products and Services
                                                                • Packaging
                                                                • Professional and Commercial Services
                                                                • Real Estate and Construction
                                                                • Retail
                                                                • Technology, Media and Telecom
                                                                • Healthcare
                                                              • Services
                                                              • Contact
                                                              +17162654855
                                                              [email protected]

                                                              +17162654855

                                                              [email protected]

                                                              artwork spiralartwork spiralRelated Reports
                                                              artwork underline

                                                              Europe Chia Seeds Market Market’s Role in Emerging Tech: Insights and Projections 2025-2033

                                                              Discover the booming European chia seeds market! This in-depth analysis reveals market size, CAGR, key players (The Chia Company, Salba, Nutiva), and growth drivers. Explore trends in packaging, applications (food, supplements, personal care), and regional variations. Learn how this €414.20 million market is poised for significant expansion.

                                                              July 2025
                                                              Base Year: 2024
                                                              No Of Pages: 180
                                                              Price: $4750

                                                              Drivers of Change in Thailand Vegetable Seed Market Market 2025-2033

                                                              Discover the thriving Thailand vegetable seed market's growth trajectory (CAGR 5.20%), driven by consumer demand and technological advancements. Explore market segmentation, key players, and challenges impacting this dynamic sector projected to reach $XXX million by 2033.

                                                              July 2025
                                                              Base Year: 2024
                                                              No Of Pages: 150
                                                              Price: $3800

                                                              Consumer Trends Driving Indonesia Fungicide Market Market Growth

                                                              Discover the booming Indonesia Fungicide Market! This report reveals a projected 16.50% CAGR from 2025-2033, driven by rising disease prevalence, advanced application methods, and government support. Learn about market size, key players (Bayer, Syngenta, BASF), and future trends impacting this dynamic agricultural sector.

                                                              July 2025
                                                              Base Year: 2024
                                                              No Of Pages: 197
                                                              Price: $3800

                                                              Tomato Seed Market 2025-2033 Overview: Trends, Competitor Dynamics, and Opportunities

                                                              Discover the booming global tomato seed market! This comprehensive analysis reveals key trends, growth drivers (hybrid seeds, protected cultivation), restraints, and regional insights (Asia-Pacific leading) for the period 2019-2033, featuring top players like Sakata Seeds and Syngenta. Projected CAGR of 4.70% showcases significant investment opportunities.

                                                              July 2025
                                                              Base Year: 2024
                                                              No Of Pages: 180
                                                              Price: $3800

                                                              Emerging Trends in Brazil Maize Market: A Technology Perspective 2025-2033

                                                              Discover the dynamic Brazil maize market forecast (2025-2033)! This in-depth analysis reveals key growth drivers, including animal feed, biofuel, and human consumption, alongside major players like Syngenta and Corteva. Explore market size, CAGR, and regional insights to understand this lucrative opportunity.

                                                              July 2025
                                                              Base Year: 2024
                                                              No Of Pages: 180
                                                              Price: $3800

                                                              Future Forecasts for North America Seed Treatment Market Industry Growth

                                                              Discover the booming North American seed treatment market! This in-depth analysis reveals a CAGR of 4.20% (2025-2033), driven by precision farming, pest control needs, and government support. Explore key players, market segments (fungicides, insecticides, crops), and regional trends in the US, Canada, and Mexico. Get the data-driven insights you need to succeed.

                                                              July 2025
                                                              Base Year: 2024
                                                              No Of Pages: 150
                                                              Price: $3800

                                                              Africa Chia Seeds Industry Market’s Drivers and Challenges: Strategic Overview 2025-2033

                                                              Discover the booming African chia seed market! Our analysis reveals a $13.87M market in 2025, projected to grow at a 2.10% CAGR through 2033. Explore key trends, segments (organic, hybrid, processed, omega-3 rich), applications (food & beverage, supplements, personal care), and leading companies. Get insights for investment and market entry.

                                                              July 2025
                                                              Base Year: 2024
                                                              No Of Pages: 180
                                                              Price: $4750

                                                              Strategic Trends in Asia-Pacific Seed Coating Materials Market Market 2025-2033

                                                              The Asia-Pacific seed coating materials market is booming, with an 8% CAGR. Discover key trends, leading companies (BASF, Bayer), and segment analysis (polymers, colorants) driving growth in this $XX million market. Explore the forecast to 2033.

                                                              July 2025
                                                              Base Year: 2024
                                                              No Of Pages: 150
                                                              Price: $3800

                                                              Comprehensive Review of UK Fruits and Vegetables Market Growth Potential

                                                              Discover the booming UK fruits and vegetables market! This in-depth analysis reveals a £31.58 billion market with a 2.97% CAGR (2025-2033), driven by health trends and major players like Tesco and Sainsbury's. Explore regional data, consumption patterns, and future growth potential.

                                                              July 2025
                                                              Base Year: 2024
                                                              No Of Pages: 180
                                                              Price: $3800

                                                              Malaysia Agrochemical Market Market’s Drivers and Challenges: Strategic Overview 2025-2033

                                                              Discover the booming Malaysian agrochemical market! This comprehensive analysis reveals a RM 679.59 million market in 2025, projected to grow at a 4.56% CAGR until 2033. Explore key drivers, trends, restraints, and leading companies shaping this dynamic sector. Learn about fertilizers, pesticides, and other agrochemical segments.

                                                              July 2025
                                                              Base Year: 2024
                                                              No Of Pages: 150
                                                              Price: $3800

                                                              Drivers of Change in Agricultural Surfactant Market Market 2025-2033

                                                              The global agricultural surfactant market is booming, projected to reach $3.56 billion by 2033 with a 6.70% CAGR. Driven by precision agriculture and sustainable farming, this market analysis explores key segments (anionic, nonionic, bio-based), top players (BASF, Clariant), and regional growth trends. Discover the future of agricultural surfactants.

                                                              July 2025
                                                              Base Year: 2024
                                                              No Of Pages: 234
                                                              Price: $4750

                                                              Cameroon Grains Industry Industry Analysis and Consumer Behavior

                                                              Discover the booming Cameroon grains industry! Explore market size, growth trends (4.80% CAGR), key players (Sodecoton, CDC, etc.), and challenges impacting cereals, pulses, and oilseeds in Cameroon from 2019-2033. Invest wisely in this promising African market.

                                                              July 2025
                                                              Base Year: 2024
                                                              No Of Pages: 180
                                                              Price: $3800

                                                              Analyzing Consumer Behavior in Agriculture Market in Tanzania Market

                                                              Discover the booming Tanzanian agriculture market! Projected to reach $17.44 billion in 2025, with a 5.63% CAGR, this report analyzes market size, key players (Syngenta, Rijk Zwaan), growth drivers, and future trends in Tanzania's agricultural sector. Explore market segments, including food crops and investment opportunities.

                                                              July 2025
                                                              Base Year: 2024
                                                              No Of Pages: 150
                                                              Price: $3800

                                                              Analyzing Consumer Behavior in Artificial Intelligence in Agriculture Industry Market

                                                              Discover the booming AI in Agriculture market! This comprehensive analysis reveals a 4.20% CAGR, key drivers, trends, restraints, and regional insights from 2019-2033. Learn about leading companies and applications like precision farming, drone analytics, and weather tracking. Explore market size projections and future growth potential.

                                                              July 2025
                                                              Base Year: 2024
                                                              No Of Pages: 150
                                                              Price: $4750

                                                              Exploring Forestry Machinery Market’s Market Size Dynamics 2025-2033

                                                              The global forestry machinery market is booming, projected to reach $15 billion by 2033, driven by rising timber demand and technological advancements. Explore market trends, key players (Deere, Komatsu, etc.), and regional growth in our comprehensive analysis.

                                                              July 2025
                                                              Base Year: 2024
                                                              No Of Pages: 150
                                                              Price: $4750

                                                              Nutrition Canary Seed Market Competitive Strategies: Trends and Forecasts 2025-2033

                                                              Discover the booming nutrition canary seed market! Explore key trends, growth drivers, and regional market share projections for 2025-2033. Learn about leading companies and the increasing demand driven by health-conscious consumers and the birdseed industry.

                                                              July 2025
                                                              Base Year: 2024
                                                              No Of Pages: 234
                                                              Price: $4750

                                                              Consumer Behavior and Cashews Market in South America Trends

                                                              Discover the booming South American cashew market! This comprehensive analysis reveals a $582.24 million market in 2025, projected to grow at a 5.20% CAGR through 2033. Explore key trends, drivers, and leading companies shaping this lucrative industry.

                                                              July 2025
                                                              Base Year: 2024
                                                              No Of Pages: 180
                                                              Price: $3800

                                                              Strategic Growth Drivers for Rye Industry Market

                                                              Discover the latest market analysis of the global rye industry, projecting a steady CAGR of 2.20% to 2033. Explore key drivers, restraints, and regional trends impacting the growth of rye in food, feed, and beverage applications. Learn about leading companies and future market opportunities.

                                                              July 2025
                                                              Base Year: 2024
                                                              No Of Pages: 234
                                                              Price: $4750

                                                              Comprehensive Overview of Water Soluble Fertilizer Industry Trends: 2025-2033

                                                              Discover the booming water-soluble fertilizer market! Explore its $XX million valuation in 2025, projected 3.80% CAGR growth to 2033, key drivers, trends, and regional insights. Learn about top players and lucrative segments like fertigation and horticultural crops.

                                                              July 2025
                                                              Base Year: 2024
                                                              No Of Pages: 150
                                                              Price: $3800

                                                              Asia-Pacific Agricultural Tractors Market Market Expansion: Growth Outlook 2025-2033

                                                              Discover the booming Asia-Pacific Agricultural Tractors market! Our analysis reveals a $15 billion USD market in 2025, projected to grow at a 6% CAGR through 2033. Explore market size, growth trends, and regional breakdowns for India, China, and other key countries. Learn how technological advancements and government initiatives are shaping the future of farming.

                                                              July 2025
                                                              Base Year: 2024
                                                              No Of Pages: 197
                                                              Price: $3800