
Key Insights
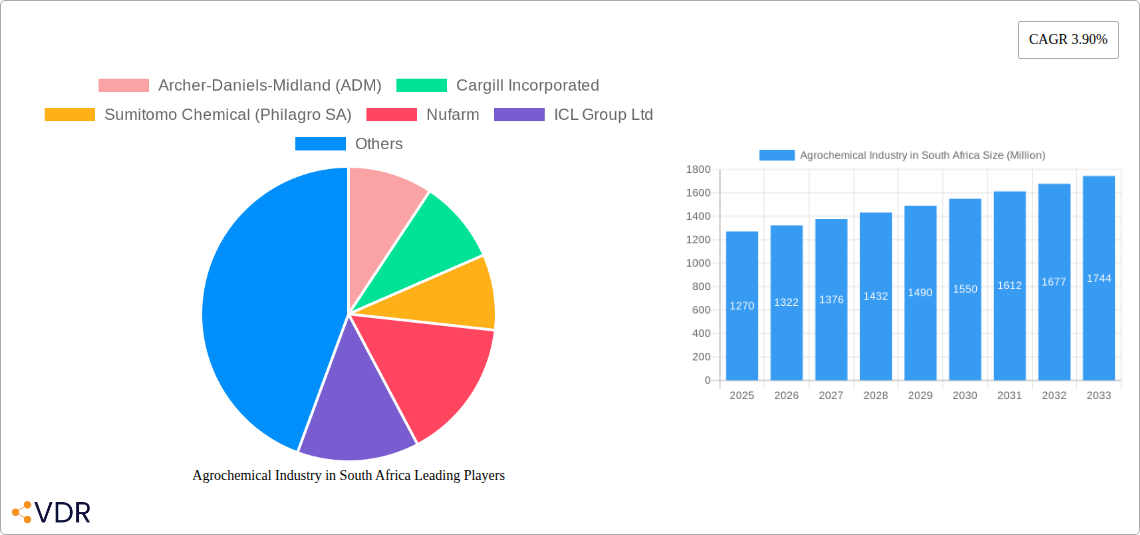
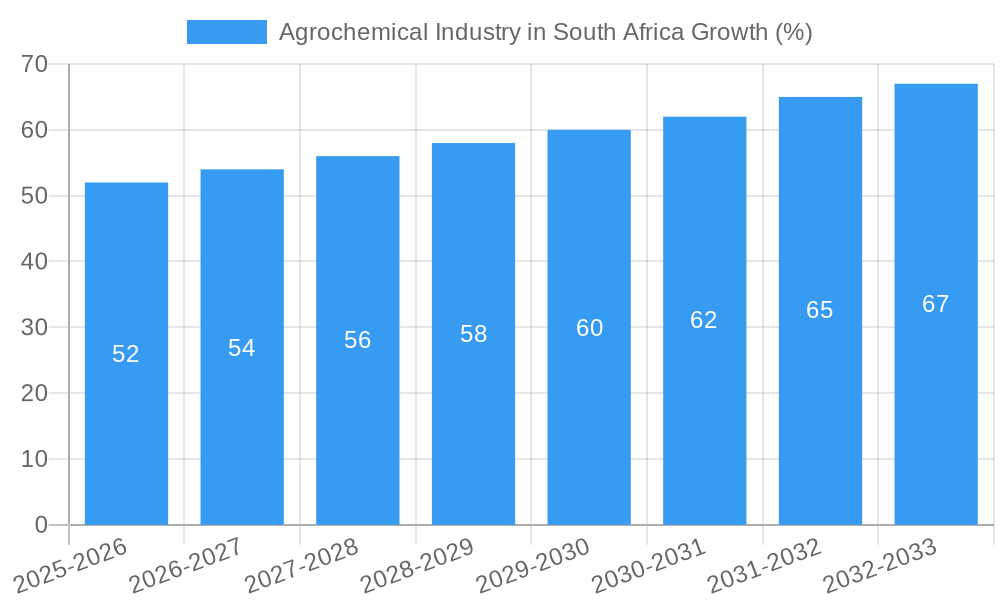
The South African agrochemical market, valued at approximately $1.27 billion in 2025, is projected to experience steady growth, driven by the increasing demand for food security and the expansion of agricultural activities. A Compound Annual Growth Rate (CAGR) of 3.90% from 2025 to 2033 indicates a promising outlook for the sector. Key drivers include rising agricultural yields, government initiatives promoting sustainable farming practices, and the growing adoption of advanced technologies like precision agriculture. The market segmentation reveals significant contributions from fertilizers and pesticides, with crop-based applications dominating. However, the growth may face challenges from factors such as climate change variability, impacting crop yields and necessitating more resilient solutions. Furthermore, stringent regulations concerning pesticide usage and environmental concerns could pose restraints. Growth will likely be fueled by investments in research and development of innovative, environmentally friendly agrochemicals that cater to the specific needs of South African agriculture, including drought-resistant crop varieties and improved pest control measures. The competitive landscape includes both international giants like BASF and Syngenta, and local players capitalizing on specific market needs. The continued expansion of the fruit and vegetable sector in South Africa will be a particularly important driver for market growth in the coming years, as well as the growing demand for turf and ornamental grass care products.
The South African agrochemical market presents a compelling investment opportunity due to the favorable conditions of strong agricultural production and the need for efficient and sustainable practices. However, businesses must adapt to regulatory changes, environmental concerns, and the need for technologically advanced solutions. Significant opportunities lie in developing specialized products tailored to the region’s unique climate and agricultural challenges, including drought tolerance and pest-specific formulations. Strategic partnerships with local farmers and government initiatives focused on sustainable agriculture will be crucial for achieving long-term growth and profitability within the South African agrochemical market. Careful consideration of the evolving regulatory landscape and environmental sensitivities will be critical for companies seeking to operate successfully within this dynamic market.
Agrochemical Industry in South Africa: A Comprehensive Market Report (2019-2033)
This in-depth report provides a comprehensive analysis of the South African agrochemical market, covering its dynamics, growth trends, key players, and future outlook. The study period spans from 2019 to 2033, with 2025 serving as both the base and estimated year. The report leverages extensive data and expert analysis to offer valuable insights for industry professionals, investors, and stakeholders. It delves into the parent market of agricultural inputs and the child markets of specific agrochemical types and applications, providing a granular view of this dynamic sector.
Agrochemical Industry in South Africa Market Dynamics & Structure
This section analyzes the South African agrochemical market's structure, focusing on market concentration, technological innovation, regulatory landscape, competitive substitutes, end-user demographics, and merger & acquisition (M&A) activity. The market is characterized by a mix of multinational corporations and local players, resulting in a moderately concentrated landscape.
- Market Concentration: The top 5 players hold approximately xx% market share in 2025, with a forecast of xx% by 2033.
- Technological Innovation: Precision agriculture and biotechnology are driving innovation, although high R&D costs pose a barrier for smaller players.
- Regulatory Framework: South Africa's regulatory environment is evolving, with increasing emphasis on environmental sustainability and product registration.
- Competitive Substitutes: Biopesticides and biofertilizers are emerging as competitive substitutes, driven by increasing demand for environmentally friendly solutions.
- End-User Demographics: The market is predominantly driven by commercial farmers, with a growing contribution from smallholder farmers.
- M&A Trends: The past five years have witnessed xx M&A deals in the South African agrochemical sector, primarily driven by consolidation and expansion strategies. xx% of these deals involved international players acquiring local companies.
Agrochemical Industry in South Africa Growth Trends & Insights
The South African agrochemical market has experienced steady growth in recent years, driven by factors including increasing agricultural production, rising demand for high-yield crops, and supportive government policies. This section analyzes market size evolution, adoption rates of new technologies, and shifts in consumer behavior. The market size reached xx million in 2024, and is projected to reach xx million by 2033, exhibiting a Compound Annual Growth Rate (CAGR) of xx% during the forecast period. This growth is attributed to increasing adoption of modern farming techniques, coupled with favorable climatic conditions in certain regions. Market penetration of advanced agrochemicals remains relatively low, presenting significant opportunities for growth.
Dominant Regions, Countries, or Segments in Agrochemical Industry in South Africa
The South African agrochemical market is geographically diverse, with significant variations in agricultural practices and crop production across different regions. This section identifies leading regions, countries, or segments within the broader market, focusing on the key drivers of growth.
- Dominant Segments: Fertilizers (xx million in 2025, xx million in 2033) and pesticides (xx million in 2025, xx million in 2033) constitute the largest segments, driven by high demand for crop improvement and pest control.
- Leading Regions: The major crop-producing regions of [Specific Regions in South Africa e.g., Mpumalanga, Limpopo] contribute significantly to overall market growth.
- Key Growth Drivers:
- Government initiatives to support agricultural development.
- Increasing investment in agricultural infrastructure.
- Favorable climatic conditions in certain areas.
- Rising consumer demand for high-quality agricultural products.
Agrochemical Industry in South Africa Product Landscape
The South African agrochemical market offers a diverse range of products, including fertilizers, pesticides, adjuvants, and plant growth regulators. Recent innovations focus on developing sustainable and environmentally friendly solutions, including biopesticides and slow-release fertilizers. These products offer enhanced efficacy, reduced environmental impact, and improved crop yields, contributing to a growing market for advanced agrochemicals.
Key Drivers, Barriers & Challenges in Agrochemical Industry in South Africa
Key Drivers:
- Growing demand for food security and increasing agricultural production.
- Technological advancements leading to improved crop yields and efficiency.
- Government support and investment in the agricultural sector.
Key Challenges:
- Climate change and its impact on agricultural production.
- Stringent regulatory requirements and product registration processes.
- High input costs and price volatility of raw materials.
- Competition from both domestic and international players.
Emerging Opportunities in Agrochemical Industry in South Africa
Emerging opportunities in the South African agrochemical market include:
- Growing demand for biopesticides and biofertilizers.
- Expansion into precision agriculture and digital farming technologies.
- Development of customized solutions for specific crops and regions.
- Focus on sustainable and environmentally friendly products.
Growth Accelerators in the Agrochemical Industry in South Africa Industry
Long-term growth in the South African agrochemical market will be fueled by technological innovation, strategic partnerships between agrochemical companies and farmers, and expansion into new markets. The adoption of precision agriculture techniques, improved distribution networks, and government support for sustainable agriculture will further accelerate market growth.
Key Players Shaping the Agrochemical Industry in South Africa Market
- Archer-Daniels-Midland (ADM)
- Cargill Incorporated
- Sumitomo Chemical (Philagro SA)
- Nufarm
- ICL Group Ltd
- UPL Limited
- BASF SE
- FMC Corporation
- Sociedad Química y Minera de Chile (SQM)
- Belaruskali
- Sasol Limited
- K+S AG
- ADAMA Ltd
- Uralkal
- CF Industries Holdings
- OCP Group
- Land O' Lakes (Villa Crop Protection (Pty) Ltd)
- Yara International ASA
- Syngenta AG
- Nutrien Ltd
- Corteva Agriscience
- Bayer CropScience AG
Notable Milestones in Agrochemical Industry in South Africa Sector
- 2021 - Increased investment by multinational companies in sustainable agrochemical production facilities.
- 2022 - Launch of new biopesticide products by local firms, responding to growing demand.
- 2023 - New regulatory guidelines enacted to promote environmentally friendly agricultural practices.
In-Depth Agrochemical Industry in South Africa Market Outlook
The South African agrochemical market is poised for continued growth, driven by advancements in precision agriculture, growing demand for sustainable solutions, and supportive government policies. Strategic partnerships, innovative product development, and market expansion into under-served areas will play a crucial role in shaping the future of this dynamic sector. The market offers significant opportunities for both established players and new entrants, particularly those focused on sustainable and innovative agrochemical solutions.
Agrochemical Industry in South Africa Segmentation
- 1. Production Analysis
- 2. Consumption Analysis
- 3. Import Market Analysis (Value & Volume)
- 4. Export Market Analysis (Value & Volume)
- 5. Price Trend Analysis
Agrochemical Industry in South Africa Segmentation By Geography
-
1. North America
- 1.1. United States
- 1.2. Canada
- 1.3. Mexico
-
2. South America
- 2.1. Brazil
- 2.2. Argentina
- 2.3. Rest of South America
-
3. Europe
- 3.1. United Kingdom
- 3.2. Germany
- 3.3. France
- 3.4. Italy
- 3.5. Spain
- 3.6. Russia
- 3.7. Benelux
- 3.8. Nordics
- 3.9. Rest of Europe
-
4. Middle East & Africa
- 4.1. Turkey
- 4.2. Israel
- 4.3. GCC
- 4.4. North Africa
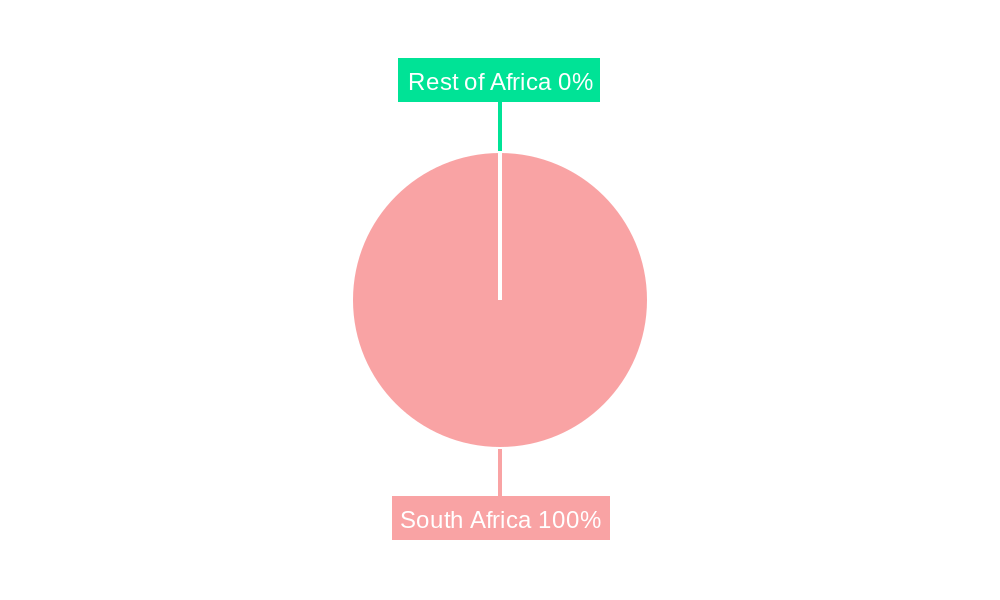
- 4.5. South Africa
- 4.6. Rest of Middle East & Africa
-
5. Asia Pacific
- 5.1. China
- 5.2. India
- 5.3. Japan
- 5.4. South Korea
- 5.5. ASEAN
- 5.6. Oceania
- 5.7. Rest of Asia Pacific
Agrochemical Industry in South Africa REPORT HIGHLIGHTS
| Aspects | Details |
|---|---|
| Study Period | 2019-2033 |
| Base Year | 2024 |
| Estimated Year | 2025 |
| Forecast Period | 2025-2033 |
| Historical Period | 2019-2024 |
| Growth Rate | CAGR of 3.90% from 2019-2033 |
| Segmentation |
|
Table of Contents
- 1. Introduction
- 1.1. Research Scope
- 1.2. Market Segmentation
- 1.3. Research Methodology
- 1.4. Definitions and Assumptions
- 2. Executive Summary
- 2.1. Introduction
- 3. Market Dynamics
- 3.1. Introduction
- 3.2. Market Drivers
- 3.2.1. Adoption of Organic and Eco-friendly Farming Practices; Declining Area of Arable Land and Rising Food Security Concerns
- 3.3. Market Restrains
- 3.3.1. High Demand for Conventional and Synthetic Products; Lack of Awareness and Other Factors Limiting the Adoption of Agricultural Inoculants
- 3.4. Market Trends
- 3.4.1. Increasing Adoption of Bio-based Agrochemicals
- 4. Market Factor Analysis
- 4.1. Porters Five Forces
- 4.2. Supply/Value Chain
- 4.3. PESTEL analysis
- 4.4. Market Entropy
- 4.5. Patent/Trademark Analysis
- 5. Global Agrochemical Industry in South Africa Analysis, Insights and Forecast, 2019-2031
- 5.1. Market Analysis, Insights and Forecast - by Production Analysis
- 5.2. Market Analysis, Insights and Forecast - by Consumption Analysis
- 5.3. Market Analysis, Insights and Forecast - by Import Market Analysis (Value & Volume)
- 5.4. Market Analysis, Insights and Forecast - by Export Market Analysis (Value & Volume)
- 5.5. Market Analysis, Insights and Forecast - by Price Trend Analysis
- 5.6. Market Analysis, Insights and Forecast - by Region
- 5.6.1. North America
- 5.6.2. South America
- 5.6.3. Europe
- 5.6.4. Middle East & Africa
- 5.6.5. Asia Pacific
- 5.1. Market Analysis, Insights and Forecast - by Production Analysis
- 6. North America Agrochemical Industry in South Africa Analysis, Insights and Forecast, 2019-2031
- 6.1. Market Analysis, Insights and Forecast - by Production Analysis
- 6.2. Market Analysis, Insights and Forecast - by Consumption Analysis
- 6.3. Market Analysis, Insights and Forecast - by Import Market Analysis (Value & Volume)
- 6.4. Market Analysis, Insights and Forecast - by Export Market Analysis (Value & Volume)
- 6.5. Market Analysis, Insights and Forecast - by Price Trend Analysis
- 6.1. Market Analysis, Insights and Forecast - by Production Analysis
- 7. South America Agrochemical Industry in South Africa Analysis, Insights and Forecast, 2019-2031
- 7.1. Market Analysis, Insights and Forecast - by Production Analysis
- 7.2. Market Analysis, Insights and Forecast - by Consumption Analysis
- 7.3. Market Analysis, Insights and Forecast - by Import Market Analysis (Value & Volume)
- 7.4. Market Analysis, Insights and Forecast - by Export Market Analysis (Value & Volume)
- 7.5. Market Analysis, Insights and Forecast - by Price Trend Analysis
- 7.1. Market Analysis, Insights and Forecast - by Production Analysis
- 8. Europe Agrochemical Industry in South Africa Analysis, Insights and Forecast, 2019-2031
- 8.1. Market Analysis, Insights and Forecast - by Production Analysis
- 8.2. Market Analysis, Insights and Forecast - by Consumption Analysis
- 8.3. Market Analysis, Insights and Forecast - by Import Market Analysis (Value & Volume)
- 8.4. Market Analysis, Insights and Forecast - by Export Market Analysis (Value & Volume)
- 8.5. Market Analysis, Insights and Forecast - by Price Trend Analysis
- 8.1. Market Analysis, Insights and Forecast - by Production Analysis
- 9. Middle East & Africa Agrochemical Industry in South Africa Analysis, Insights and Forecast, 2019-2031
- 9.1. Market Analysis, Insights and Forecast - by Production Analysis
- 9.2. Market Analysis, Insights and Forecast - by Consumption Analysis
- 9.3. Market Analysis, Insights and Forecast - by Import Market Analysis (Value & Volume)
- 9.4. Market Analysis, Insights and Forecast - by Export Market Analysis (Value & Volume)
- 9.5. Market Analysis, Insights and Forecast - by Price Trend Analysis
- 9.1. Market Analysis, Insights and Forecast - by Production Analysis
- 10. Asia Pacific Agrochemical Industry in South Africa Analysis, Insights and Forecast, 2019-2031
- 10.1. Market Analysis, Insights and Forecast - by Production Analysis
- 10.2. Market Analysis, Insights and Forecast - by Consumption Analysis
- 10.3. Market Analysis, Insights and Forecast - by Import Market Analysis (Value & Volume)
- 10.4. Market Analysis, Insights and Forecast - by Export Market Analysis (Value & Volume)
- 10.5. Market Analysis, Insights and Forecast - by Price Trend Analysis
- 10.1. Market Analysis, Insights and Forecast - by Production Analysis
- 11. South Africa Agrochemical Industry in South Africa Analysis, Insights and Forecast, 2019-2031
- 12. Sudan Agrochemical Industry in South Africa Analysis, Insights and Forecast, 2019-2031
- 13. Uganda Agrochemical Industry in South Africa Analysis, Insights and Forecast, 2019-2031
- 14. Tanzania Agrochemical Industry in South Africa Analysis, Insights and Forecast, 2019-2031
- 15. Kenya Agrochemical Industry in South Africa Analysis, Insights and Forecast, 2019-2031
- 16. Rest of Africa Agrochemical Industry in South Africa Analysis, Insights and Forecast, 2019-2031
- 17. Competitive Analysis
- 17.1. Global Market Share Analysis 2024
- 17.2. Company Profiles
- 17.2.1 Archer-Daniels-Midland (ADM)
- 17.2.1.1. Overview
- 17.2.1.2. Products
- 17.2.1.3. SWOT Analysis
- 17.2.1.4. Recent Developments
- 17.2.1.5. Financials (Based on Availability)
- 17.2.2 Cargill Incorporated
- 17.2.2.1. Overview
- 17.2.2.2. Products
- 17.2.2.3. SWOT Analysis
- 17.2.2.4. Recent Developments
- 17.2.2.5. Financials (Based on Availability)
- 17.2.3 Sumitomo Chemical (Philagro SA)
- 17.2.3.1. Overview
- 17.2.3.2. Products
- 17.2.3.3. SWOT Analysis
- 17.2.3.4. Recent Developments
- 17.2.3.5. Financials (Based on Availability)
- 17.2.4 Nufarm
- 17.2.4.1. Overview
- 17.2.4.2. Products
- 17.2.4.3. SWOT Analysis
- 17.2.4.4. Recent Developments
- 17.2.4.5. Financials (Based on Availability)
- 17.2.5 ICL Group Ltd
- 17.2.5.1. Overview
- 17.2.5.2. Products
- 17.2.5.3. SWOT Analysis
- 17.2.5.4. Recent Developments
- 17.2.5.5. Financials (Based on Availability)
- 17.2.6 UPL Limited
- 17.2.6.1. Overview
- 17.2.6.2. Products
- 17.2.6.3. SWOT Analysis
- 17.2.6.4. Recent Developments
- 17.2.6.5. Financials (Based on Availability)
- 17.2.7 BASF SE
- 17.2.7.1. Overview
- 17.2.7.2. Products
- 17.2.7.3. SWOT Analysis
- 17.2.7.4. Recent Developments
- 17.2.7.5. Financials (Based on Availability)
- 17.2.8 FMC Corporation
- 17.2.8.1. Overview
- 17.2.8.2. Products
- 17.2.8.3. SWOT Analysis
- 17.2.8.4. Recent Developments
- 17.2.8.5. Financials (Based on Availability)
- 17.2.9 Sociedad Química y Minera de Chile (SQM)
- 17.2.9.1. Overview
- 17.2.9.2. Products
- 17.2.9.3. SWOT Analysis
- 17.2.9.4. Recent Developments
- 17.2.9.5. Financials (Based on Availability)
- 17.2.10 Belaruskali
- 17.2.10.1. Overview
- 17.2.10.2. Products
- 17.2.10.3. SWOT Analysis
- 17.2.10.4. Recent Developments
- 17.2.10.5. Financials (Based on Availability)
- 17.2.11 Sasol Limited
- 17.2.11.1. Overview
- 17.2.11.2. Products
- 17.2.11.3. SWOT Analysis
- 17.2.11.4. Recent Developments
- 17.2.11.5. Financials (Based on Availability)
- 17.2.12 K+S AG
- 17.2.12.1. Overview
- 17.2.12.2. Products
- 17.2.12.3. SWOT Analysis
- 17.2.12.4. Recent Developments
- 17.2.12.5. Financials (Based on Availability)
- 17.2.13 ADAMA Ltd
- 17.2.13.1. Overview
- 17.2.13.2. Products
- 17.2.13.3. SWOT Analysis
- 17.2.13.4. Recent Developments
- 17.2.13.5. Financials (Based on Availability)
- 17.2.14 Uralkal
- 17.2.14.1. Overview
- 17.2.14.2. Products
- 17.2.14.3. SWOT Analysis
- 17.2.14.4. Recent Developments
- 17.2.14.5. Financials (Based on Availability)
- 17.2.15 CF Industries Holdings
- 17.2.15.1. Overview
- 17.2.15.2. Products
- 17.2.15.3. SWOT Analysis
- 17.2.15.4. Recent Developments
- 17.2.15.5. Financials (Based on Availability)
- 17.2.16 OCP Group
- 17.2.16.1. Overview
- 17.2.16.2. Products
- 17.2.16.3. SWOT Analysis
- 17.2.16.4. Recent Developments
- 17.2.16.5. Financials (Based on Availability)
- 17.2.17 Land O' Lakes (Villa Crop Protection (Pty) Ltd
- 17.2.17.1. Overview
- 17.2.17.2. Products
- 17.2.17.3. SWOT Analysis
- 17.2.17.4. Recent Developments
- 17.2.17.5. Financials (Based on Availability)
- 17.2.18 Yara International ASA
- 17.2.18.1. Overview
- 17.2.18.2. Products
- 17.2.18.3. SWOT Analysis
- 17.2.18.4. Recent Developments
- 17.2.18.5. Financials (Based on Availability)
- 17.2.19 Syngenta AG
- 17.2.19.1. Overview
- 17.2.19.2. Products
- 17.2.19.3. SWOT Analysis
- 17.2.19.4. Recent Developments
- 17.2.19.5. Financials (Based on Availability)
- 17.2.20 Nutrien Ltd
- 17.2.20.1. Overview
- 17.2.20.2. Products
- 17.2.20.3. SWOT Analysis
- 17.2.20.4. Recent Developments
- 17.2.20.5. Financials (Based on Availability)
- 17.2.21 Corteva Agriscience
- 17.2.21.1. Overview
- 17.2.21.2. Products
- 17.2.21.3. SWOT Analysis
- 17.2.21.4. Recent Developments
- 17.2.21.5. Financials (Based on Availability)
- 17.2.22 Bayer CropScience AG
- 17.2.22.1. Overview
- 17.2.22.2. Products
- 17.2.22.3. SWOT Analysis
- 17.2.22.4. Recent Developments
- 17.2.22.5. Financials (Based on Availability)
- 17.2.1 Archer-Daniels-Midland (ADM)
List of Figures
- Figure 1: Global Agrochemical Industry in South Africa Revenue Breakdown (Million, %) by Region 2024 & 2032
- Figure 2: Africa Agrochemical Industry in South Africa Revenue (Million), by Country 2024 & 2032
- Figure 3: Africa Agrochemical Industry in South Africa Revenue Share (%), by Country 2024 & 2032
- Figure 4: North America Agrochemical Industry in South Africa Revenue (Million), by Production Analysis 2024 & 2032
- Figure 5: North America Agrochemical Industry in South Africa Revenue Share (%), by Production Analysis 2024 & 2032
- Figure 6: North America Agrochemical Industry in South Africa Revenue (Million), by Consumption Analysis 2024 & 2032
- Figure 7: North America Agrochemical Industry in South Africa Revenue Share (%), by Consumption Analysis 2024 & 2032
- Figure 8: North America Agrochemical Industry in South Africa Revenue (Million), by Import Market Analysis (Value & Volume) 2024 & 2032
- Figure 9: North America Agrochemical Industry in South Africa Revenue Share (%), by Import Market Analysis (Value & Volume) 2024 & 2032
- Figure 10: North America Agrochemical Industry in South Africa Revenue (Million), by Export Market Analysis (Value & Volume) 2024 & 2032
- Figure 11: North America Agrochemical Industry in South Africa Revenue Share (%), by Export Market Analysis (Value & Volume) 2024 & 2032
- Figure 12: North America Agrochemical Industry in South Africa Revenue (Million), by Price Trend Analysis 2024 & 2032
- Figure 13: North America Agrochemical Industry in South Africa Revenue Share (%), by Price Trend Analysis 2024 & 2032
- Figure 14: North America Agrochemical Industry in South Africa Revenue (Million), by Country 2024 & 2032
- Figure 15: North America Agrochemical Industry in South Africa Revenue Share (%), by Country 2024 & 2032
- Figure 16: South America Agrochemical Industry in South Africa Revenue (Million), by Production Analysis 2024 & 2032
- Figure 17: South America Agrochemical Industry in South Africa Revenue Share (%), by Production Analysis 2024 & 2032
- Figure 18: South America Agrochemical Industry in South Africa Revenue (Million), by Consumption Analysis 2024 & 2032
- Figure 19: South America Agrochemical Industry in South Africa Revenue Share (%), by Consumption Analysis 2024 & 2032
- Figure 20: South America Agrochemical Industry in South Africa Revenue (Million), by Import Market Analysis (Value & Volume) 2024 & 2032
- Figure 21: South America Agrochemical Industry in South Africa Revenue Share (%), by Import Market Analysis (Value & Volume) 2024 & 2032
- Figure 22: South America Agrochemical Industry in South Africa Revenue (Million), by Export Market Analysis (Value & Volume) 2024 & 2032
- Figure 23: South America Agrochemical Industry in South Africa Revenue Share (%), by Export Market Analysis (Value & Volume) 2024 & 2032
- Figure 24: South America Agrochemical Industry in South Africa Revenue (Million), by Price Trend Analysis 2024 & 2032
- Figure 25: South America Agrochemical Industry in South Africa Revenue Share (%), by Price Trend Analysis 2024 & 2032
- Figure 26: South America Agrochemical Industry in South Africa Revenue (Million), by Country 2024 & 2032
- Figure 27: South America Agrochemical Industry in South Africa Revenue Share (%), by Country 2024 & 2032
- Figure 28: Europe Agrochemical Industry in South Africa Revenue (Million), by Production Analysis 2024 & 2032
- Figure 29: Europe Agrochemical Industry in South Africa Revenue Share (%), by Production Analysis 2024 & 2032
- Figure 30: Europe Agrochemical Industry in South Africa Revenue (Million), by Consumption Analysis 2024 & 2032
- Figure 31: Europe Agrochemical Industry in South Africa Revenue Share (%), by Consumption Analysis 2024 & 2032
- Figure 32: Europe Agrochemical Industry in South Africa Revenue (Million), by Import Market Analysis (Value & Volume) 2024 & 2032
- Figure 33: Europe Agrochemical Industry in South Africa Revenue Share (%), by Import Market Analysis (Value & Volume) 2024 & 2032
- Figure 34: Europe Agrochemical Industry in South Africa Revenue (Million), by Export Market Analysis (Value & Volume) 2024 & 2032
- Figure 35: Europe Agrochemical Industry in South Africa Revenue Share (%), by Export Market Analysis (Value & Volume) 2024 & 2032
- Figure 36: Europe Agrochemical Industry in South Africa Revenue (Million), by Price Trend Analysis 2024 & 2032
- Figure 37: Europe Agrochemical Industry in South Africa Revenue Share (%), by Price Trend Analysis 2024 & 2032
- Figure 38: Europe Agrochemical Industry in South Africa Revenue (Million), by Country 2024 & 2032
- Figure 39: Europe Agrochemical Industry in South Africa Revenue Share (%), by Country 2024 & 2032
- Figure 40: Middle East & Africa Agrochemical Industry in South Africa Revenue (Million), by Production Analysis 2024 & 2032
- Figure 41: Middle East & Africa Agrochemical Industry in South Africa Revenue Share (%), by Production Analysis 2024 & 2032
- Figure 42: Middle East & Africa Agrochemical Industry in South Africa Revenue (Million), by Consumption Analysis 2024 & 2032
- Figure 43: Middle East & Africa Agrochemical Industry in South Africa Revenue Share (%), by Consumption Analysis 2024 & 2032
- Figure 44: Middle East & Africa Agrochemical Industry in South Africa Revenue (Million), by Import Market Analysis (Value & Volume) 2024 & 2032
- Figure 45: Middle East & Africa Agrochemical Industry in South Africa Revenue Share (%), by Import Market Analysis (Value & Volume) 2024 & 2032
- Figure 46: Middle East & Africa Agrochemical Industry in South Africa Revenue (Million), by Export Market Analysis (Value & Volume) 2024 & 2032
- Figure 47: Middle East & Africa Agrochemical Industry in South Africa Revenue Share (%), by Export Market Analysis (Value & Volume) 2024 & 2032
- Figure 48: Middle East & Africa Agrochemical Industry in South Africa Revenue (Million), by Price Trend Analysis 2024 & 2032
- Figure 49: Middle East & Africa Agrochemical Industry in South Africa Revenue Share (%), by Price Trend Analysis 2024 & 2032
- Figure 50: Middle East & Africa Agrochemical Industry in South Africa Revenue (Million), by Country 2024 & 2032
- Figure 51: Middle East & Africa Agrochemical Industry in South Africa Revenue Share (%), by Country 2024 & 2032
- Figure 52: Asia Pacific Agrochemical Industry in South Africa Revenue (Million), by Production Analysis 2024 & 2032
- Figure 53: Asia Pacific Agrochemical Industry in South Africa Revenue Share (%), by Production Analysis 2024 & 2032
- Figure 54: Asia Pacific Agrochemical Industry in South Africa Revenue (Million), by Consumption Analysis 2024 & 2032
- Figure 55: Asia Pacific Agrochemical Industry in South Africa Revenue Share (%), by Consumption Analysis 2024 & 2032
- Figure 56: Asia Pacific Agrochemical Industry in South Africa Revenue (Million), by Import Market Analysis (Value & Volume) 2024 & 2032
- Figure 57: Asia Pacific Agrochemical Industry in South Africa Revenue Share (%), by Import Market Analysis (Value & Volume) 2024 & 2032
- Figure 58: Asia Pacific Agrochemical Industry in South Africa Revenue (Million), by Export Market Analysis (Value & Volume) 2024 & 2032
- Figure 59: Asia Pacific Agrochemical Industry in South Africa Revenue Share (%), by Export Market Analysis (Value & Volume) 2024 & 2032
- Figure 60: Asia Pacific Agrochemical Industry in South Africa Revenue (Million), by Price Trend Analysis 2024 & 2032
- Figure 61: Asia Pacific Agrochemical Industry in South Africa Revenue Share (%), by Price Trend Analysis 2024 & 2032
- Figure 62: Asia Pacific Agrochemical Industry in South Africa Revenue (Million), by Country 2024 & 2032
- Figure 63: Asia Pacific Agrochemical Industry in South Africa Revenue Share (%), by Country 2024 & 2032
List of Tables
- Table 1: Global Agrochemical Industry in South Africa Revenue Million Forecast, by Region 2019 & 2032
- Table 2: Global Agrochemical Industry in South Africa Revenue Million Forecast, by Production Analysis 2019 & 2032
- Table 3: Global Agrochemical Industry in South Africa Revenue Million Forecast, by Consumption Analysis 2019 & 2032
- Table 4: Global Agrochemical Industry in South Africa Revenue Million Forecast, by Import Market Analysis (Value & Volume) 2019 & 2032
- Table 5: Global Agrochemical Industry in South Africa Revenue Million Forecast, by Export Market Analysis (Value & Volume) 2019 & 2032
- Table 6: Global Agrochemical Industry in South Africa Revenue Million Forecast, by Price Trend Analysis 2019 & 2032
- Table 7: Global Agrochemical Industry in South Africa Revenue Million Forecast, by Region 2019 & 2032
- Table 8: Global Agrochemical Industry in South Africa Revenue Million Forecast, by Country 2019 & 2032
- Table 9: South Africa Agrochemical Industry in South Africa Revenue (Million) Forecast, by Application 2019 & 2032
- Table 10: Sudan Agrochemical Industry in South Africa Revenue (Million) Forecast, by Application 2019 & 2032
- Table 11: Uganda Agrochemical Industry in South Africa Revenue (Million) Forecast, by Application 2019 & 2032
- Table 12: Tanzania Agrochemical Industry in South Africa Revenue (Million) Forecast, by Application 2019 & 2032
- Table 13: Kenya Agrochemical Industry in South Africa Revenue (Million) Forecast, by Application 2019 & 2032
- Table 14: Rest of Africa Agrochemical Industry in South Africa Revenue (Million) Forecast, by Application 2019 & 2032
- Table 15: Global Agrochemical Industry in South Africa Revenue Million Forecast, by Production Analysis 2019 & 2032
- Table 16: Global Agrochemical Industry in South Africa Revenue Million Forecast, by Consumption Analysis 2019 & 2032
- Table 17: Global Agrochemical Industry in South Africa Revenue Million Forecast, by Import Market Analysis (Value & Volume) 2019 & 2032
- Table 18: Global Agrochemical Industry in South Africa Revenue Million Forecast, by Export Market Analysis (Value & Volume) 2019 & 2032
- Table 19: Global Agrochemical Industry in South Africa Revenue Million Forecast, by Price Trend Analysis 2019 & 2032
- Table 20: Global Agrochemical Industry in South Africa Revenue Million Forecast, by Country 2019 & 2032
- Table 21: United States Agrochemical Industry in South Africa Revenue (Million) Forecast, by Application 2019 & 2032
- Table 22: Canada Agrochemical Industry in South Africa Revenue (Million) Forecast, by Application 2019 & 2032
- Table 23: Mexico Agrochemical Industry in South Africa Revenue (Million) Forecast, by Application 2019 & 2032
- Table 24: Global Agrochemical Industry in South Africa Revenue Million Forecast, by Production Analysis 2019 & 2032
- Table 25: Global Agrochemical Industry in South Africa Revenue Million Forecast, by Consumption Analysis 2019 & 2032
- Table 26: Global Agrochemical Industry in South Africa Revenue Million Forecast, by Import Market Analysis (Value & Volume) 2019 & 2032
- Table 27: Global Agrochemical Industry in South Africa Revenue Million Forecast, by Export Market Analysis (Value & Volume) 2019 & 2032
- Table 28: Global Agrochemical Industry in South Africa Revenue Million Forecast, by Price Trend Analysis 2019 & 2032
- Table 29: Global Agrochemical Industry in South Africa Revenue Million Forecast, by Country 2019 & 2032
- Table 30: Brazil Agrochemical Industry in South Africa Revenue (Million) Forecast, by Application 2019 & 2032
- Table 31: Argentina Agrochemical Industry in South Africa Revenue (Million) Forecast, by Application 2019 & 2032
- Table 32: Rest of South America Agrochemical Industry in South Africa Revenue (Million) Forecast, by Application 2019 & 2032
- Table 33: Global Agrochemical Industry in South Africa Revenue Million Forecast, by Production Analysis 2019 & 2032
- Table 34: Global Agrochemical Industry in South Africa Revenue Million Forecast, by Consumption Analysis 2019 & 2032
- Table 35: Global Agrochemical Industry in South Africa Revenue Million Forecast, by Import Market Analysis (Value & Volume) 2019 & 2032
- Table 36: Global Agrochemical Industry in South Africa Revenue Million Forecast, by Export Market Analysis (Value & Volume) 2019 & 2032
- Table 37: Global Agrochemical Industry in South Africa Revenue Million Forecast, by Price Trend Analysis 2019 & 2032
- Table 38: Global Agrochemical Industry in South Africa Revenue Million Forecast, by Country 2019 & 2032
- Table 39: United Kingdom Agrochemical Industry in South Africa Revenue (Million) Forecast, by Application 2019 & 2032
- Table 40: Germany Agrochemical Industry in South Africa Revenue (Million) Forecast, by Application 2019 & 2032
- Table 41: France Agrochemical Industry in South Africa Revenue (Million) Forecast, by Application 2019 & 2032
- Table 42: Italy Agrochemical Industry in South Africa Revenue (Million) Forecast, by Application 2019 & 2032
- Table 43: Spain Agrochemical Industry in South Africa Revenue (Million) Forecast, by Application 2019 & 2032
- Table 44: Russia Agrochemical Industry in South Africa Revenue (Million) Forecast, by Application 2019 & 2032
- Table 45: Benelux Agrochemical Industry in South Africa Revenue (Million) Forecast, by Application 2019 & 2032
- Table 46: Nordics Agrochemical Industry in South Africa Revenue (Million) Forecast, by Application 2019 & 2032
- Table 47: Rest of Europe Agrochemical Industry in South Africa Revenue (Million) Forecast, by Application 2019 & 2032
- Table 48: Global Agrochemical Industry in South Africa Revenue Million Forecast, by Production Analysis 2019 & 2032
- Table 49: Global Agrochemical Industry in South Africa Revenue Million Forecast, by Consumption Analysis 2019 & 2032
- Table 50: Global Agrochemical Industry in South Africa Revenue Million Forecast, by Import Market Analysis (Value & Volume) 2019 & 2032
- Table 51: Global Agrochemical Industry in South Africa Revenue Million Forecast, by Export Market Analysis (Value & Volume) 2019 & 2032
- Table 52: Global Agrochemical Industry in South Africa Revenue Million Forecast, by Price Trend Analysis 2019 & 2032
- Table 53: Global Agrochemical Industry in South Africa Revenue Million Forecast, by Country 2019 & 2032
- Table 54: Turkey Agrochemical Industry in South Africa Revenue (Million) Forecast, by Application 2019 & 2032
- Table 55: Israel Agrochemical Industry in South Africa Revenue (Million) Forecast, by Application 2019 & 2032
- Table 56: GCC Agrochemical Industry in South Africa Revenue (Million) Forecast, by Application 2019 & 2032
- Table 57: North Africa Agrochemical Industry in South Africa Revenue (Million) Forecast, by Application 2019 & 2032
- Table 58: South Africa Agrochemical Industry in South Africa Revenue (Million) Forecast, by Application 2019 & 2032
- Table 59: Rest of Middle East & Africa Agrochemical Industry in South Africa Revenue (Million) Forecast, by Application 2019 & 2032
- Table 60: Global Agrochemical Industry in South Africa Revenue Million Forecast, by Production Analysis 2019 & 2032
- Table 61: Global Agrochemical Industry in South Africa Revenue Million Forecast, by Consumption Analysis 2019 & 2032
- Table 62: Global Agrochemical Industry in South Africa Revenue Million Forecast, by Import Market Analysis (Value & Volume) 2019 & 2032
- Table 63: Global Agrochemical Industry in South Africa Revenue Million Forecast, by Export Market Analysis (Value & Volume) 2019 & 2032
- Table 64: Global Agrochemical Industry in South Africa Revenue Million Forecast, by Price Trend Analysis 2019 & 2032
- Table 65: Global Agrochemical Industry in South Africa Revenue Million Forecast, by Country 2019 & 2032
- Table 66: China Agrochemical Industry in South Africa Revenue (Million) Forecast, by Application 2019 & 2032
- Table 67: India Agrochemical Industry in South Africa Revenue (Million) Forecast, by Application 2019 & 2032
- Table 68: Japan Agrochemical Industry in South Africa Revenue (Million) Forecast, by Application 2019 & 2032
- Table 69: South Korea Agrochemical Industry in South Africa Revenue (Million) Forecast, by Application 2019 & 2032
- Table 70: ASEAN Agrochemical Industry in South Africa Revenue (Million) Forecast, by Application 2019 & 2032
- Table 71: Oceania Agrochemical Industry in South Africa Revenue (Million) Forecast, by Application 2019 & 2032
- Table 72: Rest of Asia Pacific Agrochemical Industry in South Africa Revenue (Million) Forecast, by Application 2019 & 2032
Frequently Asked Questions
1. What is the projected Compound Annual Growth Rate (CAGR) of the Agrochemical Industry in South Africa?
The projected CAGR is approximately 3.90%.
2. Which companies are prominent players in the Agrochemical Industry in South Africa?
Key companies in the market include Archer-Daniels-Midland (ADM), Cargill Incorporated, Sumitomo Chemical (Philagro SA), Nufarm, ICL Group Ltd, UPL Limited, BASF SE, FMC Corporation, Sociedad Química y Minera de Chile (SQM), Belaruskali, Sasol Limited, K+S AG, ADAMA Ltd, Uralkal, CF Industries Holdings, OCP Group, Land O' Lakes (Villa Crop Protection (Pty) Ltd, Yara International ASA, Syngenta AG, Nutrien Ltd, Corteva Agriscience, Bayer CropScience AG.
3. What are the main segments of the Agrochemical Industry in South Africa?
The market segments include Production Analysis, Consumption Analysis, Import Market Analysis (Value & Volume), Export Market Analysis (Value & Volume), Price Trend Analysis.
4. Can you provide details about the market size?
The market size is estimated to be USD 1.27 Million as of 2022.
5. What are some drivers contributing to market growth?
Adoption of Organic and Eco-friendly Farming Practices; Declining Area of Arable Land and Rising Food Security Concerns.
6. What are the notable trends driving market growth?
Increasing Adoption of Bio-based Agrochemicals.
7. Are there any restraints impacting market growth?
High Demand for Conventional and Synthetic Products; Lack of Awareness and Other Factors Limiting the Adoption of Agricultural Inoculants.
8. Can you provide examples of recent developments in the market?
N/A
9. What pricing options are available for accessing the report?
Pricing options include single-user, multi-user, and enterprise licenses priced at USD 3800, USD 4500, and USD 5800 respectively.
10. Is the market size provided in terms of value or volume?
The market size is provided in terms of value, measured in Million.
11. Are there any specific market keywords associated with the report?
Yes, the market keyword associated with the report is "Agrochemical Industry in South Africa," which aids in identifying and referencing the specific market segment covered.
12. How do I determine which pricing option suits my needs best?
The pricing options vary based on user requirements and access needs. Individual users may opt for single-user licenses, while businesses requiring broader access may choose multi-user or enterprise licenses for cost-effective access to the report.
13. Are there any additional resources or data provided in the Agrochemical Industry in South Africa report?
While the report offers comprehensive insights, it's advisable to review the specific contents or supplementary materials provided to ascertain if additional resources or data are available.
14. How can I stay updated on further developments or reports in the Agrochemical Industry in South Africa?
To stay informed about further developments, trends, and reports in the Agrochemical Industry in South Africa, consider subscribing to industry newsletters, following relevant companies and organizations, or regularly checking reputable industry news sources and publications.
Methodology
Step 1 - Identification of Relevant Samples Size from Population Database


Step 2 - Approaches for Defining Global Market Size (Value, Volume* & Price*)

Note*: In applicable scenarios
Step 3 - Data Sources
Primary Research
- Web Analytics
- Survey Reports
- Research Institute
- Latest Research Reports
- Opinion Leaders
Secondary Research
- Annual Reports
- White Paper
- Latest Press Release
- Industry Association
- Paid Database
- Investor Presentations

Step 4 - Data Triangulation
Involves using different sources of information in order to increase the validity of a study
These sources are likely to be stakeholders in a program - participants, other researchers, program staff, other community members, and so on.
Then we put all data in single framework & apply various statistical tools to find out the dynamic on the market.
During the analysis stage, feedback from the stakeholder groups would be compared to determine areas of agreement as well as areas of divergence


