
Key Insights
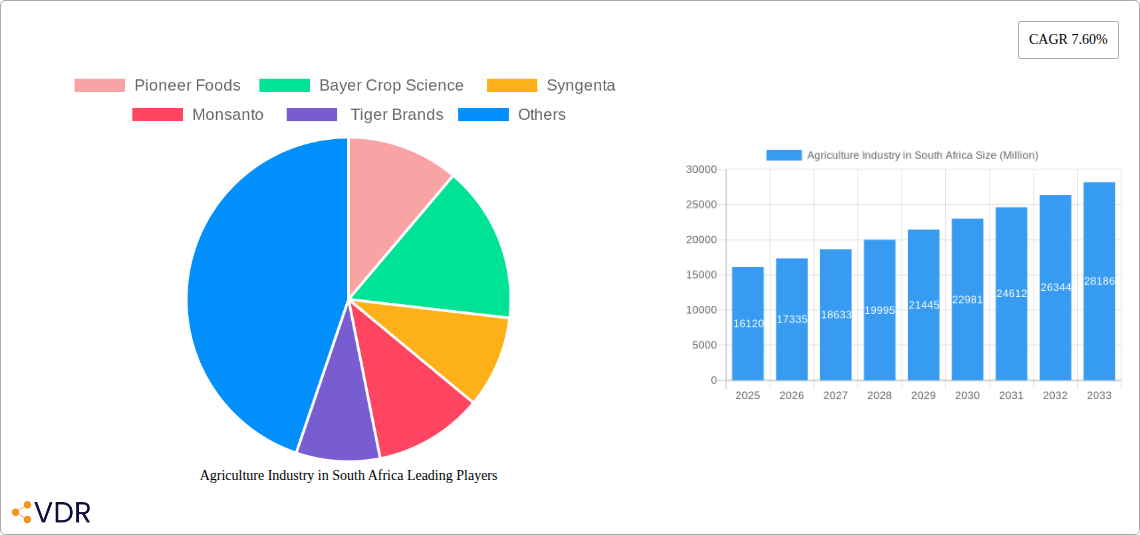
The South African agricultural industry, valued at $16.12 billion in 2025, exhibits robust growth potential, projected at a 7.60% CAGR from 2025 to 2033. This expansion is fueled by increasing demand for food products both domestically and internationally, driven by population growth and rising per capita income. Government initiatives promoting sustainable agricultural practices, including improved irrigation infrastructure and investment in research and development, further bolster the sector's growth. Key segments like cereals, fruits, vegetables, and oilseeds contribute significantly to the overall market value, with cereals likely holding the largest share due to their staple food status. Leading companies such as Pioneer Foods, Bayer Crop Science, Syngenta, Monsanto, and Tiger Brands play a crucial role in shaping the industry landscape, through advancements in seed technology, crop protection solutions, and efficient farming techniques. Challenges remain, however. These include climate change impacts such as droughts and unpredictable rainfall patterns, as well as ongoing land reform challenges affecting agricultural productivity and access to resources. Furthermore, fluctuating global commodity prices pose a considerable risk to profitability for producers.
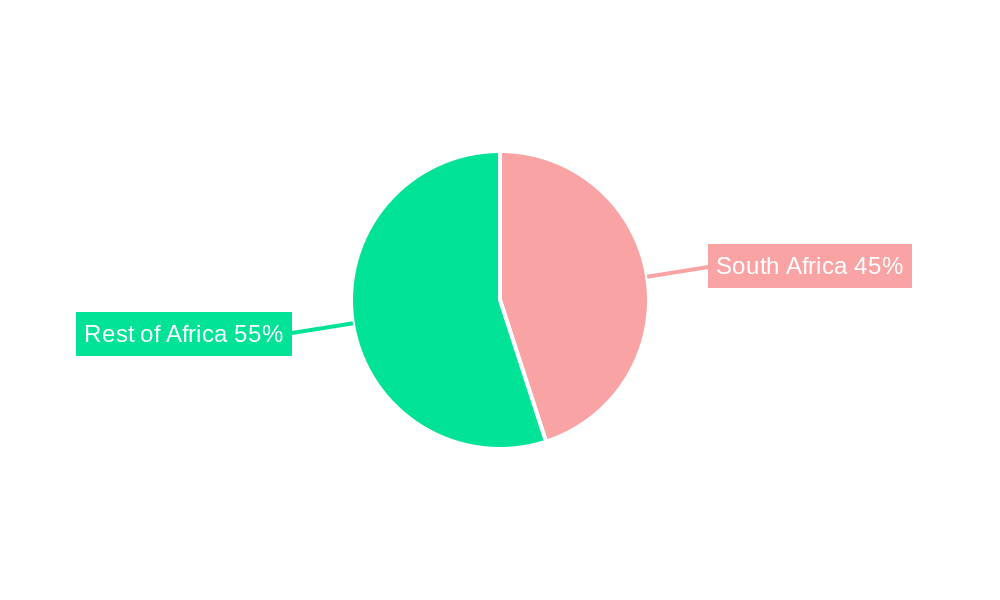
Despite these challenges, the South African agricultural sector demonstrates resilience. The consistent growth projections suggest a promising outlook, particularly with strategic investments in technology and infrastructure aimed at mitigating risks and enhancing productivity. Continued innovation in agricultural techniques, alongside effective government policy and private sector involvement, will be critical in realizing the full potential of this vital industry, ensuring food security and economic growth for the nation. The regional focus on key African countries like South Africa, Sudan, Uganda, Tanzania, and Kenya further highlights the significant contribution this industry makes to the wider African economic landscape. Diversification of crops and markets, along with a strong emphasis on sustainable farming practices, is vital for future success in this dynamic sector.
South Africa Agriculture Industry Report: 2019-2033
This comprehensive report provides an in-depth analysis of South Africa's agriculture industry, encompassing market dynamics, growth trends, key players, and future outlook. Covering the period 2019-2033, with a focus on 2025, this report is essential for industry professionals, investors, and policymakers seeking to understand and capitalize on opportunities within this vital sector. The report segments the market by crop type (Cereals, Fruits, Vegetables, Oilseeds) and leverages data to provide actionable insights. Market values are presented in millions of units (ZAR).
Agriculture Industry in South Africa Market Dynamics & Structure
The South African agriculture industry exhibits a moderately concentrated market structure, with a few large players like Pioneer Foods, Bayer Crop Science, Syngenta, and Monsanto (now part of Bayer) holding significant market share (estimated at xx% collectively in 2025). Technological innovation, driven primarily by advancements in precision agriculture and biotechnology, is a key driver, although adoption rates remain uneven across different segments and regions. Stringent regulatory frameworks and environmental concerns impact operations, while the industry faces competition from imported agricultural products. M&A activity (estimated at xx deals annually in the historical period) has consolidated the sector, resulting in increased vertical integration and market dominance among large players.
- Market Concentration: High in certain segments (e.g., cereals), fragmented in others (e.g., fruits and vegetables).
- Technological Innovation: Precision agriculture, GMOs, and improved seed varieties are key drivers, but access and affordability remain barriers for smaller farms.
- Regulatory Frameworks: Stringent environmental regulations and food safety standards influence operational practices.
- Competitive Product Substitutes: Imported agricultural products pose a significant competitive threat.
- End-User Demographics: Shifting consumer preferences towards organic and sustainably produced food influence farming practices.
- M&A Trends: Consolidation is prevalent, leading to increased scale and market power for major players.
Agriculture Industry in South Africa Growth Trends & Insights
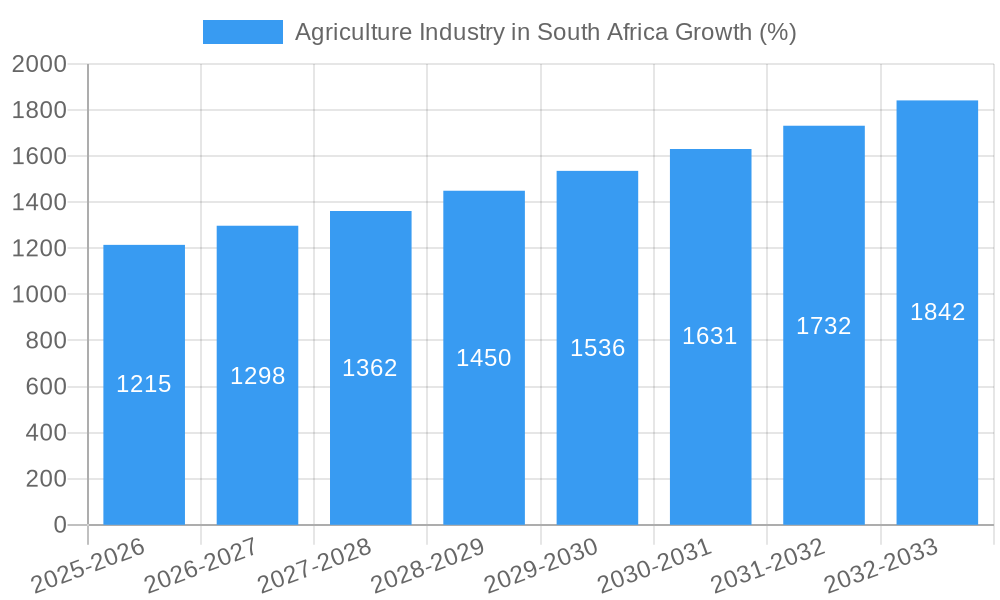
The South African agriculture industry experienced a compound annual growth rate (CAGR) of xx% during the historical period (2019-2024), driven by increasing domestic demand, export opportunities, and technological advancements. Market size in 2025 is estimated at ZAR xx million. Adoption of precision agriculture techniques, while increasing, remains relatively low in comparison to global averages, presenting significant potential for future growth. Consumer behavior shifts towards healthier food choices and sustainability concerns are impacting demand patterns, driving interest in organic farming and sustainable agricultural practices. Technological disruptions, such as the increased use of IoT sensors and data analytics in farming, are further enhancing productivity and efficiency. The forecast period (2025-2033) predicts a CAGR of xx%, reaching a projected market size of ZAR xx million by 2033. Market penetration of improved seed varieties is expected to increase from xx% in 2025 to xx% by 2033.
Dominant Regions, Countries, or Segments in Agriculture Industry in South Africa
The leading segment in the South African agriculture industry is cereals, driven by high domestic demand and strong export potential. The province of Mpumalanga holds a significant share of cereal production. This segment’s dominance is primarily due to:
- Favorable Climatic Conditions: Vast arable land with suitable rainfall patterns conducive to cereal cultivation.
- Established Infrastructure: Well-developed transportation networks and storage facilities support efficient distribution.
- Government Support: Agricultural policies and subsidies incentivize cereal production.
Other notable segments include fruits and vegetables, though their dominance is influenced by seasonality and export market fluctuations. Oilseeds are a growing sector but constrained by factors like water scarcity.
- Market Share: Cereals hold an estimated xx% market share in 2025.
- Growth Potential: Fruits and vegetables exhibit higher growth potential, driven by growing health consciousness.
Agriculture Industry in South Africa Product Landscape
Product innovation focuses on high-yield, drought-resistant, and disease-resistant crop varieties, along with sustainable farming practices. Precision agriculture technologies, such as GPS-guided machinery and sensor-based irrigation systems, are improving efficiency and yield. The emphasis is on enhancing nutritional value, extending shelf life, and meeting specific consumer preferences (e.g., organic, non-GMO).
Key Drivers, Barriers & Challenges in Agriculture Industry in South Africa
Key Drivers: Favorable climate in certain regions, growing domestic and export demand, technological advancements like precision agriculture, government support through subsidies and agricultural policies.
Key Challenges: Water scarcity, land reform issues, climate change impacting crop yields, inadequate infrastructure in some areas, high input costs, and competition from imported produce. For example, water scarcity reduces yields in xx% of agricultural land and increases production costs by an estimated xx% in affected regions.
Emerging Opportunities in Agriculture Industry in South Africa
Emerging opportunities lie in expanding organic and sustainable agriculture practices, leveraging technology for improved resource management, tapping into niche markets for specialized crops, and enhancing value-added processing to boost export revenue. Further developing the agro-processing industry and exploring alternative farming practices to address water scarcity will open further avenues for growth.
Growth Accelerators in the Agriculture Industry in South Africa Industry
Long-term growth will be fueled by technological innovation, strategic partnerships between farmers and technology providers, investment in infrastructure, and government policies supporting sustainable agriculture practices. Market expansion into African countries will offer significant opportunities.
Key Players Shaping the Agriculture Industry in South Africa Market
- Pioneer Foods
- Bayer Crop Science
- Syngenta
- Monsanto
- Tiger Brands
Notable Milestones in Agriculture Industry in South Africa Sector
- 2020: Launch of a new drought-resistant maize variety by Pioneer Foods.
- 2022: Government introduces a new agricultural policy focusing on sustainable farming practices.
- 2023: Significant investment in irrigation infrastructure in the Western Cape.
In-Depth Agriculture Industry in South Africa Market Outlook
The South African agriculture industry presents significant long-term growth potential driven by technological advancements, increased domestic demand, and opportunities in export markets. Strategic partnerships, sustainable practices, and infrastructure development will be crucial for realizing this potential. Continued investment in research and development of climate-resilient crops will be vital in mitigating the risks associated with climate change.
Agriculture Industry in South Africa Segmentation
-
1. Crop Type
- 1.1. Cereals
- 1.2. Fruits
- 1.3. Vegetables
- 1.4. Oilseeds
-
2. Crop Type
- 2.1. Cereals
- 2.2. Fruits
- 2.3. Vegetables
- 2.4. Oilseeds
Agriculture Industry in South Africa Segmentation By Geography
-
1. North America
- 1.1. United States
- 1.2. Canada
- 1.3. Mexico
-
2. South America
- 2.1. Brazil
- 2.2. Argentina
- 2.3. Rest of South America
-
3. Europe
- 3.1. United Kingdom
- 3.2. Germany
- 3.3. France
- 3.4. Italy
- 3.5. Spain
- 3.6. Russia
- 3.7. Benelux
- 3.8. Nordics
- 3.9. Rest of Europe
-
4. Middle East & Africa
- 4.1. Turkey
- 4.2. Israel
- 4.3. GCC
- 4.4. North Africa
- 4.5. South Africa
- 4.6. Rest of Middle East & Africa
-
5. Asia Pacific
- 5.1. China
- 5.2. India
- 5.3. Japan
- 5.4. South Korea
- 5.5. ASEAN
- 5.6. Oceania
- 5.7. Rest of Asia Pacific
Agriculture Industry in South Africa REPORT HIGHLIGHTS
| Aspects | Details |
|---|---|
| Study Period | 2019-2033 |
| Base Year | 2024 |
| Estimated Year | 2025 |
| Forecast Period | 2025-2033 |
| Historical Period | 2019-2024 |
| Growth Rate | CAGR of 7.60% from 2019-2033 |
| Segmentation |
|
Table of Contents
- 1. Introduction
- 1.1. Research Scope
- 1.2. Market Segmentation
- 1.3. Research Methodology
- 1.4. Definitions and Assumptions
- 2. Executive Summary
- 2.1. Introduction
- 3. Market Dynamics
- 3.1. Introduction
- 3.2. Market Drivers
- 3.2.1. Rising Consumption of Cashew Nuts as a Healthy Snack; Increasing Government initiatives; Growing Cashew Nut Imports in The United States
- 3.3. Market Restrains
- 3.3.1. Hazardous Climatic Condition Hinders Cashew Production; Stringent Regulations Related To Food Quality Standards
- 3.4. Market Trends
- 3.4.1. High Demand for Food Crops with the rising population
- 4. Market Factor Analysis
- 4.1. Porters Five Forces
- 4.2. Supply/Value Chain
- 4.3. PESTEL analysis
- 4.4. Market Entropy
- 4.5. Patent/Trademark Analysis
- 5. Global Agriculture Industry in South Africa Analysis, Insights and Forecast, 2019-2031
- 5.1. Market Analysis, Insights and Forecast - by Crop Type
- 5.1.1. Cereals
- 5.1.2. Fruits
- 5.1.3. Vegetables
- 5.1.4. Oilseeds
- 5.2. Market Analysis, Insights and Forecast - by Crop Type
- 5.2.1. Cereals
- 5.2.2. Fruits
- 5.2.3. Vegetables
- 5.2.4. Oilseeds
- 5.3. Market Analysis, Insights and Forecast - by Region
- 5.3.1. North America
- 5.3.2. South America
- 5.3.3. Europe
- 5.3.4. Middle East & Africa
- 5.3.5. Asia Pacific
- 5.1. Market Analysis, Insights and Forecast - by Crop Type
- 6. North America Agriculture Industry in South Africa Analysis, Insights and Forecast, 2019-2031
- 6.1. Market Analysis, Insights and Forecast - by Crop Type
- 6.1.1. Cereals
- 6.1.2. Fruits
- 6.1.3. Vegetables
- 6.1.4. Oilseeds
- 6.2. Market Analysis, Insights and Forecast - by Crop Type
- 6.2.1. Cereals
- 6.2.2. Fruits
- 6.2.3. Vegetables
- 6.2.4. Oilseeds
- 6.1. Market Analysis, Insights and Forecast - by Crop Type
- 7. South America Agriculture Industry in South Africa Analysis, Insights and Forecast, 2019-2031
- 7.1. Market Analysis, Insights and Forecast - by Crop Type
- 7.1.1. Cereals
- 7.1.2. Fruits
- 7.1.3. Vegetables
- 7.1.4. Oilseeds
- 7.2. Market Analysis, Insights and Forecast - by Crop Type
- 7.2.1. Cereals
- 7.2.2. Fruits
- 7.2.3. Vegetables
- 7.2.4. Oilseeds
- 7.1. Market Analysis, Insights and Forecast - by Crop Type
- 8. Europe Agriculture Industry in South Africa Analysis, Insights and Forecast, 2019-2031
- 8.1. Market Analysis, Insights and Forecast - by Crop Type
- 8.1.1. Cereals
- 8.1.2. Fruits
- 8.1.3. Vegetables
- 8.1.4. Oilseeds
- 8.2. Market Analysis, Insights and Forecast - by Crop Type
- 8.2.1. Cereals
- 8.2.2. Fruits
- 8.2.3. Vegetables
- 8.2.4. Oilseeds
- 8.1. Market Analysis, Insights and Forecast - by Crop Type
- 9. Middle East & Africa Agriculture Industry in South Africa Analysis, Insights and Forecast, 2019-2031
- 9.1. Market Analysis, Insights and Forecast - by Crop Type
- 9.1.1. Cereals
- 9.1.2. Fruits
- 9.1.3. Vegetables
- 9.1.4. Oilseeds
- 9.2. Market Analysis, Insights and Forecast - by Crop Type
- 9.2.1. Cereals
- 9.2.2. Fruits
- 9.2.3. Vegetables
- 9.2.4. Oilseeds
- 9.1. Market Analysis, Insights and Forecast - by Crop Type
- 10. Asia Pacific Agriculture Industry in South Africa Analysis, Insights and Forecast, 2019-2031
- 10.1. Market Analysis, Insights and Forecast - by Crop Type
- 10.1.1. Cereals
- 10.1.2. Fruits
- 10.1.3. Vegetables
- 10.1.4. Oilseeds
- 10.2. Market Analysis, Insights and Forecast - by Crop Type
- 10.2.1. Cereals
- 10.2.2. Fruits
- 10.2.3. Vegetables
- 10.2.4. Oilseeds
- 10.1. Market Analysis, Insights and Forecast - by Crop Type
- 11. South Africa Agriculture Industry in South Africa Analysis, Insights and Forecast, 2019-2031
- 12. Sudan Agriculture Industry in South Africa Analysis, Insights and Forecast, 2019-2031
- 13. Uganda Agriculture Industry in South Africa Analysis, Insights and Forecast, 2019-2031
- 14. Tanzania Agriculture Industry in South Africa Analysis, Insights and Forecast, 2019-2031
- 15. Kenya Agriculture Industry in South Africa Analysis, Insights and Forecast, 2019-2031
- 16. Rest of Africa Agriculture Industry in South Africa Analysis, Insights and Forecast, 2019-2031
- 17. Competitive Analysis
- 17.1. Global Market Share Analysis 2024
- 17.2. Company Profiles
- 17.2.1 Pioneer Foods
- 17.2.1.1. Overview
- 17.2.1.2. Products
- 17.2.1.3. SWOT Analysis
- 17.2.1.4. Recent Developments
- 17.2.1.5. Financials (Based on Availability)
- 17.2.2 Bayer Crop Science
- 17.2.2.1. Overview
- 17.2.2.2. Products
- 17.2.2.3. SWOT Analysis
- 17.2.2.4. Recent Developments
- 17.2.2.5. Financials (Based on Availability)
- 17.2.3 Syngenta
- 17.2.3.1. Overview
- 17.2.3.2. Products
- 17.2.3.3. SWOT Analysis
- 17.2.3.4. Recent Developments
- 17.2.3.5. Financials (Based on Availability)
- 17.2.4 Monsanto
- 17.2.4.1. Overview
- 17.2.4.2. Products
- 17.2.4.3. SWOT Analysis
- 17.2.4.4. Recent Developments
- 17.2.4.5. Financials (Based on Availability)
- 17.2.5 Tiger Brands
- 17.2.5.1. Overview
- 17.2.5.2. Products
- 17.2.5.3. SWOT Analysis
- 17.2.5.4. Recent Developments
- 17.2.5.5. Financials (Based on Availability)
- 17.2.1 Pioneer Foods
List of Figures
- Figure 1: Global Agriculture Industry in South Africa Revenue Breakdown (Million, %) by Region 2024 & 2032
- Figure 2: Africa Agriculture Industry in South Africa Revenue (Million), by Country 2024 & 2032
- Figure 3: Africa Agriculture Industry in South Africa Revenue Share (%), by Country 2024 & 2032
- Figure 4: North America Agriculture Industry in South Africa Revenue (Million), by Crop Type 2024 & 2032
- Figure 5: North America Agriculture Industry in South Africa Revenue Share (%), by Crop Type 2024 & 2032
- Figure 6: North America Agriculture Industry in South Africa Revenue (Million), by Crop Type 2024 & 2032
- Figure 7: North America Agriculture Industry in South Africa Revenue Share (%), by Crop Type 2024 & 2032
- Figure 8: North America Agriculture Industry in South Africa Revenue (Million), by Country 2024 & 2032
- Figure 9: North America Agriculture Industry in South Africa Revenue Share (%), by Country 2024 & 2032
- Figure 10: South America Agriculture Industry in South Africa Revenue (Million), by Crop Type 2024 & 2032
- Figure 11: South America Agriculture Industry in South Africa Revenue Share (%), by Crop Type 2024 & 2032
- Figure 12: South America Agriculture Industry in South Africa Revenue (Million), by Crop Type 2024 & 2032
- Figure 13: South America Agriculture Industry in South Africa Revenue Share (%), by Crop Type 2024 & 2032
- Figure 14: South America Agriculture Industry in South Africa Revenue (Million), by Country 2024 & 2032
- Figure 15: South America Agriculture Industry in South Africa Revenue Share (%), by Country 2024 & 2032
- Figure 16: Europe Agriculture Industry in South Africa Revenue (Million), by Crop Type 2024 & 2032
- Figure 17: Europe Agriculture Industry in South Africa Revenue Share (%), by Crop Type 2024 & 2032
- Figure 18: Europe Agriculture Industry in South Africa Revenue (Million), by Crop Type 2024 & 2032
- Figure 19: Europe Agriculture Industry in South Africa Revenue Share (%), by Crop Type 2024 & 2032
- Figure 20: Europe Agriculture Industry in South Africa Revenue (Million), by Country 2024 & 2032
- Figure 21: Europe Agriculture Industry in South Africa Revenue Share (%), by Country 2024 & 2032
- Figure 22: Middle East & Africa Agriculture Industry in South Africa Revenue (Million), by Crop Type 2024 & 2032
- Figure 23: Middle East & Africa Agriculture Industry in South Africa Revenue Share (%), by Crop Type 2024 & 2032
- Figure 24: Middle East & Africa Agriculture Industry in South Africa Revenue (Million), by Crop Type 2024 & 2032
- Figure 25: Middle East & Africa Agriculture Industry in South Africa Revenue Share (%), by Crop Type 2024 & 2032
- Figure 26: Middle East & Africa Agriculture Industry in South Africa Revenue (Million), by Country 2024 & 2032
- Figure 27: Middle East & Africa Agriculture Industry in South Africa Revenue Share (%), by Country 2024 & 2032
- Figure 28: Asia Pacific Agriculture Industry in South Africa Revenue (Million), by Crop Type 2024 & 2032
- Figure 29: Asia Pacific Agriculture Industry in South Africa Revenue Share (%), by Crop Type 2024 & 2032
- Figure 30: Asia Pacific Agriculture Industry in South Africa Revenue (Million), by Crop Type 2024 & 2032
- Figure 31: Asia Pacific Agriculture Industry in South Africa Revenue Share (%), by Crop Type 2024 & 2032
- Figure 32: Asia Pacific Agriculture Industry in South Africa Revenue (Million), by Country 2024 & 2032
- Figure 33: Asia Pacific Agriculture Industry in South Africa Revenue Share (%), by Country 2024 & 2032
List of Tables
- Table 1: Global Agriculture Industry in South Africa Revenue Million Forecast, by Region 2019 & 2032
- Table 2: Global Agriculture Industry in South Africa Revenue Million Forecast, by Crop Type 2019 & 2032
- Table 3: Global Agriculture Industry in South Africa Revenue Million Forecast, by Crop Type 2019 & 2032
- Table 4: Global Agriculture Industry in South Africa Revenue Million Forecast, by Region 2019 & 2032
- Table 5: Global Agriculture Industry in South Africa Revenue Million Forecast, by Country 2019 & 2032
- Table 6: South Africa Agriculture Industry in South Africa Revenue (Million) Forecast, by Application 2019 & 2032
- Table 7: Sudan Agriculture Industry in South Africa Revenue (Million) Forecast, by Application 2019 & 2032
- Table 8: Uganda Agriculture Industry in South Africa Revenue (Million) Forecast, by Application 2019 & 2032
- Table 9: Tanzania Agriculture Industry in South Africa Revenue (Million) Forecast, by Application 2019 & 2032
- Table 10: Kenya Agriculture Industry in South Africa Revenue (Million) Forecast, by Application 2019 & 2032
- Table 11: Rest of Africa Agriculture Industry in South Africa Revenue (Million) Forecast, by Application 2019 & 2032
- Table 12: Global Agriculture Industry in South Africa Revenue Million Forecast, by Crop Type 2019 & 2032
- Table 13: Global Agriculture Industry in South Africa Revenue Million Forecast, by Crop Type 2019 & 2032
- Table 14: Global Agriculture Industry in South Africa Revenue Million Forecast, by Country 2019 & 2032
- Table 15: United States Agriculture Industry in South Africa Revenue (Million) Forecast, by Application 2019 & 2032
- Table 16: Canada Agriculture Industry in South Africa Revenue (Million) Forecast, by Application 2019 & 2032
- Table 17: Mexico Agriculture Industry in South Africa Revenue (Million) Forecast, by Application 2019 & 2032
- Table 18: Global Agriculture Industry in South Africa Revenue Million Forecast, by Crop Type 2019 & 2032
- Table 19: Global Agriculture Industry in South Africa Revenue Million Forecast, by Crop Type 2019 & 2032
- Table 20: Global Agriculture Industry in South Africa Revenue Million Forecast, by Country 2019 & 2032
- Table 21: Brazil Agriculture Industry in South Africa Revenue (Million) Forecast, by Application 2019 & 2032
- Table 22: Argentina Agriculture Industry in South Africa Revenue (Million) Forecast, by Application 2019 & 2032
- Table 23: Rest of South America Agriculture Industry in South Africa Revenue (Million) Forecast, by Application 2019 & 2032
- Table 24: Global Agriculture Industry in South Africa Revenue Million Forecast, by Crop Type 2019 & 2032
- Table 25: Global Agriculture Industry in South Africa Revenue Million Forecast, by Crop Type 2019 & 2032
- Table 26: Global Agriculture Industry in South Africa Revenue Million Forecast, by Country 2019 & 2032
- Table 27: United Kingdom Agriculture Industry in South Africa Revenue (Million) Forecast, by Application 2019 & 2032
- Table 28: Germany Agriculture Industry in South Africa Revenue (Million) Forecast, by Application 2019 & 2032
- Table 29: France Agriculture Industry in South Africa Revenue (Million) Forecast, by Application 2019 & 2032
- Table 30: Italy Agriculture Industry in South Africa Revenue (Million) Forecast, by Application 2019 & 2032
- Table 31: Spain Agriculture Industry in South Africa Revenue (Million) Forecast, by Application 2019 & 2032
- Table 32: Russia Agriculture Industry in South Africa Revenue (Million) Forecast, by Application 2019 & 2032
- Table 33: Benelux Agriculture Industry in South Africa Revenue (Million) Forecast, by Application 2019 & 2032
- Table 34: Nordics Agriculture Industry in South Africa Revenue (Million) Forecast, by Application 2019 & 2032
- Table 35: Rest of Europe Agriculture Industry in South Africa Revenue (Million) Forecast, by Application 2019 & 2032
- Table 36: Global Agriculture Industry in South Africa Revenue Million Forecast, by Crop Type 2019 & 2032
- Table 37: Global Agriculture Industry in South Africa Revenue Million Forecast, by Crop Type 2019 & 2032
- Table 38: Global Agriculture Industry in South Africa Revenue Million Forecast, by Country 2019 & 2032
- Table 39: Turkey Agriculture Industry in South Africa Revenue (Million) Forecast, by Application 2019 & 2032
- Table 40: Israel Agriculture Industry in South Africa Revenue (Million) Forecast, by Application 2019 & 2032
- Table 41: GCC Agriculture Industry in South Africa Revenue (Million) Forecast, by Application 2019 & 2032
- Table 42: North Africa Agriculture Industry in South Africa Revenue (Million) Forecast, by Application 2019 & 2032
- Table 43: South Africa Agriculture Industry in South Africa Revenue (Million) Forecast, by Application 2019 & 2032
- Table 44: Rest of Middle East & Africa Agriculture Industry in South Africa Revenue (Million) Forecast, by Application 2019 & 2032
- Table 45: Global Agriculture Industry in South Africa Revenue Million Forecast, by Crop Type 2019 & 2032
- Table 46: Global Agriculture Industry in South Africa Revenue Million Forecast, by Crop Type 2019 & 2032
- Table 47: Global Agriculture Industry in South Africa Revenue Million Forecast, by Country 2019 & 2032
- Table 48: China Agriculture Industry in South Africa Revenue (Million) Forecast, by Application 2019 & 2032
- Table 49: India Agriculture Industry in South Africa Revenue (Million) Forecast, by Application 2019 & 2032
- Table 50: Japan Agriculture Industry in South Africa Revenue (Million) Forecast, by Application 2019 & 2032
- Table 51: South Korea Agriculture Industry in South Africa Revenue (Million) Forecast, by Application 2019 & 2032
- Table 52: ASEAN Agriculture Industry in South Africa Revenue (Million) Forecast, by Application 2019 & 2032
- Table 53: Oceania Agriculture Industry in South Africa Revenue (Million) Forecast, by Application 2019 & 2032
- Table 54: Rest of Asia Pacific Agriculture Industry in South Africa Revenue (Million) Forecast, by Application 2019 & 2032
Frequently Asked Questions
1. What is the projected Compound Annual Growth Rate (CAGR) of the Agriculture Industry in South Africa?
The projected CAGR is approximately 7.60%.
2. Which companies are prominent players in the Agriculture Industry in South Africa?
Key companies in the market include Pioneer Foods , Bayer Crop Science , Syngenta , Monsanto , Tiger Brands.
3. What are the main segments of the Agriculture Industry in South Africa?
The market segments include Crop Type, Crop Type.
4. Can you provide details about the market size?
The market size is estimated to be USD 16.12 Million as of 2022.
5. What are some drivers contributing to market growth?
Rising Consumption of Cashew Nuts as a Healthy Snack; Increasing Government initiatives; Growing Cashew Nut Imports in The United States.
6. What are the notable trends driving market growth?
High Demand for Food Crops with the rising population.
7. Are there any restraints impacting market growth?
Hazardous Climatic Condition Hinders Cashew Production; Stringent Regulations Related To Food Quality Standards.
8. Can you provide examples of recent developments in the market?
N/A
9. What pricing options are available for accessing the report?
Pricing options include single-user, multi-user, and enterprise licenses priced at USD 3800, USD 4500, and USD 5800 respectively.
10. Is the market size provided in terms of value or volume?
The market size is provided in terms of value, measured in Million.
11. Are there any specific market keywords associated with the report?
Yes, the market keyword associated with the report is "Agriculture Industry in South Africa," which aids in identifying and referencing the specific market segment covered.
12. How do I determine which pricing option suits my needs best?
The pricing options vary based on user requirements and access needs. Individual users may opt for single-user licenses, while businesses requiring broader access may choose multi-user or enterprise licenses for cost-effective access to the report.
13. Are there any additional resources or data provided in the Agriculture Industry in South Africa report?
While the report offers comprehensive insights, it's advisable to review the specific contents or supplementary materials provided to ascertain if additional resources or data are available.
14. How can I stay updated on further developments or reports in the Agriculture Industry in South Africa?
To stay informed about further developments, trends, and reports in the Agriculture Industry in South Africa, consider subscribing to industry newsletters, following relevant companies and organizations, or regularly checking reputable industry news sources and publications.
Methodology
Step 1 - Identification of Relevant Samples Size from Population Database


Step 2 - Approaches for Defining Global Market Size (Value, Volume* & Price*)

Note*: In applicable scenarios
Step 3 - Data Sources
Primary Research
- Web Analytics
- Survey Reports
- Research Institute
- Latest Research Reports
- Opinion Leaders
Secondary Research
- Annual Reports
- White Paper
- Latest Press Release
- Industry Association
- Paid Database
- Investor Presentations

Step 4 - Data Triangulation
Involves using different sources of information in order to increase the validity of a study
These sources are likely to be stakeholders in a program - participants, other researchers, program staff, other community members, and so on.
Then we put all data in single framework & apply various statistical tools to find out the dynamic on the market.
During the analysis stage, feedback from the stakeholder groups would be compared to determine areas of agreement as well as areas of divergence


