

Key Insights
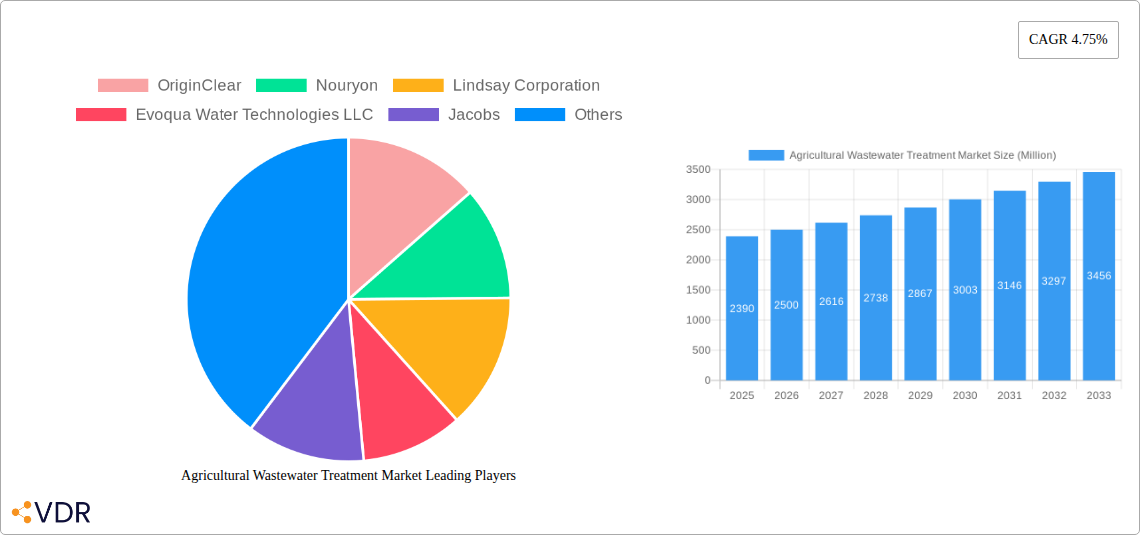
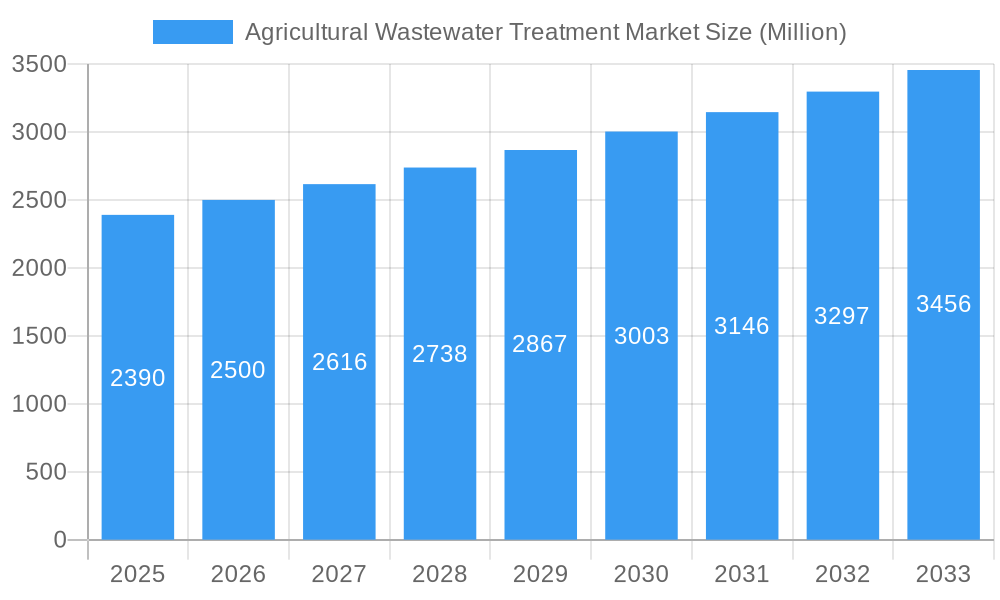
The global agricultural wastewater treatment market, valued at $2.39 billion in 2025, is projected to experience robust growth, driven by increasing government regulations aimed at reducing water pollution from agricultural activities and the rising demand for sustainable agricultural practices. The market's Compound Annual Growth Rate (CAGR) of 4.75% from 2025 to 2033 indicates a significant expansion over the forecast period. Key drivers include the growing awareness of the negative environmental impact of untreated agricultural wastewater, advancements in treatment technologies (physical, chemical, and biological solutions), and increasing adoption of precision agriculture techniques that generate smaller volumes of wastewater but require more efficient treatment. The market is segmented by pollutant source (point and non-point), application (crop and non-crop), and technology. The demand for efficient treatment solutions is high in regions with intensive agricultural practices, such as Asia Pacific (particularly China and India) and North America (primarily the United States). Competition among established players like OriginClear, Nouryon, and Suez, alongside emerging technology providers, is driving innovation and improving treatment efficiency.
Agricultural Wastewater Treatment Market Market Size (In Billion)
Challenges remain, including the high initial investment costs associated with implementing wastewater treatment systems, especially for smaller farms, and the need for ongoing maintenance and operational expertise. Furthermore, the effectiveness of treatment technologies can vary depending on the specific composition of the wastewater. Despite these challenges, the long-term outlook for the agricultural wastewater treatment market remains positive, fuelled by the increasing pressure to protect water resources and enhance food security while minimizing environmental impact. The market's growth will likely be influenced by technological advancements leading to more cost-effective and sustainable solutions, as well as government policies promoting environmentally friendly agricultural practices. The increasing adoption of advanced treatment technologies like membrane bioreactors and constructed wetlands are also set to drive further market expansion.
Agricultural Wastewater Treatment Market Company Market Share
Agricultural Wastewater Treatment Market: A Comprehensive Report (2019-2033)
This comprehensive report provides a detailed analysis of the Agricultural Wastewater Treatment Market, encompassing market dynamics, growth trends, regional dominance, product landscape, key players, and future outlook. The study period covers 2019-2033, with 2025 as the base year and forecast period extending to 2033. The market is segmented by technology (Physical Solutions, Chemical Solutions, Biological Solutions), pollutant source (Point Source, Nonpoint Source), and application (Crop, Non-Crop). The report offers invaluable insights for industry professionals, investors, and stakeholders seeking a deep understanding of this crucial sector. The market size is projected to reach xx Million by 2033.
Agricultural Wastewater Treatment Market Dynamics & Structure
The agricultural wastewater treatment market is characterized by moderate concentration, with several key players holding significant market share. Technological innovation, driven by stricter environmental regulations and the need for sustainable agricultural practices, is a primary growth driver. The market witnesses continuous technological advancements, with companies investing heavily in R&D to improve treatment efficiency and reduce costs. Mergers and acquisitions (M&A) activity is relatively frequent, reflecting consolidation and expansion efforts within the industry. The presence of substitute technologies, while limited, poses a certain competitive pressure. The end-user demographics encompass diverse agricultural operations, ranging from small farms to large-scale industrial agricultural enterprises.
- Market Concentration: Moderately concentrated, with the top 5 players holding approximately xx% of the market share in 2025.
- Technological Innovation: Significant investments in R&D, focusing on improving treatment efficiency and reducing energy consumption. Key areas of innovation include advanced oxidation processes, membrane filtration, and bioremediation technologies.
- Regulatory Frameworks: Stringent environmental regulations in many regions are driving adoption of advanced wastewater treatment solutions.
- Competitive Product Substitutes: Limited substitutes exist, mainly involving traditional methods with lower efficiency.
- End-User Demographics: Diverse, ranging from small farms to large-scale industrial agriculture.
- M&A Trends: Moderate M&A activity, with an estimated xx deals closed annually in the historical period (2019-2024).
Agricultural Wastewater Treatment Market Growth Trends & Insights
The Agricultural Wastewater Treatment Market exhibits a steady growth trajectory, driven by factors such as increasing awareness of water pollution from agricultural runoff, stringent government regulations, and the growing demand for sustainable agricultural practices. The market experienced a CAGR of xx% during the historical period (2019-2024) and is projected to grow at a CAGR of xx% during the forecast period (2025-2033). Technological advancements, particularly in the area of biological and chemical solutions, contribute significantly to increased adoption rates. Consumer behavior shifts, influenced by increasing environmental concerns and rising awareness of water scarcity, further fuel market expansion. Market penetration of advanced treatment technologies is gradually increasing across different regions, with notable progress observed in developed economies. The shift towards precision agriculture and sustainable intensification practices is expected to boost market growth further.
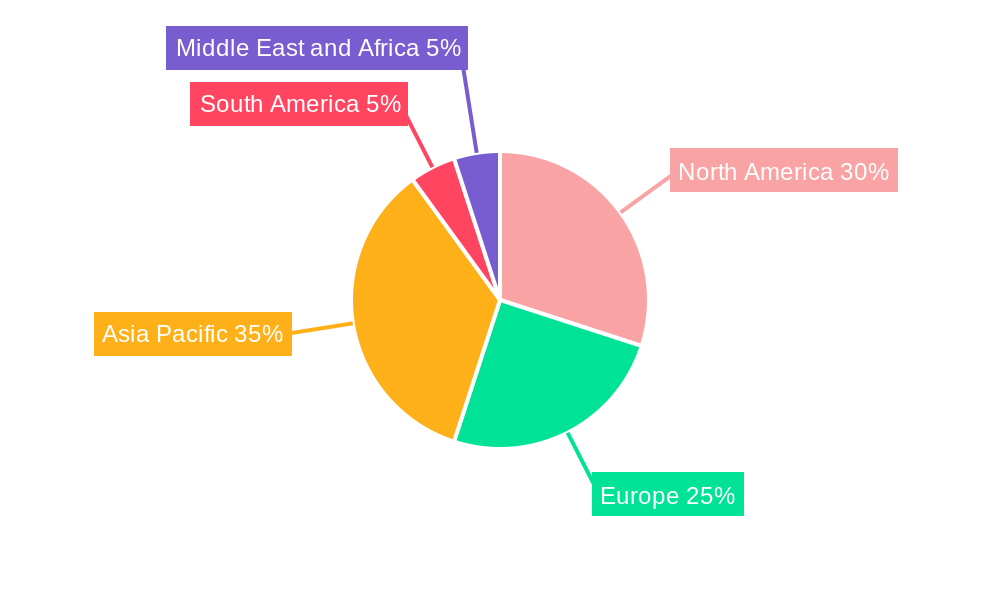
Dominant Regions, Countries, or Segments in Agricultural Wastewater Treatment Market
North America and Europe currently dominate the agricultural wastewater treatment market, driven by stringent environmental regulations, high agricultural output, and significant investments in infrastructure development. Within technology segments, biological solutions are experiencing the highest growth, primarily due to their cost-effectiveness and environmental friendliness. Point source pollution treatment holds a larger market share compared to non-point source due to the ease of implementation and monitoring. The crop application segment maintains a substantial share owing to the large volume of wastewater generated by intensive farming practices.
- Key Drivers: Stringent environmental regulations, increasing agricultural intensity, government incentives, and technological advancements.
- North America Dominance: Driven by high agricultural output and stringent environmental policies.
- Europe's Strong Presence: Fueled by stricter regulations and adoption of sustainable farming practices.
- Asia-Pacific Growth Potential: Large agricultural sector, increasing awareness of water pollution, and rising investments in infrastructure.
- Biological Solutions Leading: Cost-effectiveness and environmental benefits drive its adoption.
- Point Source Dominance: Easier implementation and monitoring compared to Non-point source.
- Crop Application Segment: Largest market share due to high wastewater generation in intensive farming.
Agricultural Wastewater Treatment Market Product Landscape
The market offers a diverse range of products, including physical solutions like filtration and sedimentation, chemical solutions like coagulation and flocculation, and biological solutions such as activated sludge and anaerobic digestion. Recent innovations focus on enhancing treatment efficiency, reducing energy consumption, and minimizing sludge production. The unique selling propositions include improved treatment effectiveness, reduced operational costs, and minimized environmental impact. Advanced technologies, such as membrane bioreactors and advanced oxidation processes, are gaining traction due to their superior performance.
Key Drivers, Barriers & Challenges in Agricultural Wastewater Treatment Market
Key Drivers:
- Stringent environmental regulations globally pushing for wastewater treatment.
- Increasing awareness of water pollution's impact on human health and the environment.
- Growing demand for sustainable agricultural practices.
- Technological advancements offering more efficient and cost-effective solutions.
Challenges and Restraints:
- High initial investment costs for advanced treatment technologies can deter smaller farms.
- Implementation challenges for non-point source pollution treatment.
- Lack of awareness and technical expertise in certain regions.
- Regulatory inconsistencies across different jurisdictions. Estimated xx Million in lost revenue annually due to regulatory hurdles.
Emerging Opportunities in Agricultural Wastewater Treatment Market
- Untapped markets in developing countries with burgeoning agricultural sectors.
- Integration of smart technologies for real-time monitoring and control.
- Development of decentralized wastewater treatment systems for smaller farms.
- Innovative applications, such as nutrient recovery and energy generation from wastewater.
- Growing demand for water-efficient irrigation systems, reducing wastewater volume.
Growth Accelerators in the Agricultural Wastewater Treatment Market Industry
Technological breakthroughs, particularly in areas like artificial intelligence (AI) and machine learning (ML) for optimizing treatment processes, are key growth catalysts. Strategic partnerships between technology providers, agricultural companies, and government agencies promote market expansion. Expansion strategies focusing on emerging markets with high agricultural activity create significant growth opportunities.
Key Players Shaping the Agricultural Wastewater Treatment Market Market
- OriginClear
- Nouryon
- Lindsay Corporation
- Evoqua Water Technologies LLC
- Jacobs
- Aquatech International LLC
- BASF SE
- IDE
- SUEZ
- DuPont
- Organo Corporation
- Veolia
- AECOM
- Louis Berger International
Notable Milestones in Agricultural Wastewater Treatment Market Sector
- September 2022: Lanxess commissioned a new wastewater treatment plant in Belgium, investing USD 12.65 million.
- June 2022: AECOM completed the design for a new North Shore wastewater treatment plant, emphasizing environmental sustainability.
In-Depth Agricultural Wastewater Treatment Market Market Outlook
The agricultural wastewater treatment market is poised for significant growth over the forecast period. Continued technological innovation, coupled with stringent environmental regulations and a growing emphasis on sustainable agriculture, will drive market expansion. Strategic partnerships and investments in emerging markets present lucrative opportunities for market players. The focus on resource recovery and energy generation from treated wastewater will further accelerate market growth, creating a more sustainable and efficient agricultural landscape.
Agricultural Wastewater Treatment Market Segmentation
-
1. Technology
- 1.1. Physical Solutions
- 1.2. Chemical Solutions
- 1.3. Biological Solutions
-
2. Pollutant Source
- 2.1. Point Source
- 2.2. Nonpoint Source
-
3. Application
- 3.1. Crop
- 3.2. Non-Crop
Agricultural Wastewater Treatment Market Segmentation By Geography
-
1. Asia Pacific
- 1.1. China
- 1.2. India
- 1.3. Japan
- 1.4. South Korea
- 1.5. Rest of Asia Pacific
-
2. North America
- 2.1. United States
- 2.2. Canada
- 2.3. Mexico
-
3. Europe
- 3.1. Germany
- 3.2. United Kingdom
- 3.3. France
- 3.4. Italy
- 3.5. Rest of Europe
-
4. South America
- 4.1. Brazil
- 4.2. Argentina
- 4.3. Rest of South America
-
5. Middle East and Africa
- 5.1. Saudi Arabia
- 5.2. South Africa
- 5.3. Rest of Middle East and Africa
Agricultural Wastewater Treatment Market Regional Market Share
Geographic Coverage of Agricultural Wastewater Treatment Market
Agricultural Wastewater Treatment Market REPORT HIGHLIGHTS
| Aspects | Details |
|---|---|
| Study Period | 2020-2034 |
| Base Year | 2025 |
| Estimated Year | 2026 |
| Forecast Period | 2026-2034 |
| Historical Period | 2020-2025 |
| Growth Rate | CAGR of 4.75% from 2020-2034 |
| Segmentation |
|
Table of Contents
- 1. Introduction
- 1.1. Research Scope
- 1.2. Market Segmentation
- 1.3. Research Objective
- 1.4. Definitions and Assumptions
- 2. Executive Summary
- 2.1. Market Snapshot
- 3. Market Dynamics
- 3.1. Market Drivers
- 3.2. Market Restrains
- 3.3. Market Trends
- 3.4. Market Opportunities
- 4. Market Factor Analysis
- 4.1. Porters Five Forces
- 4.1.1. Bargaining Power of Suppliers
- 4.1.2. Bargaining Power of Buyers
- 4.1.3. Threat of New Entrants
- 4.1.4. Threat of Substitutes
- 4.1.5. Competitive Rivalry
- 4.2. PESTEL analysis
- 4.3. BCG Analysis
- 4.3.1. Stars (High Growth, High Market Share)
- 4.3.2. Cash Cows (Low Growth, High Market Share)
- 4.3.3. Question Mark (High Growth, Low Market Share)
- 4.3.4. Dogs (Low Growth, Low Market Share)
- 4.4. Ansoff Matrix Analysis
- 4.5. Supply Chain Analysis
- 4.6. Regulatory Landscape
- 4.7. Current Market Potential and Opportunity Assessment (TAM–SAM–SOM Framework)
- 4.8. VDR Analyst Note
- 4.1. Porters Five Forces
- 5. Market Analysis, Insights and Forecast 2021-2033
- 5.1. Market Analysis, Insights and Forecast - by Technology
- 5.1.1. Physical Solutions
- 5.1.2. Chemical Solutions
- 5.1.3. Biological Solutions
- 5.2. Market Analysis, Insights and Forecast - by Pollutant Source
- 5.2.1. Point Source
- 5.2.2. Nonpoint Source
- 5.3. Market Analysis, Insights and Forecast - by Application
- 5.3.1. Crop
- 5.3.2. Non-Crop
- 5.4. Market Analysis, Insights and Forecast - by Region
- 5.4.1. Asia Pacific
- 5.4.2. North America
- 5.4.3. Europe
- 5.4.4. South America
- 5.4.5. Middle East and Africa
- 5.1. Market Analysis, Insights and Forecast - by Technology
- 6. Global Agricultural Wastewater Treatment Market Analysis, Insights and Forecast, 2021-2033
- 6.1. Market Analysis, Insights and Forecast - by Technology
- 6.1.1. Physical Solutions
- 6.1.2. Chemical Solutions
- 6.1.3. Biological Solutions
- 6.2. Market Analysis, Insights and Forecast - by Pollutant Source
- 6.2.1. Point Source
- 6.2.2. Nonpoint Source
- 6.3. Market Analysis, Insights and Forecast - by Application
- 6.3.1. Crop
- 6.3.2. Non-Crop
- 6.1. Market Analysis, Insights and Forecast - by Technology
- 7. Asia Pacific Agricultural Wastewater Treatment Market Analysis, Insights and Forecast, 2021-2033
- 7.1. Market Analysis, Insights and Forecast - by Technology
- 7.1.1. Physical Solutions
- 7.1.2. Chemical Solutions
- 7.1.3. Biological Solutions
- 7.2. Market Analysis, Insights and Forecast - by Pollutant Source
- 7.2.1. Point Source
- 7.2.2. Nonpoint Source
- 7.3. Market Analysis, Insights and Forecast - by Application
- 7.3.1. Crop
- 7.3.2. Non-Crop
- 7.1. Market Analysis, Insights and Forecast - by Technology
- 8. North America Agricultural Wastewater Treatment Market Analysis, Insights and Forecast, 2021-2033
- 8.1. Market Analysis, Insights and Forecast - by Technology
- 8.1.1. Physical Solutions
- 8.1.2. Chemical Solutions
- 8.1.3. Biological Solutions
- 8.2. Market Analysis, Insights and Forecast - by Pollutant Source
- 8.2.1. Point Source
- 8.2.2. Nonpoint Source
- 8.3. Market Analysis, Insights and Forecast - by Application
- 8.3.1. Crop
- 8.3.2. Non-Crop
- 8.1. Market Analysis, Insights and Forecast - by Technology
- 9. Europe Agricultural Wastewater Treatment Market Analysis, Insights and Forecast, 2021-2033
- 9.1. Market Analysis, Insights and Forecast - by Technology
- 9.1.1. Physical Solutions
- 9.1.2. Chemical Solutions
- 9.1.3. Biological Solutions
- 9.2. Market Analysis, Insights and Forecast - by Pollutant Source
- 9.2.1. Point Source
- 9.2.2. Nonpoint Source
- 9.3. Market Analysis, Insights and Forecast - by Application
- 9.3.1. Crop
- 9.3.2. Non-Crop
- 9.1. Market Analysis, Insights and Forecast - by Technology
- 10. South America Agricultural Wastewater Treatment Market Analysis, Insights and Forecast, 2021-2033
- 10.1. Market Analysis, Insights and Forecast - by Technology
- 10.1.1. Physical Solutions
- 10.1.2. Chemical Solutions
- 10.1.3. Biological Solutions
- 10.2. Market Analysis, Insights and Forecast - by Pollutant Source
- 10.2.1. Point Source
- 10.2.2. Nonpoint Source
- 10.3. Market Analysis, Insights and Forecast - by Application
- 10.3.1. Crop
- 10.3.2. Non-Crop
- 10.1. Market Analysis, Insights and Forecast - by Technology
- 11. Middle East and Africa Agricultural Wastewater Treatment Market Analysis, Insights and Forecast, 2021-2033
- 11.1. Market Analysis, Insights and Forecast - by Technology
- 11.1.1. Physical Solutions
- 11.1.2. Chemical Solutions
- 11.1.3. Biological Solutions
- 11.2. Market Analysis, Insights and Forecast - by Pollutant Source
- 11.2.1. Point Source
- 11.2.2. Nonpoint Source
- 11.3. Market Analysis, Insights and Forecast - by Application
- 11.3.1. Crop
- 11.3.2. Non-Crop
- 11.1. Market Analysis, Insights and Forecast - by Technology
- 12. Competitive Analysis
- 12.1. Company Profiles
- 12.1.1 OriginClear
- 12.1.1.1. Company Overview
- 12.1.1.2. Products
- 12.1.1.3. Company Financials
- 12.1.1.4. SWOT Analysis
- 12.1.2 Nouryon
- 12.1.2.1. Company Overview
- 12.1.2.2. Products
- 12.1.2.3. Company Financials
- 12.1.2.4. SWOT Analysis
- 12.1.3 Lindsay Corporation
- 12.1.3.1. Company Overview
- 12.1.3.2. Products
- 12.1.3.3. Company Financials
- 12.1.3.4. SWOT Analysis
- 12.1.4 Evoqua Water Technologies LLC
- 12.1.4.1. Company Overview
- 12.1.4.2. Products
- 12.1.4.3. Company Financials
- 12.1.4.4. SWOT Analysis
- 12.1.5 Jacobs
- 12.1.5.1. Company Overview
- 12.1.5.2. Products
- 12.1.5.3. Company Financials
- 12.1.5.4. SWOT Analysis
- 12.1.6 Aquatech International LLC
- 12.1.6.1. Company Overview
- 12.1.6.2. Products
- 12.1.6.3. Company Financials
- 12.1.6.4. SWOT Analysis
- 12.1.7 BASF SE
- 12.1.7.1. Company Overview
- 12.1.7.2. Products
- 12.1.7.3. Company Financials
- 12.1.7.4. SWOT Analysis
- 12.1.8 IDE
- 12.1.8.1. Company Overview
- 12.1.8.2. Products
- 12.1.8.3. Company Financials
- 12.1.8.4. SWOT Analysis
- 12.1.9 SUEZ
- 12.1.9.1. Company Overview
- 12.1.9.2. Products
- 12.1.9.3. Company Financials
- 12.1.9.4. SWOT Analysis
- 12.1.10 DuPont
- 12.1.10.1. Company Overview
- 12.1.10.2. Products
- 12.1.10.3. Company Financials
- 12.1.10.4. SWOT Analysis
- 12.1.11 Organo Corporation
- 12.1.11.1. Company Overview
- 12.1.11.2. Products
- 12.1.11.3. Company Financials
- 12.1.11.4. SWOT Analysis
- 12.1.12 Veolia*List Not Exhaustive
- 12.1.12.1. Company Overview
- 12.1.12.2. Products
- 12.1.12.3. Company Financials
- 12.1.12.4. SWOT Analysis
- 12.1.13 AECOM
- 12.1.13.1. Company Overview
- 12.1.13.2. Products
- 12.1.13.3. Company Financials
- 12.1.13.4. SWOT Analysis
- 12.1.14 Louis Berger International
- 12.1.14.1. Company Overview
- 12.1.14.2. Products
- 12.1.14.3. Company Financials
- 12.1.14.4. SWOT Analysis
- 12.1.1 OriginClear
- 12.2. Market Entropy
- 12.2.1 Company's Key Areas Served
- 12.2.2 Recent Developments
- 12.3. Company Market Share Analysis 2025
- 12.3.1 Top 5 Companies Market Share Analysis
- 12.3.2 Top 3 Companies Market Share Analysis
- 12.4. List of Potential Customers
- 13. Research Methodology
List of Figures
- Figure 1: Global Agricultural Wastewater Treatment Market Revenue Breakdown (Million, %) by Region 2025 & 2033
- Figure 2: Asia Pacific Agricultural Wastewater Treatment Market Revenue (Million), by Technology 2025 & 2033
- Figure 3: Asia Pacific Agricultural Wastewater Treatment Market Revenue Share (%), by Technology 2025 & 2033
- Figure 4: Asia Pacific Agricultural Wastewater Treatment Market Revenue (Million), by Pollutant Source 2025 & 2033
- Figure 5: Asia Pacific Agricultural Wastewater Treatment Market Revenue Share (%), by Pollutant Source 2025 & 2033
- Figure 6: Asia Pacific Agricultural Wastewater Treatment Market Revenue (Million), by Application 2025 & 2033
- Figure 7: Asia Pacific Agricultural Wastewater Treatment Market Revenue Share (%), by Application 2025 & 2033
- Figure 8: Asia Pacific Agricultural Wastewater Treatment Market Revenue (Million), by Country 2025 & 2033
- Figure 9: Asia Pacific Agricultural Wastewater Treatment Market Revenue Share (%), by Country 2025 & 2033
- Figure 10: North America Agricultural Wastewater Treatment Market Revenue (Million), by Technology 2025 & 2033
- Figure 11: North America Agricultural Wastewater Treatment Market Revenue Share (%), by Technology 2025 & 2033
- Figure 12: North America Agricultural Wastewater Treatment Market Revenue (Million), by Pollutant Source 2025 & 2033
- Figure 13: North America Agricultural Wastewater Treatment Market Revenue Share (%), by Pollutant Source 2025 & 2033
- Figure 14: North America Agricultural Wastewater Treatment Market Revenue (Million), by Application 2025 & 2033
- Figure 15: North America Agricultural Wastewater Treatment Market Revenue Share (%), by Application 2025 & 2033
- Figure 16: North America Agricultural Wastewater Treatment Market Revenue (Million), by Country 2025 & 2033
- Figure 17: North America Agricultural Wastewater Treatment Market Revenue Share (%), by Country 2025 & 2033
- Figure 18: Europe Agricultural Wastewater Treatment Market Revenue (Million), by Technology 2025 & 2033
- Figure 19: Europe Agricultural Wastewater Treatment Market Revenue Share (%), by Technology 2025 & 2033
- Figure 20: Europe Agricultural Wastewater Treatment Market Revenue (Million), by Pollutant Source 2025 & 2033
- Figure 21: Europe Agricultural Wastewater Treatment Market Revenue Share (%), by Pollutant Source 2025 & 2033
- Figure 22: Europe Agricultural Wastewater Treatment Market Revenue (Million), by Application 2025 & 2033
- Figure 23: Europe Agricultural Wastewater Treatment Market Revenue Share (%), by Application 2025 & 2033
- Figure 24: Europe Agricultural Wastewater Treatment Market Revenue (Million), by Country 2025 & 2033
- Figure 25: Europe Agricultural Wastewater Treatment Market Revenue Share (%), by Country 2025 & 2033
- Figure 26: South America Agricultural Wastewater Treatment Market Revenue (Million), by Technology 2025 & 2033
- Figure 27: South America Agricultural Wastewater Treatment Market Revenue Share (%), by Technology 2025 & 2033
- Figure 28: South America Agricultural Wastewater Treatment Market Revenue (Million), by Pollutant Source 2025 & 2033
- Figure 29: South America Agricultural Wastewater Treatment Market Revenue Share (%), by Pollutant Source 2025 & 2033
- Figure 30: South America Agricultural Wastewater Treatment Market Revenue (Million), by Application 2025 & 2033
- Figure 31: South America Agricultural Wastewater Treatment Market Revenue Share (%), by Application 2025 & 2033
- Figure 32: South America Agricultural Wastewater Treatment Market Revenue (Million), by Country 2025 & 2033
- Figure 33: South America Agricultural Wastewater Treatment Market Revenue Share (%), by Country 2025 & 2033
- Figure 34: Middle East and Africa Agricultural Wastewater Treatment Market Revenue (Million), by Technology 2025 & 2033
- Figure 35: Middle East and Africa Agricultural Wastewater Treatment Market Revenue Share (%), by Technology 2025 & 2033
- Figure 36: Middle East and Africa Agricultural Wastewater Treatment Market Revenue (Million), by Pollutant Source 2025 & 2033
- Figure 37: Middle East and Africa Agricultural Wastewater Treatment Market Revenue Share (%), by Pollutant Source 2025 & 2033
- Figure 38: Middle East and Africa Agricultural Wastewater Treatment Market Revenue (Million), by Application 2025 & 2033
- Figure 39: Middle East and Africa Agricultural Wastewater Treatment Market Revenue Share (%), by Application 2025 & 2033
- Figure 40: Middle East and Africa Agricultural Wastewater Treatment Market Revenue (Million), by Country 2025 & 2033
- Figure 41: Middle East and Africa Agricultural Wastewater Treatment Market Revenue Share (%), by Country 2025 & 2033
List of Tables
- Table 1: Global Agricultural Wastewater Treatment Market Revenue Million Forecast, by Technology 2020 & 2033
- Table 2: Global Agricultural Wastewater Treatment Market Revenue Million Forecast, by Pollutant Source 2020 & 2033
- Table 3: Global Agricultural Wastewater Treatment Market Revenue Million Forecast, by Application 2020 & 2033
- Table 4: Global Agricultural Wastewater Treatment Market Revenue Million Forecast, by Region 2020 & 2033
- Table 5: Global Agricultural Wastewater Treatment Market Revenue Million Forecast, by Technology 2020 & 2033
- Table 6: Global Agricultural Wastewater Treatment Market Revenue Million Forecast, by Pollutant Source 2020 & 2033
- Table 7: Global Agricultural Wastewater Treatment Market Revenue Million Forecast, by Application 2020 & 2033
- Table 8: Global Agricultural Wastewater Treatment Market Revenue Million Forecast, by Country 2020 & 2033
- Table 9: China Agricultural Wastewater Treatment Market Revenue (Million) Forecast, by Application 2020 & 2033
- Table 10: India Agricultural Wastewater Treatment Market Revenue (Million) Forecast, by Application 2020 & 2033
- Table 11: Japan Agricultural Wastewater Treatment Market Revenue (Million) Forecast, by Application 2020 & 2033
- Table 12: South Korea Agricultural Wastewater Treatment Market Revenue (Million) Forecast, by Application 2020 & 2033
- Table 13: Rest of Asia Pacific Agricultural Wastewater Treatment Market Revenue (Million) Forecast, by Application 2020 & 2033
- Table 14: Global Agricultural Wastewater Treatment Market Revenue Million Forecast, by Technology 2020 & 2033
- Table 15: Global Agricultural Wastewater Treatment Market Revenue Million Forecast, by Pollutant Source 2020 & 2033
- Table 16: Global Agricultural Wastewater Treatment Market Revenue Million Forecast, by Application 2020 & 2033
- Table 17: Global Agricultural Wastewater Treatment Market Revenue Million Forecast, by Country 2020 & 2033
- Table 18: United States Agricultural Wastewater Treatment Market Revenue (Million) Forecast, by Application 2020 & 2033
- Table 19: Canada Agricultural Wastewater Treatment Market Revenue (Million) Forecast, by Application 2020 & 2033
- Table 20: Mexico Agricultural Wastewater Treatment Market Revenue (Million) Forecast, by Application 2020 & 2033
- Table 21: Global Agricultural Wastewater Treatment Market Revenue Million Forecast, by Technology 2020 & 2033
- Table 22: Global Agricultural Wastewater Treatment Market Revenue Million Forecast, by Pollutant Source 2020 & 2033
- Table 23: Global Agricultural Wastewater Treatment Market Revenue Million Forecast, by Application 2020 & 2033
- Table 24: Global Agricultural Wastewater Treatment Market Revenue Million Forecast, by Country 2020 & 2033
- Table 25: Germany Agricultural Wastewater Treatment Market Revenue (Million) Forecast, by Application 2020 & 2033
- Table 26: United Kingdom Agricultural Wastewater Treatment Market Revenue (Million) Forecast, by Application 2020 & 2033
- Table 27: France Agricultural Wastewater Treatment Market Revenue (Million) Forecast, by Application 2020 & 2033
- Table 28: Italy Agricultural Wastewater Treatment Market Revenue (Million) Forecast, by Application 2020 & 2033
- Table 29: Rest of Europe Agricultural Wastewater Treatment Market Revenue (Million) Forecast, by Application 2020 & 2033
- Table 30: Global Agricultural Wastewater Treatment Market Revenue Million Forecast, by Technology 2020 & 2033
- Table 31: Global Agricultural Wastewater Treatment Market Revenue Million Forecast, by Pollutant Source 2020 & 2033
- Table 32: Global Agricultural Wastewater Treatment Market Revenue Million Forecast, by Application 2020 & 2033
- Table 33: Global Agricultural Wastewater Treatment Market Revenue Million Forecast, by Country 2020 & 2033
- Table 34: Brazil Agricultural Wastewater Treatment Market Revenue (Million) Forecast, by Application 2020 & 2033
- Table 35: Argentina Agricultural Wastewater Treatment Market Revenue (Million) Forecast, by Application 2020 & 2033
- Table 36: Rest of South America Agricultural Wastewater Treatment Market Revenue (Million) Forecast, by Application 2020 & 2033
- Table 37: Global Agricultural Wastewater Treatment Market Revenue Million Forecast, by Technology 2020 & 2033
- Table 38: Global Agricultural Wastewater Treatment Market Revenue Million Forecast, by Pollutant Source 2020 & 2033
- Table 39: Global Agricultural Wastewater Treatment Market Revenue Million Forecast, by Application 2020 & 2033
- Table 40: Global Agricultural Wastewater Treatment Market Revenue Million Forecast, by Country 2020 & 2033
- Table 41: Saudi Arabia Agricultural Wastewater Treatment Market Revenue (Million) Forecast, by Application 2020 & 2033
- Table 42: South Africa Agricultural Wastewater Treatment Market Revenue (Million) Forecast, by Application 2020 & 2033
- Table 43: Rest of Middle East and Africa Agricultural Wastewater Treatment Market Revenue (Million) Forecast, by Application 2020 & 2033
Frequently Asked Questions
1. What is the projected Compound Annual Growth Rate (CAGR) of the Agricultural Wastewater Treatment Market?
The projected CAGR is approximately 4.75%.
2. Which companies are prominent players in the Agricultural Wastewater Treatment Market?
Key companies in the market include OriginClear, Nouryon, Lindsay Corporation, Evoqua Water Technologies LLC, Jacobs, Aquatech International LLC, BASF SE, IDE, SUEZ, DuPont, Organo Corporation, Veolia*List Not Exhaustive, AECOM, Louis Berger International.
3. What are the main segments of the Agricultural Wastewater Treatment Market?
The market segments include Technology, Pollutant Source, Application.
4. Can you provide details about the market size?
The market size is estimated to be USD 2.39 Million as of 2022.
5. What are some drivers contributing to market growth?
Rapidly Diminishing Fresh Water Resources; Rising Agricultural Water Demand; Other Drivers.
6. What are the notable trends driving market growth?
Non-Crop Segment to Dominate the Market.
7. Are there any restraints impacting market growth?
Dearth of Awareness regarding Agriculture Wastewater Treatment; Other Restraints.
8. Can you provide examples of recent developments in the market?
September 2022: Lanxess commissioned a new wastewater treatment plant at its Belgium Kallo/Antwerp site. The company invested around EUR 12 million (USD 12.65 million) in the plant, having a treatment capacity of around 260,000 liters of wastewater per hour.
9. What pricing options are available for accessing the report?
Pricing options include single-user, multi-user, and enterprise licenses priced at USD 4750, USD 5250, and USD 8750 respectively.
10. Is the market size provided in terms of value or volume?
The market size is provided in terms of value, measured in Million.
11. Are there any specific market keywords associated with the report?
Yes, the market keyword associated with the report is "Agricultural Wastewater Treatment Market," which aids in identifying and referencing the specific market segment covered.
12. How do I determine which pricing option suits my needs best?
The pricing options vary based on user requirements and access needs. Individual users may opt for single-user licenses, while businesses requiring broader access may choose multi-user or enterprise licenses for cost-effective access to the report.
13. Are there any additional resources or data provided in the Agricultural Wastewater Treatment Market report?
While the report offers comprehensive insights, it's advisable to review the specific contents or supplementary materials provided to ascertain if additional resources or data are available.
14. How can I stay updated on further developments or reports in the Agricultural Wastewater Treatment Market?
To stay informed about further developments, trends, and reports in the Agricultural Wastewater Treatment Market, consider subscribing to industry newsletters, following relevant companies and organizations, or regularly checking reputable industry news sources and publications.
Methodology
Step 1 - Identification of Relevant Samples Size from Population Database


Step 2 - Approaches for Defining Global Market Size (Value, Volume* & Price*)

Note*: In applicable scenarios
Step 3 - Data Sources
Primary Research
- Web Analytics
- Survey Reports
- Research Institute
- Latest Research Reports
- Opinion Leaders
Secondary Research
- Annual Reports
- White Paper
- Latest Press Release
- Industry Association
- Paid Database
- Investor Presentations

Step 4 - Data Triangulation
Involves using different sources of information in order to increase the validity of a study
These sources are likely to be stakeholders in a program - participants, other researchers, program staff, other community members, and so on.
Then we put all data in single framework & apply various statistical tools to find out the dynamic on the market.
During the analysis stage, feedback from the stakeholder groups would be compared to determine areas of agreement as well as areas of divergence