Emerging Agricultural Fumigants Industry Trends and Opportunities

Agricultural Fumigants Industry by Production Analysis, by Consumption Analysis, by Import Market Analysis (Value & Volume), by Export Market Analysis (Value & Volume), by Price Trend Analysis, by North America (United States, Canada, Mexico), by South America (Brazil, Argentina, Rest of South America), by Europe (United Kingdom, Germany, France, Italy, Spain, Russia, Benelux, Nordics, Rest of Europe), by Middle East & Africa (Turkey, Israel, GCC, North Africa, South Africa, Rest of Middle East & Africa), by Asia Pacific (China, India, Japan, South Korea, ASEAN, Oceania, Rest of Asia Pacific) Forecast 2025-2033

Jun 27 2025
Base Year: 2024

150 Pages
Main Logo

Emerging Agricultural Fumigants Industry Trends and Opportunities


Home
Industries
Agriculture
sponsor image

Tailored for you

  • In-depth Analysis Tailored to Specified Regions or Segments
  • Company Profiles Customized to User Preferences
  • Comprehensive Insights Focused on Specific Segments or Regions
  • Customized Evaluation of Competitive Landscape to Meet Your Needs
  • Tailored Customization to Address Other Specific Requirements
Ask for customization


Key Insights

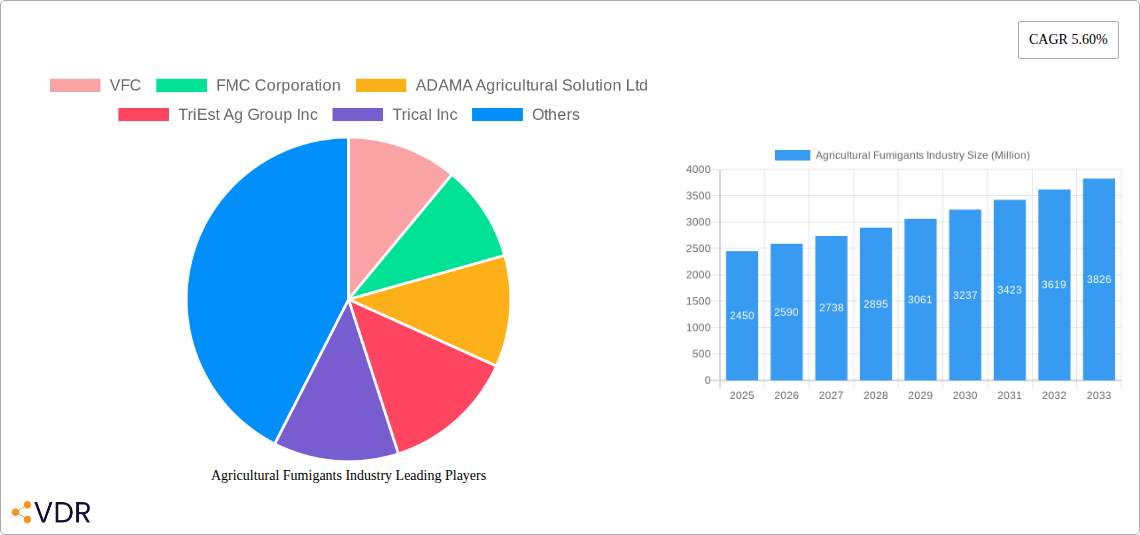
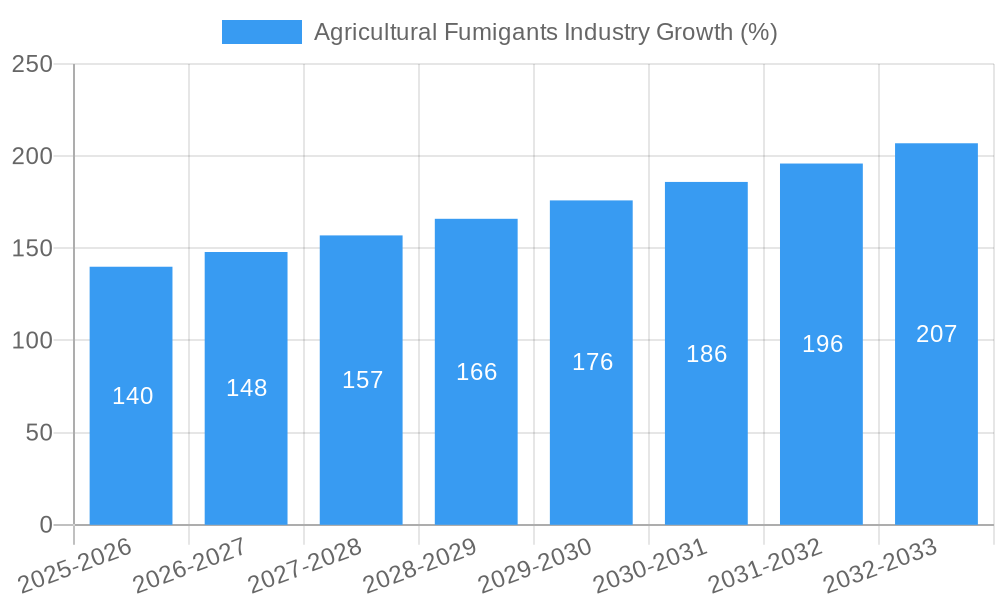
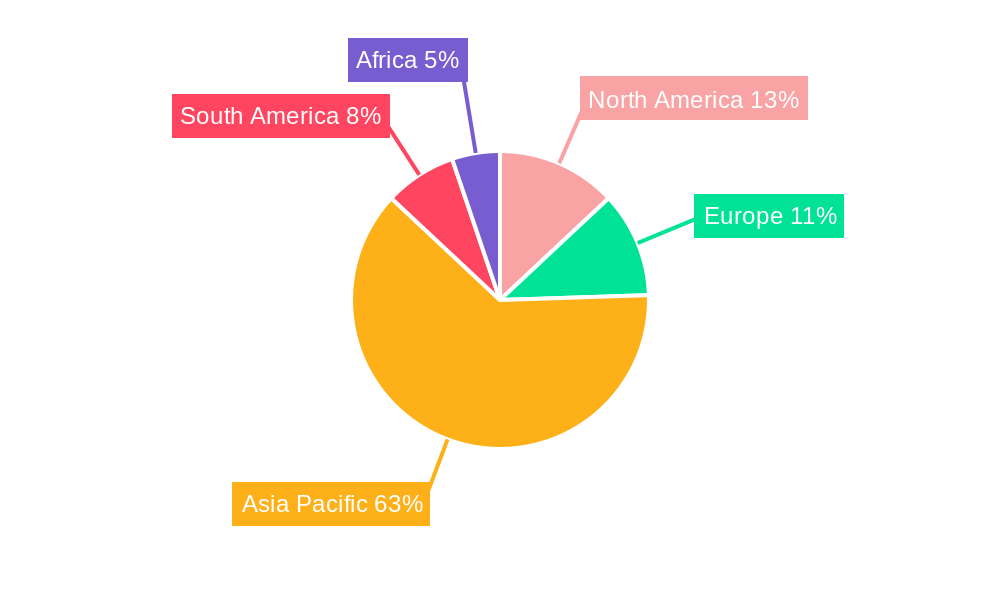
The global agricultural fumigants market, valued at $2.45 billion in 2025, is projected to experience robust growth, driven by the increasing demand for high-quality and disease-free agricultural produce. A Compound Annual Growth Rate (CAGR) of 5.60% is anticipated from 2025 to 2033, indicating a significant expansion of the market. Key drivers include the rising global population and the consequent surge in food demand, necessitating efficient pest and disease control methods. Furthermore, stringent regulations concerning food safety and the prevalence of soilborne diseases are bolstering the adoption of fumigants. The market is segmented by fumigant type (Methyl Bromide, Chloropicrin, Phosphine, Metam Sodium, 1,3-Dichloropropene, and other agricultural fumigants), method of application (soil, warehouse), and form (solid, liquid, gas). Crop-based applications currently dominate, but non-crop-based applications are witnessing significant growth. While concerns regarding environmental impact and the potential health risks associated with certain fumigants pose challenges, the development of safer and more environmentally friendly alternatives is creating new opportunities within the sector. The market's competitive landscape is characterized by both large multinational corporations and specialized fumigant providers. Regional growth is expected to vary, with Asia-Pacific anticipated to be a major contributor due to its large agricultural sector and growing demand for food security.

The continued growth of the agricultural fumigants market is significantly influenced by advancements in fumigation technology and the emergence of biofumigation techniques. Biofumigation, using naturally occurring substances to control pests and diseases, is gaining traction as a more environmentally sustainable alternative. However, the high initial investment costs associated with adopting new technologies and the need for specialized expertise might hinder the market's growth in certain regions. Furthermore, fluctuations in raw material prices and stringent government regulations related to the usage and disposal of fumigants can influence profitability and market dynamics. The market's future will likely be shaped by a combination of factors, including technological innovation, environmental concerns, and the evolving needs of the global agricultural sector. Companies are focusing on developing innovative products that balance efficacy with environmental safety, driving the industry's evolution.

Agricultural Fumigants Industry Research Report - Market Size, Growth & Forecast

Agricultural Fumigants Industry Market Report: 2019-2033

This comprehensive report provides a detailed analysis of the Agricultural Fumigants industry, encompassing market dynamics, growth trends, regional performance, product landscape, and key players. The study period covers 2019-2033, with a base year of 2025 and a forecast period of 2025-2033. The report offers invaluable insights for industry professionals, investors, and stakeholders seeking to understand and capitalize on the opportunities within this dynamic market. The total market value is predicted to reach xx Million by 2033.

Parent Market: Crop Protection Chemicals Child Market: Soil Fumigants

Agricultural Fumigants Industry Market Dynamics & Structure

This section analyzes the competitive landscape, technological advancements, regulatory influences, and market trends shaping the agricultural fumigants industry. The market is moderately consolidated, with several major players holding significant shares. Technological innovation is crucial, driven by the need for more effective, environmentally friendly fumigants. Stringent regulatory frameworks, particularly regarding Methyl Bromide, impact market growth and product development. The availability of substitute methods (e.g., biological control) presents a challenge.

  • Market Concentration: Moderately consolidated, with top 5 players holding approximately xx% market share in 2024.
  • Technological Innovation: Focus on developing less toxic and environmentally friendly alternatives to traditional fumigants. R&D investment is estimated at xx Million in 2024.
  • Regulatory Framework: Stringent regulations on the use of certain fumigants, particularly Methyl Bromide, due to environmental concerns. Compliance costs are estimated to be xx Million annually.
  • Competitive Substitutes: Biological control methods and other soil treatments are emerging as substitutes. Market penetration of substitutes is currently at xx%.
  • M&A Activity: A moderate level of mergers and acquisitions is observed, with approximately xx deals recorded between 2019 and 2024. Total deal value is estimated at xx Million.
  • End-User Demographics: Primarily large-scale commercial farms and agricultural businesses. Growing demand from emerging economies.

Agricultural Fumigants Industry Growth Trends & Insights

The agricultural fumigants market experienced steady growth during the historical period (2019-2024), driven by factors such as increasing crop production, pest resistance, and expanding agricultural land. The market is expected to maintain a healthy CAGR of xx% during the forecast period (2025-2033). Technological advancements, including the development of more effective and safer fumigants, are further accelerating market growth. Changing consumer preferences towards organically grown produce are creating opportunities for environmentally friendly fumigants. Market penetration of novel fumigants is projected to reach xx% by 2033.

Agricultural Fumigants Industry Growth

Dominant Regions, Countries, or Segments in Agricultural Fumigants Industry

North America and Asia-Pacific are the leading regions for agricultural fumigants consumption. Within these regions, specific countries like the US, China, and India demonstrate significant market dominance due to expansive agricultural lands, high crop production volumes, and supportive government policies. The Methyl Bromide segment holds the largest market share, although its growth is constrained by strict regulations. Soil application is the most prevalent method.

  • Leading Region: North America (xx% market share in 2024)
  • Leading Countries: USA, China, India
  • Leading Segment (Type): Methyl Bromide (xx% market share in 2024)
  • Leading Segment (Method of Application): Soil application (xx% market share in 2024)
  • Leading Segment (Form): Gas (xx% market share in 2024)
  • Leading Segment (Crop Application): Crop-based (xx% market share in 2024)
  • Key Drivers: Growing food demand, increasing pest resistance, favorable government policies, and infrastructure development.

Agricultural Fumigants Industry Product Landscape

The agricultural fumigants market offers a range of products, encompassing various active ingredients, application methods, and formulations. Recent innovations focus on reducing environmental impact and improving efficacy. Products are differentiated based on their target pests, application ease, and residual effects. The introduction of slow-release formulations and integrated pest management strategies is gaining traction.

Key Drivers, Barriers & Challenges in Agricultural Fumigants Industry

Key Drivers: Increasing global food demand, rising pest infestations, and government support for agricultural intensification. Technological advancements leading to the development of more effective and safer fumigants.

Challenges & Restraints: Stringent environmental regulations, high costs associated with application, potential health risks, and the availability of substitute pest control methods. The increasing awareness of potential health and environmental risks is leading to reduced usage in some regions.

Emerging Opportunities in Agricultural Fumigants Industry

Emerging opportunities lie in developing biofumigants and other environmentally benign alternatives. Untapped markets in developing countries with growing agricultural sectors present significant potential. The development of integrated pest management strategies combining fumigants with other control methods also offers promising opportunities.

Growth Accelerators in the Agricultural Fumigants Industry Industry

Technological advancements in formulation and delivery systems, strategic partnerships between chemical companies and agricultural businesses, and expansion into new geographic markets will be crucial growth catalysts. Focus on sustainable and environmentally friendly products will drive long-term market growth.

Key Players Shaping the Agricultural Fumigants Industry Market

  • VFC
  • FMC Corporation
  • ADAMA Agricultural Solutions Ltd
  • TriEst Ag Group Inc
  • Trical Inc
  • Fumigation Services
  • Ikeda Kogyo Co Ltd
  • Detia Degesch GmbH
  • DowDuPont (now Corteva Agriscience and Dow)
  • Lanxess
  • Isagro SpA
  • Syngenta AG
  • UPL Group
  • Industrial Fumigation Company
  • Amvac Chemical Corporation
  • Reddick Fumigants LLC
  • Cytec Solvay Group
  • BASF SE

Notable Milestones in Agricultural Fumigants Industry Sector

  • 2020: Introduction of a new, low-toxicity fumigant by FMC Corporation.
  • 2022: Acquisition of a smaller fumigant producer by Syngenta AG.
  • 2023: Implementation of stricter regulations on Methyl Bromide use in the EU.

In-Depth Agricultural Fumigants Industry Market Outlook

The agricultural fumigants market is poised for continued growth, driven by increasing food demand and the need for effective pest control. Opportunities exist in the development of sustainable and environmentally friendly products, as well as in expanding into emerging markets. Strategic partnerships and technological advancements will play a critical role in shaping the future of the industry. The market is projected to experience robust growth, exceeding xx Million by 2033.

Agricultural Fumigants Industry Segmentation

  • 1. Production Analysis
  • 2. Consumption Analysis
  • 3. Import Market Analysis (Value & Volume)
  • 4. Export Market Analysis (Value & Volume)
  • 5. Price Trend Analysis

Agricultural Fumigants Industry Segmentation By Geography

  • 1. North America
    • 1.1. United States
    • 1.2. Canada
    • 1.3. Mexico
  • 2. South America
    • 2.1. Brazil
    • 2.2. Argentina
    • 2.3. Rest of South America
  • 3. Europe
    • 3.1. United Kingdom
    • 3.2. Germany
    • 3.3. France
    • 3.4. Italy
    • 3.5. Spain
    • 3.6. Russia
    • 3.7. Benelux
    • 3.8. Nordics
    • 3.9. Rest of Europe
  • 4. Middle East & Africa
    • 4.1. Turkey
    • 4.2. Israel
    • 4.3. GCC
    • 4.4. North Africa
    • 4.5. South Africa
    • 4.6. Rest of Middle East & Africa
  • 5. Asia Pacific
    • 5.1. China
    • 5.2. India
    • 5.3. Japan
    • 5.4. South Korea
    • 5.5. ASEAN
    • 5.6. Oceania
    • 5.7. Rest of Asia Pacific
Agricultural Fumigants Industry Regional Share


Agricultural Fumigants Industry REPORT HIGHLIGHTS

AspectsDetails
Study Period 2019-2033
Base Year 2024
Estimated Year 2025
Forecast Period2025-2033
Historical Period2019-2024
Growth RateCAGR of 5.60% from 2019-2033
Segmentation
    • By Production Analysis
    • By Consumption Analysis
    • By Import Market Analysis (Value & Volume)
    • By Export Market Analysis (Value & Volume)
    • By Price Trend Analysis
  • By Geography
    • North America
      • United States
      • Canada
      • Mexico
    • South America
      • Brazil
      • Argentina
      • Rest of South America
    • Europe
      • United Kingdom
      • Germany
      • France
      • Italy
      • Spain
      • Russia
      • Benelux
      • Nordics
      • Rest of Europe
    • Middle East & Africa
      • Turkey
      • Israel
      • GCC
      • North Africa
      • South Africa
      • Rest of Middle East & Africa
    • Asia Pacific
      • China
      • India
      • Japan
      • South Korea
      • ASEAN
      • Oceania
      • Rest of Asia Pacific


Table of Contents

  1. 1. Introduction
    • 1.1. Research Scope
    • 1.2. Market Segmentation
    • 1.3. Research Methodology
    • 1.4. Definitions and Assumptions
  2. 2. Executive Summary
    • 2.1. Introduction
  3. 3. Market Dynamics
    • 3.1. Introduction
      • 3.2. Market Drivers
        • 3.2.1. Low Availability of Skilled Labor; Technological Advancements
      • 3.3. Market Restrains
        • 3.3.1. Increasing Farm Expenditure; Security Concerns in Modern Farming Machinery
      • 3.4. Market Trends
        • 3.4.1. Growing Agricultural Production
  4. 4. Market Factor Analysis
    • 4.1. Porters Five Forces
    • 4.2. Supply/Value Chain
    • 4.3. PESTEL analysis
    • 4.4. Market Entropy
    • 4.5. Patent/Trademark Analysis
  5. 5. Global Agricultural Fumigants Industry Analysis, Insights and Forecast, 2019-2031
    • 5.1. Market Analysis, Insights and Forecast - by Production Analysis
      • 5.2. Market Analysis, Insights and Forecast - by Consumption Analysis
        • 5.3. Market Analysis, Insights and Forecast - by Import Market Analysis (Value & Volume)
          • 5.4. Market Analysis, Insights and Forecast - by Export Market Analysis (Value & Volume)
            • 5.5. Market Analysis, Insights and Forecast - by Price Trend Analysis
              • 5.6. Market Analysis, Insights and Forecast - by Region
                • 5.6.1. North America
                • 5.6.2. South America
                • 5.6.3. Europe
                • 5.6.4. Middle East & Africa
                • 5.6.5. Asia Pacific
            • 6. North America Agricultural Fumigants Industry Analysis, Insights and Forecast, 2019-2031
              • 6.1. Market Analysis, Insights and Forecast - by Production Analysis
                • 6.2. Market Analysis, Insights and Forecast - by Consumption Analysis
                  • 6.3. Market Analysis, Insights and Forecast - by Import Market Analysis (Value & Volume)
                    • 6.4. Market Analysis, Insights and Forecast - by Export Market Analysis (Value & Volume)
                      • 6.5. Market Analysis, Insights and Forecast - by Price Trend Analysis
                      • 7. South America Agricultural Fumigants Industry Analysis, Insights and Forecast, 2019-2031
                        • 7.1. Market Analysis, Insights and Forecast - by Production Analysis
                          • 7.2. Market Analysis, Insights and Forecast - by Consumption Analysis
                            • 7.3. Market Analysis, Insights and Forecast - by Import Market Analysis (Value & Volume)
                              • 7.4. Market Analysis, Insights and Forecast - by Export Market Analysis (Value & Volume)
                                • 7.5. Market Analysis, Insights and Forecast - by Price Trend Analysis
                                • 8. Europe Agricultural Fumigants Industry Analysis, Insights and Forecast, 2019-2031
                                  • 8.1. Market Analysis, Insights and Forecast - by Production Analysis
                                    • 8.2. Market Analysis, Insights and Forecast - by Consumption Analysis
                                      • 8.3. Market Analysis, Insights and Forecast - by Import Market Analysis (Value & Volume)
                                        • 8.4. Market Analysis, Insights and Forecast - by Export Market Analysis (Value & Volume)
                                          • 8.5. Market Analysis, Insights and Forecast - by Price Trend Analysis
                                          • 9. Middle East & Africa Agricultural Fumigants Industry Analysis, Insights and Forecast, 2019-2031
                                            • 9.1. Market Analysis, Insights and Forecast - by Production Analysis
                                              • 9.2. Market Analysis, Insights and Forecast - by Consumption Analysis
                                                • 9.3. Market Analysis, Insights and Forecast - by Import Market Analysis (Value & Volume)
                                                  • 9.4. Market Analysis, Insights and Forecast - by Export Market Analysis (Value & Volume)
                                                    • 9.5. Market Analysis, Insights and Forecast - by Price Trend Analysis
                                                    • 10. Asia Pacific Agricultural Fumigants Industry Analysis, Insights and Forecast, 2019-2031
                                                      • 10.1. Market Analysis, Insights and Forecast - by Production Analysis
                                                        • 10.2. Market Analysis, Insights and Forecast - by Consumption Analysis
                                                          • 10.3. Market Analysis, Insights and Forecast - by Import Market Analysis (Value & Volume)
                                                            • 10.4. Market Analysis, Insights and Forecast - by Export Market Analysis (Value & Volume)
                                                              • 10.5. Market Analysis, Insights and Forecast - by Price Trend Analysis
                                                              • 11. North America Agricultural Fumigants Industry Analysis, Insights and Forecast, 2019-2031
                                                                  • 11.1. Market Analysis, Insights and Forecast - By Country/Sub-region
                                                                    • 11.1.1 United States
                                                                    • 11.1.2 Canada
                                                                    • 11.1.3 Mexico
                                                                    • 11.1.4 Rest of North America
                                                              • 12. Europe Agricultural Fumigants Industry Analysis, Insights and Forecast, 2019-2031
                                                                  • 12.1. Market Analysis, Insights and Forecast - By Country/Sub-region
                                                                    • 12.1.1 Germany
                                                                    • 12.1.2 United Kingdom
                                                                    • 12.1.3 France
                                                                    • 12.1.4 Russia
                                                                    • 12.1.5 Spain
                                                                    • 12.1.6 Italy
                                                                    • 12.1.7 Rest of Europe
                                                              • 13. Asia Pacific Agricultural Fumigants Industry Analysis, Insights and Forecast, 2019-2031
                                                                  • 13.1. Market Analysis, Insights and Forecast - By Country/Sub-region
                                                                    • 13.1.1 China
                                                                    • 13.1.2 Japan
                                                                    • 13.1.3 India
                                                                    • 13.1.4 Australia
                                                                    • 13.1.5 Rest of Asia Pacific
                                                              • 14. South America Agricultural Fumigants Industry Analysis, Insights and Forecast, 2019-2031
                                                                  • 14.1. Market Analysis, Insights and Forecast - By Country/Sub-region
                                                                    • 14.1.1 Brazil
                                                                    • 14.1.2 Argentina
                                                                    • 14.1.3 Rest of South America
                                                              • 15. Africa Agricultural Fumigants Industry Analysis, Insights and Forecast, 2019-2031
                                                                  • 15.1. Market Analysis, Insights and Forecast - By Country/Sub-region
                                                                    • 15.1.1 South Africa
                                                                    • 15.1.2 Rest of Africa
                                                              • 16. Competitive Analysis
                                                                • 16.1. Global Market Share Analysis 2024
                                                                  • 16.2. Company Profiles
                                                                    • 16.2.1 VFC
                                                                      • 16.2.1.1. Overview
                                                                      • 16.2.1.2. Products
                                                                      • 16.2.1.3. SWOT Analysis
                                                                      • 16.2.1.4. Recent Developments
                                                                      • 16.2.1.5. Financials (Based on Availability)
                                                                    • 16.2.2 FMC Corporation
                                                                      • 16.2.2.1. Overview
                                                                      • 16.2.2.2. Products
                                                                      • 16.2.2.3. SWOT Analysis
                                                                      • 16.2.2.4. Recent Developments
                                                                      • 16.2.2.5. Financials (Based on Availability)
                                                                    • 16.2.3 ADAMA Agricultural Solution Ltd
                                                                      • 16.2.3.1. Overview
                                                                      • 16.2.3.2. Products
                                                                      • 16.2.3.3. SWOT Analysis
                                                                      • 16.2.3.4. Recent Developments
                                                                      • 16.2.3.5. Financials (Based on Availability)
                                                                    • 16.2.4 TriEst Ag Group Inc
                                                                      • 16.2.4.1. Overview
                                                                      • 16.2.4.2. Products
                                                                      • 16.2.4.3. SWOT Analysis
                                                                      • 16.2.4.4. Recent Developments
                                                                      • 16.2.4.5. Financials (Based on Availability)
                                                                    • 16.2.5 Trical Inc
                                                                      • 16.2.5.1. Overview
                                                                      • 16.2.5.2. Products
                                                                      • 16.2.5.3. SWOT Analysis
                                                                      • 16.2.5.4. Recent Developments
                                                                      • 16.2.5.5. Financials (Based on Availability)
                                                                    • 16.2.6 Fumigation Services
                                                                      • 16.2.6.1. Overview
                                                                      • 16.2.6.2. Products
                                                                      • 16.2.6.3. SWOT Analysis
                                                                      • 16.2.6.4. Recent Developments
                                                                      • 16.2.6.5. Financials (Based on Availability)
                                                                    • 16.2.7 Ikeda Kogyo Co Ltd
                                                                      • 16.2.7.1. Overview
                                                                      • 16.2.7.2. Products
                                                                      • 16.2.7.3. SWOT Analysis
                                                                      • 16.2.7.4. Recent Developments
                                                                      • 16.2.7.5. Financials (Based on Availability)
                                                                    • 16.2.8 Detia Degesch GmbH
                                                                      • 16.2.8.1. Overview
                                                                      • 16.2.8.2. Products
                                                                      • 16.2.8.3. SWOT Analysis
                                                                      • 16.2.8.4. Recent Developments
                                                                      • 16.2.8.5. Financials (Based on Availability)
                                                                    • 16.2.9 DowDuPont
                                                                      • 16.2.9.1. Overview
                                                                      • 16.2.9.2. Products
                                                                      • 16.2.9.3. SWOT Analysis
                                                                      • 16.2.9.4. Recent Developments
                                                                      • 16.2.9.5. Financials (Based on Availability)
                                                                    • 16.2.10 Lanxess
                                                                      • 16.2.10.1. Overview
                                                                      • 16.2.10.2. Products
                                                                      • 16.2.10.3. SWOT Analysis
                                                                      • 16.2.10.4. Recent Developments
                                                                      • 16.2.10.5. Financials (Based on Availability)
                                                                    • 16.2.11 Isagro SpA
                                                                      • 16.2.11.1. Overview
                                                                      • 16.2.11.2. Products
                                                                      • 16.2.11.3. SWOT Analysis
                                                                      • 16.2.11.4. Recent Developments
                                                                      • 16.2.11.5. Financials (Based on Availability)
                                                                    • 16.2.12 Syngenta AG
                                                                      • 16.2.12.1. Overview
                                                                      • 16.2.12.2. Products
                                                                      • 16.2.12.3. SWOT Analysis
                                                                      • 16.2.12.4. Recent Developments
                                                                      • 16.2.12.5. Financials (Based on Availability)
                                                                    • 16.2.13 UPL Group
                                                                      • 16.2.13.1. Overview
                                                                      • 16.2.13.2. Products
                                                                      • 16.2.13.3. SWOT Analysis
                                                                      • 16.2.13.4. Recent Developments
                                                                      • 16.2.13.5. Financials (Based on Availability)
                                                                    • 16.2.14 Industrial Fumigation Compan
                                                                      • 16.2.14.1. Overview
                                                                      • 16.2.14.2. Products
                                                                      • 16.2.14.3. SWOT Analysis
                                                                      • 16.2.14.4. Recent Developments
                                                                      • 16.2.14.5. Financials (Based on Availability)
                                                                    • 16.2.15 Industrial Fumigation Company
                                                                      • 16.2.15.1. Overview
                                                                      • 16.2.15.2. Products
                                                                      • 16.2.15.3. SWOT Analysis
                                                                      • 16.2.15.4. Recent Developments
                                                                      • 16.2.15.5. Financials (Based on Availability)
                                                                    • 16.2.16 Amvac Chemical Corporation
                                                                      • 16.2.16.1. Overview
                                                                      • 16.2.16.2. Products
                                                                      • 16.2.16.3. SWOT Analysis
                                                                      • 16.2.16.4. Recent Developments
                                                                      • 16.2.16.5. Financials (Based on Availability)
                                                                    • 16.2.17 Reddick Fumigants LLC
                                                                      • 16.2.17.1. Overview
                                                                      • 16.2.17.2. Products
                                                                      • 16.2.17.3. SWOT Analysis
                                                                      • 16.2.17.4. Recent Developments
                                                                      • 16.2.17.5. Financials (Based on Availability)
                                                                    • 16.2.18 Cytec Solvay Group
                                                                      • 16.2.18.1. Overview
                                                                      • 16.2.18.2. Products
                                                                      • 16.2.18.3. SWOT Analysis
                                                                      • 16.2.18.4. Recent Developments
                                                                      • 16.2.18.5. Financials (Based on Availability)
                                                                    • 16.2.19 BASF SE
                                                                      • 16.2.19.1. Overview
                                                                      • 16.2.19.2. Products
                                                                      • 16.2.19.3. SWOT Analysis
                                                                      • 16.2.19.4. Recent Developments
                                                                      • 16.2.19.5. Financials (Based on Availability)

                                                              List of Figures

                                                              1. Figure 1: Global Agricultural Fumigants Industry Revenue Breakdown (Million, %) by Region 2024 & 2032
                                                              2. Figure 2: North America Agricultural Fumigants Industry Revenue (Million), by Country 2024 & 2032
                                                              3. Figure 3: North America Agricultural Fumigants Industry Revenue Share (%), by Country 2024 & 2032
                                                              4. Figure 4: Europe Agricultural Fumigants Industry Revenue (Million), by Country 2024 & 2032
                                                              5. Figure 5: Europe Agricultural Fumigants Industry Revenue Share (%), by Country 2024 & 2032
                                                              6. Figure 6: Asia Pacific Agricultural Fumigants Industry Revenue (Million), by Country 2024 & 2032
                                                              7. Figure 7: Asia Pacific Agricultural Fumigants Industry Revenue Share (%), by Country 2024 & 2032
                                                              8. Figure 8: South America Agricultural Fumigants Industry Revenue (Million), by Country 2024 & 2032
                                                              9. Figure 9: South America Agricultural Fumigants Industry Revenue Share (%), by Country 2024 & 2032
                                                              10. Figure 10: Africa Agricultural Fumigants Industry Revenue (Million), by Country 2024 & 2032
                                                              11. Figure 11: Africa Agricultural Fumigants Industry Revenue Share (%), by Country 2024 & 2032
                                                              12. Figure 12: North America Agricultural Fumigants Industry Revenue (Million), by Production Analysis 2024 & 2032
                                                              13. Figure 13: North America Agricultural Fumigants Industry Revenue Share (%), by Production Analysis 2024 & 2032
                                                              14. Figure 14: North America Agricultural Fumigants Industry Revenue (Million), by Consumption Analysis 2024 & 2032
                                                              15. Figure 15: North America Agricultural Fumigants Industry Revenue Share (%), by Consumption Analysis 2024 & 2032
                                                              16. Figure 16: North America Agricultural Fumigants Industry Revenue (Million), by Import Market Analysis (Value & Volume) 2024 & 2032
                                                              17. Figure 17: North America Agricultural Fumigants Industry Revenue Share (%), by Import Market Analysis (Value & Volume) 2024 & 2032
                                                              18. Figure 18: North America Agricultural Fumigants Industry Revenue (Million), by Export Market Analysis (Value & Volume) 2024 & 2032
                                                              19. Figure 19: North America Agricultural Fumigants Industry Revenue Share (%), by Export Market Analysis (Value & Volume) 2024 & 2032
                                                              20. Figure 20: North America Agricultural Fumigants Industry Revenue (Million), by Price Trend Analysis 2024 & 2032
                                                              21. Figure 21: North America Agricultural Fumigants Industry Revenue Share (%), by Price Trend Analysis 2024 & 2032
                                                              22. Figure 22: North America Agricultural Fumigants Industry Revenue (Million), by Country 2024 & 2032
                                                              23. Figure 23: North America Agricultural Fumigants Industry Revenue Share (%), by Country 2024 & 2032
                                                              24. Figure 24: South America Agricultural Fumigants Industry Revenue (Million), by Production Analysis 2024 & 2032
                                                              25. Figure 25: South America Agricultural Fumigants Industry Revenue Share (%), by Production Analysis 2024 & 2032
                                                              26. Figure 26: South America Agricultural Fumigants Industry Revenue (Million), by Consumption Analysis 2024 & 2032
                                                              27. Figure 27: South America Agricultural Fumigants Industry Revenue Share (%), by Consumption Analysis 2024 & 2032
                                                              28. Figure 28: South America Agricultural Fumigants Industry Revenue (Million), by Import Market Analysis (Value & Volume) 2024 & 2032
                                                              29. Figure 29: South America Agricultural Fumigants Industry Revenue Share (%), by Import Market Analysis (Value & Volume) 2024 & 2032
                                                              30. Figure 30: South America Agricultural Fumigants Industry Revenue (Million), by Export Market Analysis (Value & Volume) 2024 & 2032
                                                              31. Figure 31: South America Agricultural Fumigants Industry Revenue Share (%), by Export Market Analysis (Value & Volume) 2024 & 2032
                                                              32. Figure 32: South America Agricultural Fumigants Industry Revenue (Million), by Price Trend Analysis 2024 & 2032
                                                              33. Figure 33: South America Agricultural Fumigants Industry Revenue Share (%), by Price Trend Analysis 2024 & 2032
                                                              34. Figure 34: South America Agricultural Fumigants Industry Revenue (Million), by Country 2024 & 2032
                                                              35. Figure 35: South America Agricultural Fumigants Industry Revenue Share (%), by Country 2024 & 2032
                                                              36. Figure 36: Europe Agricultural Fumigants Industry Revenue (Million), by Production Analysis 2024 & 2032
                                                              37. Figure 37: Europe Agricultural Fumigants Industry Revenue Share (%), by Production Analysis 2024 & 2032
                                                              38. Figure 38: Europe Agricultural Fumigants Industry Revenue (Million), by Consumption Analysis 2024 & 2032
                                                              39. Figure 39: Europe Agricultural Fumigants Industry Revenue Share (%), by Consumption Analysis 2024 & 2032
                                                              40. Figure 40: Europe Agricultural Fumigants Industry Revenue (Million), by Import Market Analysis (Value & Volume) 2024 & 2032
                                                              41. Figure 41: Europe Agricultural Fumigants Industry Revenue Share (%), by Import Market Analysis (Value & Volume) 2024 & 2032
                                                              42. Figure 42: Europe Agricultural Fumigants Industry Revenue (Million), by Export Market Analysis (Value & Volume) 2024 & 2032
                                                              43. Figure 43: Europe Agricultural Fumigants Industry Revenue Share (%), by Export Market Analysis (Value & Volume) 2024 & 2032
                                                              44. Figure 44: Europe Agricultural Fumigants Industry Revenue (Million), by Price Trend Analysis 2024 & 2032
                                                              45. Figure 45: Europe Agricultural Fumigants Industry Revenue Share (%), by Price Trend Analysis 2024 & 2032
                                                              46. Figure 46: Europe Agricultural Fumigants Industry Revenue (Million), by Country 2024 & 2032
                                                              47. Figure 47: Europe Agricultural Fumigants Industry Revenue Share (%), by Country 2024 & 2032
                                                              48. Figure 48: Middle East & Africa Agricultural Fumigants Industry Revenue (Million), by Production Analysis 2024 & 2032
                                                              49. Figure 49: Middle East & Africa Agricultural Fumigants Industry Revenue Share (%), by Production Analysis 2024 & 2032
                                                              50. Figure 50: Middle East & Africa Agricultural Fumigants Industry Revenue (Million), by Consumption Analysis 2024 & 2032
                                                              51. Figure 51: Middle East & Africa Agricultural Fumigants Industry Revenue Share (%), by Consumption Analysis 2024 & 2032
                                                              52. Figure 52: Middle East & Africa Agricultural Fumigants Industry Revenue (Million), by Import Market Analysis (Value & Volume) 2024 & 2032
                                                              53. Figure 53: Middle East & Africa Agricultural Fumigants Industry Revenue Share (%), by Import Market Analysis (Value & Volume) 2024 & 2032
                                                              54. Figure 54: Middle East & Africa Agricultural Fumigants Industry Revenue (Million), by Export Market Analysis (Value & Volume) 2024 & 2032
                                                              55. Figure 55: Middle East & Africa Agricultural Fumigants Industry Revenue Share (%), by Export Market Analysis (Value & Volume) 2024 & 2032
                                                              56. Figure 56: Middle East & Africa Agricultural Fumigants Industry Revenue (Million), by Price Trend Analysis 2024 & 2032
                                                              57. Figure 57: Middle East & Africa Agricultural Fumigants Industry Revenue Share (%), by Price Trend Analysis 2024 & 2032
                                                              58. Figure 58: Middle East & Africa Agricultural Fumigants Industry Revenue (Million), by Country 2024 & 2032
                                                              59. Figure 59: Middle East & Africa Agricultural Fumigants Industry Revenue Share (%), by Country 2024 & 2032
                                                              60. Figure 60: Asia Pacific Agricultural Fumigants Industry Revenue (Million), by Production Analysis 2024 & 2032
                                                              61. Figure 61: Asia Pacific Agricultural Fumigants Industry Revenue Share (%), by Production Analysis 2024 & 2032
                                                              62. Figure 62: Asia Pacific Agricultural Fumigants Industry Revenue (Million), by Consumption Analysis 2024 & 2032
                                                              63. Figure 63: Asia Pacific Agricultural Fumigants Industry Revenue Share (%), by Consumption Analysis 2024 & 2032
                                                              64. Figure 64: Asia Pacific Agricultural Fumigants Industry Revenue (Million), by Import Market Analysis (Value & Volume) 2024 & 2032
                                                              65. Figure 65: Asia Pacific Agricultural Fumigants Industry Revenue Share (%), by Import Market Analysis (Value & Volume) 2024 & 2032
                                                              66. Figure 66: Asia Pacific Agricultural Fumigants Industry Revenue (Million), by Export Market Analysis (Value & Volume) 2024 & 2032
                                                              67. Figure 67: Asia Pacific Agricultural Fumigants Industry Revenue Share (%), by Export Market Analysis (Value & Volume) 2024 & 2032
                                                              68. Figure 68: Asia Pacific Agricultural Fumigants Industry Revenue (Million), by Price Trend Analysis 2024 & 2032
                                                              69. Figure 69: Asia Pacific Agricultural Fumigants Industry Revenue Share (%), by Price Trend Analysis 2024 & 2032
                                                              70. Figure 70: Asia Pacific Agricultural Fumigants Industry Revenue (Million), by Country 2024 & 2032
                                                              71. Figure 71: Asia Pacific Agricultural Fumigants Industry Revenue Share (%), by Country 2024 & 2032

                                                              List of Tables

                                                              1. Table 1: Global Agricultural Fumigants Industry Revenue Million Forecast, by Region 2019 & 2032
                                                              2. Table 2: Global Agricultural Fumigants Industry Revenue Million Forecast, by Production Analysis 2019 & 2032
                                                              3. Table 3: Global Agricultural Fumigants Industry Revenue Million Forecast, by Consumption Analysis 2019 & 2032
                                                              4. Table 4: Global Agricultural Fumigants Industry Revenue Million Forecast, by Import Market Analysis (Value & Volume) 2019 & 2032
                                                              5. Table 5: Global Agricultural Fumigants Industry Revenue Million Forecast, by Export Market Analysis (Value & Volume) 2019 & 2032
                                                              6. Table 6: Global Agricultural Fumigants Industry Revenue Million Forecast, by Price Trend Analysis 2019 & 2032
                                                              7. Table 7: Global Agricultural Fumigants Industry Revenue Million Forecast, by Region 2019 & 2032
                                                              8. Table 8: Global Agricultural Fumigants Industry Revenue Million Forecast, by Country 2019 & 2032
                                                              9. Table 9: United States Agricultural Fumigants Industry Revenue (Million) Forecast, by Application 2019 & 2032
                                                              10. Table 10: Canada Agricultural Fumigants Industry Revenue (Million) Forecast, by Application 2019 & 2032
                                                              11. Table 11: Mexico Agricultural Fumigants Industry Revenue (Million) Forecast, by Application 2019 & 2032
                                                              12. Table 12: Rest of North America Agricultural Fumigants Industry Revenue (Million) Forecast, by Application 2019 & 2032
                                                              13. Table 13: Global Agricultural Fumigants Industry Revenue Million Forecast, by Country 2019 & 2032
                                                              14. Table 14: Germany Agricultural Fumigants Industry Revenue (Million) Forecast, by Application 2019 & 2032
                                                              15. Table 15: United Kingdom Agricultural Fumigants Industry Revenue (Million) Forecast, by Application 2019 & 2032
                                                              16. Table 16: France Agricultural Fumigants Industry Revenue (Million) Forecast, by Application 2019 & 2032
                                                              17. Table 17: Russia Agricultural Fumigants Industry Revenue (Million) Forecast, by Application 2019 & 2032
                                                              18. Table 18: Spain Agricultural Fumigants Industry Revenue (Million) Forecast, by Application 2019 & 2032
                                                              19. Table 19: Italy Agricultural Fumigants Industry Revenue (Million) Forecast, by Application 2019 & 2032
                                                              20. Table 20: Rest of Europe Agricultural Fumigants Industry Revenue (Million) Forecast, by Application 2019 & 2032
                                                              21. Table 21: Global Agricultural Fumigants Industry Revenue Million Forecast, by Country 2019 & 2032
                                                              22. Table 22: China Agricultural Fumigants Industry Revenue (Million) Forecast, by Application 2019 & 2032
                                                              23. Table 23: Japan Agricultural Fumigants Industry Revenue (Million) Forecast, by Application 2019 & 2032
                                                              24. Table 24: India Agricultural Fumigants Industry Revenue (Million) Forecast, by Application 2019 & 2032
                                                              25. Table 25: Australia Agricultural Fumigants Industry Revenue (Million) Forecast, by Application 2019 & 2032
                                                              26. Table 26: Rest of Asia Pacific Agricultural Fumigants Industry Revenue (Million) Forecast, by Application 2019 & 2032
                                                              27. Table 27: Global Agricultural Fumigants Industry Revenue Million Forecast, by Country 2019 & 2032
                                                              28. Table 28: Brazil Agricultural Fumigants Industry Revenue (Million) Forecast, by Application 2019 & 2032
                                                              29. Table 29: Argentina Agricultural Fumigants Industry Revenue (Million) Forecast, by Application 2019 & 2032
                                                              30. Table 30: Rest of South America Agricultural Fumigants Industry Revenue (Million) Forecast, by Application 2019 & 2032
                                                              31. Table 31: Global Agricultural Fumigants Industry Revenue Million Forecast, by Country 2019 & 2032
                                                              32. Table 32: South Africa Agricultural Fumigants Industry Revenue (Million) Forecast, by Application 2019 & 2032
                                                              33. Table 33: Rest of Africa Agricultural Fumigants Industry Revenue (Million) Forecast, by Application 2019 & 2032
                                                              34. Table 34: Global Agricultural Fumigants Industry Revenue Million Forecast, by Production Analysis 2019 & 2032
                                                              35. Table 35: Global Agricultural Fumigants Industry Revenue Million Forecast, by Consumption Analysis 2019 & 2032
                                                              36. Table 36: Global Agricultural Fumigants Industry Revenue Million Forecast, by Import Market Analysis (Value & Volume) 2019 & 2032
                                                              37. Table 37: Global Agricultural Fumigants Industry Revenue Million Forecast, by Export Market Analysis (Value & Volume) 2019 & 2032
                                                              38. Table 38: Global Agricultural Fumigants Industry Revenue Million Forecast, by Price Trend Analysis 2019 & 2032
                                                              39. Table 39: Global Agricultural Fumigants Industry Revenue Million Forecast, by Country 2019 & 2032
                                                              40. Table 40: United States Agricultural Fumigants Industry Revenue (Million) Forecast, by Application 2019 & 2032
                                                              41. Table 41: Canada Agricultural Fumigants Industry Revenue (Million) Forecast, by Application 2019 & 2032
                                                              42. Table 42: Mexico Agricultural Fumigants Industry Revenue (Million) Forecast, by Application 2019 & 2032
                                                              43. Table 43: Global Agricultural Fumigants Industry Revenue Million Forecast, by Production Analysis 2019 & 2032
                                                              44. Table 44: Global Agricultural Fumigants Industry Revenue Million Forecast, by Consumption Analysis 2019 & 2032
                                                              45. Table 45: Global Agricultural Fumigants Industry Revenue Million Forecast, by Import Market Analysis (Value & Volume) 2019 & 2032
                                                              46. Table 46: Global Agricultural Fumigants Industry Revenue Million Forecast, by Export Market Analysis (Value & Volume) 2019 & 2032
                                                              47. Table 47: Global Agricultural Fumigants Industry Revenue Million Forecast, by Price Trend Analysis 2019 & 2032
                                                              48. Table 48: Global Agricultural Fumigants Industry Revenue Million Forecast, by Country 2019 & 2032
                                                              49. Table 49: Brazil Agricultural Fumigants Industry Revenue (Million) Forecast, by Application 2019 & 2032
                                                              50. Table 50: Argentina Agricultural Fumigants Industry Revenue (Million) Forecast, by Application 2019 & 2032
                                                              51. Table 51: Rest of South America Agricultural Fumigants Industry Revenue (Million) Forecast, by Application 2019 & 2032
                                                              52. Table 52: Global Agricultural Fumigants Industry Revenue Million Forecast, by Production Analysis 2019 & 2032
                                                              53. Table 53: Global Agricultural Fumigants Industry Revenue Million Forecast, by Consumption Analysis 2019 & 2032
                                                              54. Table 54: Global Agricultural Fumigants Industry Revenue Million Forecast, by Import Market Analysis (Value & Volume) 2019 & 2032
                                                              55. Table 55: Global Agricultural Fumigants Industry Revenue Million Forecast, by Export Market Analysis (Value & Volume) 2019 & 2032
                                                              56. Table 56: Global Agricultural Fumigants Industry Revenue Million Forecast, by Price Trend Analysis 2019 & 2032
                                                              57. Table 57: Global Agricultural Fumigants Industry Revenue Million Forecast, by Country 2019 & 2032
                                                              58. Table 58: United Kingdom Agricultural Fumigants Industry Revenue (Million) Forecast, by Application 2019 & 2032
                                                              59. Table 59: Germany Agricultural Fumigants Industry Revenue (Million) Forecast, by Application 2019 & 2032
                                                              60. Table 60: France Agricultural Fumigants Industry Revenue (Million) Forecast, by Application 2019 & 2032
                                                              61. Table 61: Italy Agricultural Fumigants Industry Revenue (Million) Forecast, by Application 2019 & 2032
                                                              62. Table 62: Spain Agricultural Fumigants Industry Revenue (Million) Forecast, by Application 2019 & 2032
                                                              63. Table 63: Russia Agricultural Fumigants Industry Revenue (Million) Forecast, by Application 2019 & 2032
                                                              64. Table 64: Benelux Agricultural Fumigants Industry Revenue (Million) Forecast, by Application 2019 & 2032
                                                              65. Table 65: Nordics Agricultural Fumigants Industry Revenue (Million) Forecast, by Application 2019 & 2032
                                                              66. Table 66: Rest of Europe Agricultural Fumigants Industry Revenue (Million) Forecast, by Application 2019 & 2032
                                                              67. Table 67: Global Agricultural Fumigants Industry Revenue Million Forecast, by Production Analysis 2019 & 2032
                                                              68. Table 68: Global Agricultural Fumigants Industry Revenue Million Forecast, by Consumption Analysis 2019 & 2032
                                                              69. Table 69: Global Agricultural Fumigants Industry Revenue Million Forecast, by Import Market Analysis (Value & Volume) 2019 & 2032
                                                              70. Table 70: Global Agricultural Fumigants Industry Revenue Million Forecast, by Export Market Analysis (Value & Volume) 2019 & 2032
                                                              71. Table 71: Global Agricultural Fumigants Industry Revenue Million Forecast, by Price Trend Analysis 2019 & 2032
                                                              72. Table 72: Global Agricultural Fumigants Industry Revenue Million Forecast, by Country 2019 & 2032
                                                              73. Table 73: Turkey Agricultural Fumigants Industry Revenue (Million) Forecast, by Application 2019 & 2032
                                                              74. Table 74: Israel Agricultural Fumigants Industry Revenue (Million) Forecast, by Application 2019 & 2032
                                                              75. Table 75: GCC Agricultural Fumigants Industry Revenue (Million) Forecast, by Application 2019 & 2032
                                                              76. Table 76: North Africa Agricultural Fumigants Industry Revenue (Million) Forecast, by Application 2019 & 2032
                                                              77. Table 77: South Africa Agricultural Fumigants Industry Revenue (Million) Forecast, by Application 2019 & 2032
                                                              78. Table 78: Rest of Middle East & Africa Agricultural Fumigants Industry Revenue (Million) Forecast, by Application 2019 & 2032
                                                              79. Table 79: Global Agricultural Fumigants Industry Revenue Million Forecast, by Production Analysis 2019 & 2032
                                                              80. Table 80: Global Agricultural Fumigants Industry Revenue Million Forecast, by Consumption Analysis 2019 & 2032
                                                              81. Table 81: Global Agricultural Fumigants Industry Revenue Million Forecast, by Import Market Analysis (Value & Volume) 2019 & 2032
                                                              82. Table 82: Global Agricultural Fumigants Industry Revenue Million Forecast, by Export Market Analysis (Value & Volume) 2019 & 2032
                                                              83. Table 83: Global Agricultural Fumigants Industry Revenue Million Forecast, by Price Trend Analysis 2019 & 2032
                                                              84. Table 84: Global Agricultural Fumigants Industry Revenue Million Forecast, by Country 2019 & 2032
                                                              85. Table 85: China Agricultural Fumigants Industry Revenue (Million) Forecast, by Application 2019 & 2032
                                                              86. Table 86: India Agricultural Fumigants Industry Revenue (Million) Forecast, by Application 2019 & 2032
                                                              87. Table 87: Japan Agricultural Fumigants Industry Revenue (Million) Forecast, by Application 2019 & 2032
                                                              88. Table 88: South Korea Agricultural Fumigants Industry Revenue (Million) Forecast, by Application 2019 & 2032
                                                              89. Table 89: ASEAN Agricultural Fumigants Industry Revenue (Million) Forecast, by Application 2019 & 2032
                                                              90. Table 90: Oceania Agricultural Fumigants Industry Revenue (Million) Forecast, by Application 2019 & 2032
                                                              91. Table 91: Rest of Asia Pacific Agricultural Fumigants Industry Revenue (Million) Forecast, by Application 2019 & 2032


                                                              Frequently Asked Questions

                                                              1. What is the projected Compound Annual Growth Rate (CAGR) of the Agricultural Fumigants Industry?

                                                              The projected CAGR is approximately 5.60%.

                                                              2. Which companies are prominent players in the Agricultural Fumigants Industry?

                                                              Key companies in the market include VFC, FMC Corporation, ADAMA Agricultural Solution Ltd, TriEst Ag Group Inc, Trical Inc, Fumigation Services, Ikeda Kogyo Co Ltd, Detia Degesch GmbH, DowDuPont, Lanxess, Isagro SpA, Syngenta AG, UPL Group, Industrial Fumigation Compan, Industrial Fumigation Company, Amvac Chemical Corporation, Reddick Fumigants LLC, Cytec Solvay Group, BASF SE.

                                                              3. What are the main segments of the Agricultural Fumigants Industry?

                                                              The market segments include Production Analysis, Consumption Analysis, Import Market Analysis (Value & Volume), Export Market Analysis (Value & Volume), Price Trend Analysis.

                                                              4. Can you provide details about the market size?

                                                              The market size is estimated to be USD 2.45 Million as of 2022.

                                                              5. What are some drivers contributing to market growth?

                                                              Low Availability of Skilled Labor; Technological Advancements.

                                                              6. What are the notable trends driving market growth?

                                                              Growing Agricultural Production.

                                                              7. Are there any restraints impacting market growth?

                                                              Increasing Farm Expenditure; Security Concerns in Modern Farming Machinery.

                                                              8. Can you provide examples of recent developments in the market?

                                                              N/A

                                                              9. What pricing options are available for accessing the report?

                                                              Pricing options include single-user, multi-user, and enterprise licenses priced at USD 4750, USD 5250, and USD 8750 respectively.

                                                              10. Is the market size provided in terms of value or volume?

                                                              The market size is provided in terms of value, measured in Million.

                                                              11. Are there any specific market keywords associated with the report?

                                                              Yes, the market keyword associated with the report is "Agricultural Fumigants Industry," which aids in identifying and referencing the specific market segment covered.

                                                              12. How do I determine which pricing option suits my needs best?

                                                              The pricing options vary based on user requirements and access needs. Individual users may opt for single-user licenses, while businesses requiring broader access may choose multi-user or enterprise licenses for cost-effective access to the report.

                                                              13. Are there any additional resources or data provided in the Agricultural Fumigants Industry report?

                                                              While the report offers comprehensive insights, it's advisable to review the specific contents or supplementary materials provided to ascertain if additional resources or data are available.

                                                              14. How can I stay updated on further developments or reports in the Agricultural Fumigants Industry?

                                                              To stay informed about further developments, trends, and reports in the Agricultural Fumigants Industry, consider subscribing to industry newsletters, following relevant companies and organizations, or regularly checking reputable industry news sources and publications.


                                                              Methodology

                                                              Step 1 - Identification of Relevant Samples Size from Population Database

                                                              Step Chart
                                                              Bar Chart
                                                              Method Chart

                                                              Step 2 - Approaches for Defining Global Market Size (Value, Volume* & Price*)

                                                              Approach Chart
                                                              Top-down and bottom-up approaches are used to validate the global market size and estimate the market size for manufactures, regional segments, product, and application.

                                                              Note*: In applicable scenarios

                                                              Step 3 - Data Sources

                                                              Primary Research

                                                              • Web Analytics
                                                              • Survey Reports
                                                              • Research Institute
                                                              • Latest Research Reports
                                                              • Opinion Leaders

                                                              Secondary Research

                                                              • Annual Reports
                                                              • White Paper
                                                              • Latest Press Release
                                                              • Industry Association
                                                              • Paid Database
                                                              • Investor Presentations
                                                              Analyst Chart

                                                              Step 4 - Data Triangulation

                                                              Involves using different sources of information in order to increase the validity of a study

                                                              These sources are likely to be stakeholders in a program - participants, other researchers, program staff, other community members, and so on.

                                                              Then we put all data in single framework & apply various statistical tools to find out the dynamic on the market.

                                                              During the analysis stage, feedback from the stakeholder groups would be compared to determine areas of agreement as well as areas of divergence

                                                              Additionally, after gathering mixed and scattered data from a wide range of sources, data is triangulated and correlated to come up with estimated figures which are further validated through primary mediums or industry experts, opinion leaders.

                                                              About Visionary Data Reports

                                                              Visionary Data Reports provides future-focused market research, advanced analytics, and strategic insights for technology, healthcare, green energy, and finance. Our reports help you anticipate trends, innovate, and lead in your industry. Our expert team combines primary research, data science, and industry knowledge to deliver actionable intelligence. We offer syndicated reports, custom analytics, and consulting services tailored to your business needs. At Visionary Data Reports, we are committed to quality, transparency, and client satisfaction. Every report is rigorously validated to ensure accuracy and relevance. Our global perspective and forward-thinking approach help you understand both current and emerging market dynamics.

                                                              Stay ahead with Visionary Data Reports. Subscribe to our newsletter for the latest insights and research highlights, and follow us on social media for real-time updates. Visionary Data Reports – Your Guide to Tomorrow’s Opportunities.

                                                              artwork spiralartwork spiralRelated Reports
                                                              artwork underline

                                                              North America Specialty Fertilizer Market 2025-2033 Overview: Trends, Competitor Dynamics, and Opportunities

                                                              The North American specialty fertilizer market is experiencing robust growth, driven by precision agriculture, sustainable farming practices, and demand for high-yield crops. Explore market size, CAGR, key players (Koch Industries, Mosaic, Nutrien), and regional trends (US, Canada, Mexico) in this in-depth analysis. Discover opportunities and challenges in the liquid, slow-release, and water-soluble fertilizer segments.

                                                              July 2025
                                                              Base Year: 2024
                                                              No Of Pages: 197
                                                              Price: $3800

                                                              Europe Chia Seeds Market Market’s Role in Emerging Tech: Insights and Projections 2025-2033

                                                              Discover the booming European chia seeds market! This in-depth analysis reveals market size, CAGR, key players (The Chia Company, Salba, Nutiva), and growth drivers. Explore trends in packaging, applications (food, supplements, personal care), and regional variations. Learn how this €414.20 million market is poised for significant expansion.

                                                              July 2025
                                                              Base Year: 2024
                                                              No Of Pages: 180
                                                              Price: $4750

                                                              Drivers of Change in Thailand Vegetable Seed Market Market 2025-2033

                                                              Discover the thriving Thailand vegetable seed market's growth trajectory (CAGR 5.20%), driven by consumer demand and technological advancements. Explore market segmentation, key players, and challenges impacting this dynamic sector projected to reach $XXX million by 2033.

                                                              July 2025
                                                              Base Year: 2024
                                                              No Of Pages: 150
                                                              Price: $3800

                                                              Consumer Trends Driving Indonesia Fungicide Market Market Growth

                                                              Discover the booming Indonesia Fungicide Market! This report reveals a projected 16.50% CAGR from 2025-2033, driven by rising disease prevalence, advanced application methods, and government support. Learn about market size, key players (Bayer, Syngenta, BASF), and future trends impacting this dynamic agricultural sector.

                                                              July 2025
                                                              Base Year: 2024
                                                              No Of Pages: 197
                                                              Price: $3800

                                                              Tomato Seed Market 2025-2033 Overview: Trends, Competitor Dynamics, and Opportunities

                                                              Discover the booming global tomato seed market! This comprehensive analysis reveals key trends, growth drivers (hybrid seeds, protected cultivation), restraints, and regional insights (Asia-Pacific leading) for the period 2019-2033, featuring top players like Sakata Seeds and Syngenta. Projected CAGR of 4.70% showcases significant investment opportunities.

                                                              July 2025
                                                              Base Year: 2024
                                                              No Of Pages: 180
                                                              Price: $3800

                                                              Emerging Trends in Brazil Maize Market: A Technology Perspective 2025-2033

                                                              Discover the dynamic Brazil maize market forecast (2025-2033)! This in-depth analysis reveals key growth drivers, including animal feed, biofuel, and human consumption, alongside major players like Syngenta and Corteva. Explore market size, CAGR, and regional insights to understand this lucrative opportunity.

                                                              July 2025
                                                              Base Year: 2024
                                                              No Of Pages: 180
                                                              Price: $3800

                                                              Future Forecasts for North America Seed Treatment Market Industry Growth

                                                              Discover the booming North American seed treatment market! This in-depth analysis reveals a CAGR of 4.20% (2025-2033), driven by precision farming, pest control needs, and government support. Explore key players, market segments (fungicides, insecticides, crops), and regional trends in the US, Canada, and Mexico. Get the data-driven insights you need to succeed.

                                                              July 2025
                                                              Base Year: 2024
                                                              No Of Pages: 150
                                                              Price: $3800

                                                              Africa Chia Seeds Industry Market’s Drivers and Challenges: Strategic Overview 2025-2033

                                                              Discover the booming African chia seed market! Our analysis reveals a $13.87M market in 2025, projected to grow at a 2.10% CAGR through 2033. Explore key trends, segments (organic, hybrid, processed, omega-3 rich), applications (food & beverage, supplements, personal care), and leading companies. Get insights for investment and market entry.

                                                              July 2025
                                                              Base Year: 2024
                                                              No Of Pages: 180
                                                              Price: $4750

                                                              Strategic Trends in Asia-Pacific Seed Coating Materials Market Market 2025-2033

                                                              The Asia-Pacific seed coating materials market is booming, with an 8% CAGR. Discover key trends, leading companies (BASF, Bayer), and segment analysis (polymers, colorants) driving growth in this $XX million market. Explore the forecast to 2033.

                                                              July 2025
                                                              Base Year: 2024
                                                              No Of Pages: 150
                                                              Price: $3800

                                                              Comprehensive Review of UK Fruits and Vegetables Market Growth Potential

                                                              Discover the booming UK fruits and vegetables market! This in-depth analysis reveals a £31.58 billion market with a 2.97% CAGR (2025-2033), driven by health trends and major players like Tesco and Sainsbury's. Explore regional data, consumption patterns, and future growth potential.

                                                              July 2025
                                                              Base Year: 2024
                                                              No Of Pages: 180
                                                              Price: $3800

                                                              Malaysia Agrochemical Market Market’s Drivers and Challenges: Strategic Overview 2025-2033

                                                              Discover the booming Malaysian agrochemical market! This comprehensive analysis reveals a RM 679.59 million market in 2025, projected to grow at a 4.56% CAGR until 2033. Explore key drivers, trends, restraints, and leading companies shaping this dynamic sector. Learn about fertilizers, pesticides, and other agrochemical segments.

                                                              July 2025
                                                              Base Year: 2024
                                                              No Of Pages: 150
                                                              Price: $3800

                                                              Drivers of Change in Agricultural Surfactant Market Market 2025-2033

                                                              The global agricultural surfactant market is booming, projected to reach $3.56 billion by 2033 with a 6.70% CAGR. Driven by precision agriculture and sustainable farming, this market analysis explores key segments (anionic, nonionic, bio-based), top players (BASF, Clariant), and regional growth trends. Discover the future of agricultural surfactants.

                                                              July 2025
                                                              Base Year: 2024
                                                              No Of Pages: 234
                                                              Price: $4750

                                                              Cameroon Grains Industry Industry Analysis and Consumer Behavior

                                                              Discover the booming Cameroon grains industry! Explore market size, growth trends (4.80% CAGR), key players (Sodecoton, CDC, etc.), and challenges impacting cereals, pulses, and oilseeds in Cameroon from 2019-2033. Invest wisely in this promising African market.

                                                              July 2025
                                                              Base Year: 2024
                                                              No Of Pages: 180
                                                              Price: $3800

                                                              Analyzing Consumer Behavior in Agriculture Market in Tanzania Market

                                                              Discover the booming Tanzanian agriculture market! Projected to reach $17.44 billion in 2025, with a 5.63% CAGR, this report analyzes market size, key players (Syngenta, Rijk Zwaan), growth drivers, and future trends in Tanzania's agricultural sector. Explore market segments, including food crops and investment opportunities.

                                                              July 2025
                                                              Base Year: 2024
                                                              No Of Pages: 150
                                                              Price: $3800

                                                              Analyzing Consumer Behavior in Artificial Intelligence in Agriculture Industry Market

                                                              Discover the booming AI in Agriculture market! This comprehensive analysis reveals a 4.20% CAGR, key drivers, trends, restraints, and regional insights from 2019-2033. Learn about leading companies and applications like precision farming, drone analytics, and weather tracking. Explore market size projections and future growth potential.

                                                              July 2025
                                                              Base Year: 2024
                                                              No Of Pages: 150
                                                              Price: $4750

                                                              Exploring Forestry Machinery Market’s Market Size Dynamics 2025-2033

                                                              The global forestry machinery market is booming, projected to reach $15 billion by 2033, driven by rising timber demand and technological advancements. Explore market trends, key players (Deere, Komatsu, etc.), and regional growth in our comprehensive analysis.

                                                              July 2025
                                                              Base Year: 2024
                                                              No Of Pages: 150
                                                              Price: $4750

                                                              Nutrition Canary Seed Market Competitive Strategies: Trends and Forecasts 2025-2033

                                                              Discover the booming nutrition canary seed market! Explore key trends, growth drivers, and regional market share projections for 2025-2033. Learn about leading companies and the increasing demand driven by health-conscious consumers and the birdseed industry.

                                                              July 2025
                                                              Base Year: 2024
                                                              No Of Pages: 234
                                                              Price: $4750

                                                              Consumer Behavior and Cashews Market in South America Trends

                                                              Discover the booming South American cashew market! This comprehensive analysis reveals a $582.24 million market in 2025, projected to grow at a 5.20% CAGR through 2033. Explore key trends, drivers, and leading companies shaping this lucrative industry.

                                                              July 2025
                                                              Base Year: 2024
                                                              No Of Pages: 180
                                                              Price: $3800

                                                              Strategic Growth Drivers for Rye Industry Market

                                                              Discover the latest market analysis of the global rye industry, projecting a steady CAGR of 2.20% to 2033. Explore key drivers, restraints, and regional trends impacting the growth of rye in food, feed, and beverage applications. Learn about leading companies and future market opportunities.

                                                              July 2025
                                                              Base Year: 2024
                                                              No Of Pages: 234
                                                              Price: $4750

                                                              Comprehensive Overview of Water Soluble Fertilizer Industry Trends: 2025-2033

                                                              Discover the booming water-soluble fertilizer market! Explore its $XX million valuation in 2025, projected 3.80% CAGR growth to 2033, key drivers, trends, and regional insights. Learn about top players and lucrative segments like fertigation and horticultural crops.

                                                              July 2025
                                                              Base Year: 2024
                                                              No Of Pages: 150
                                                              Price: $3800

                                                              Business Address

                                                              Head Office

                                                              Office no. A 5010, fifth floor, Solitaire Business Hub, Near Phoenix mall, Pune, Maharashtra 411014

                                                              Contact Information

                                                              Craig Francis

                                                              Business Development Head

                                                              +17162654855

                                                              [email protected]

                                                              Connect With Us

                                                              Secure Payment Partners

                                                              payment image
                                                              RetailLogisticsPackagingAutomotiveHealthcareAgricultureEnergy & PowerFood & BeverageAerospace & DefenseChemicals & MaterialsHospitality and TourismAnimal Nutrition & WellnessConsumer Goods and ServicesReal Estate and ConstructionHome and Property ImprovementTechnology, Media and TelecomManufacturing Products and ServicesFinancial Services and Investment Intelligence

                                                              © 2025 All rights reserved


                                                              Privacy Policy
                                                              Terms and Conditions
                                                              FAQ
                                                              • Home
                                                              • About Us
                                                              • Industries
                                                                • Aerospace & Defense
                                                                • Agriculture
                                                                • Animal Nutrition & Wellness
                                                                • Automotive
                                                                • Chemicals & Materials
                                                                • Consumer Goods and Services
                                                                • Energy & Power
                                                                • Financial Services and Investment Intelligence
                                                                • Food & Beverage
                                                                • Home and Property Improvement
                                                                • Hospitality and Tourism
                                                                • Logistics
                                                                • Manufacturing Products and Services
                                                                • Packaging
                                                                • Professional and Commercial Services
                                                                • Real Estate and Construction
                                                                • Retail
                                                                • Technology, Media and Telecom
                                                                • Healthcare
                                                              • Services
                                                              • Contact
                                                              Main Logo
                                                              • Home
                                                              • About Us
                                                              • Industries
                                                                • Aerospace & Defense
                                                                • Agriculture
                                                                • Animal Nutrition & Wellness
                                                                • Automotive
                                                                • Chemicals & Materials
                                                                • Consumer Goods and Services
                                                                • Energy & Power
                                                                • Financial Services and Investment Intelligence
                                                                • Food & Beverage
                                                                • Home and Property Improvement
                                                                • Hospitality and Tourism
                                                                • Logistics
                                                                • Manufacturing Products and Services
                                                                • Packaging
                                                                • Professional and Commercial Services
                                                                • Real Estate and Construction
                                                                • Retail
                                                                • Technology, Media and Telecom
                                                                • Healthcare
                                                              • Services
                                                              • Contact
                                                              +17162654855
                                                              [email protected]

                                                              +17162654855

                                                              [email protected]