
Key Insights
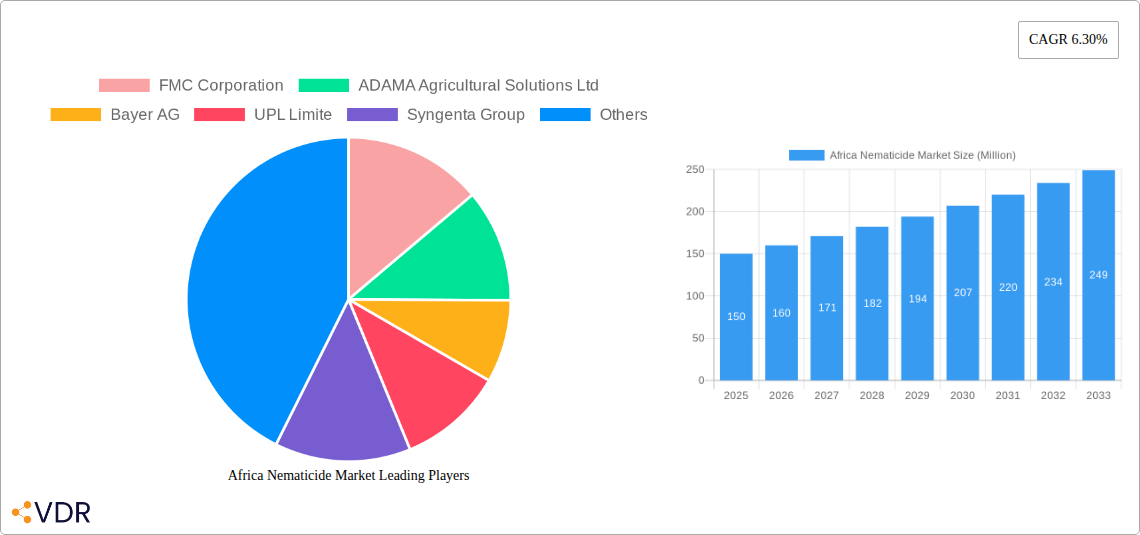
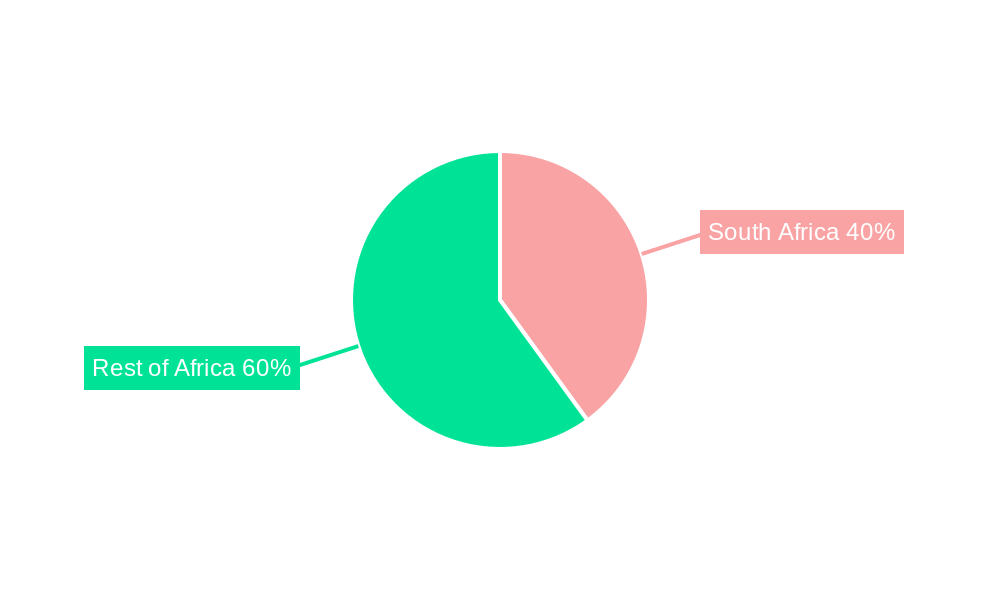
The African nematicide market, currently valued at approximately $XX million (estimated based on provided CAGR and market trends), is projected to experience robust growth, exhibiting a Compound Annual Growth Rate (CAGR) of 6.30% from 2025 to 2033. This expansion is driven by several key factors. Rising agricultural intensification across countries like South Africa, Kenya, and Uganda necessitates effective pest management solutions, increasing nematicide demand. The growing prevalence of nematode infestations impacting crucial crops such as grains & cereals, fruits & vegetables, and pulses & oilseeds, further fuels market growth. Furthermore, increasing farmer awareness of nematode damage and the efficacy of nematicides, coupled with government initiatives promoting sustainable agricultural practices, contribute significantly to market expansion. The market segmentation reveals chemigation and soil treatment application modes as prominent segments. South Africa holds a substantial market share due to its advanced agricultural sector and relatively higher adoption rates of modern pest control techniques.
However, the market faces challenges. High nematicide costs, stringent regulatory frameworks surrounding pesticide usage, and environmental concerns related to their application are key restraints. The market’s future trajectory will be influenced by the development and adoption of environmentally friendlier nematicides, advancements in precision application technologies, and increased access to agricultural extension services educating farmers on best practices. The increasing focus on integrated pest management (IPM) strategies, integrating nematicides with other control methods, will also shape the market’s landscape. The presence of established players like FMC Corporation, Adama, Bayer, UPL, and Syngenta suggests a competitive landscape, leading to product innovation and market penetration efforts. Future growth will depend on navigating these challenges and capitalizing on the increasing need for efficient and sustainable pest management in the burgeoning African agricultural sector.
Africa Nematicide Market: A Comprehensive Report (2019-2033)
This comprehensive report provides an in-depth analysis of the Africa nematicide market, encompassing market dynamics, growth trends, regional performance, product landscape, key players, and future outlook. The report covers the period 2019-2033, with a base year of 2025 and a forecast period of 2025-2033. The market is segmented by application mode (chemigation, foliar, fumigation, seed treatment, soil treatment), crop type (commercial crops, fruits & vegetables, grains & cereals, pulses & oilseeds, turf & ornamental), and country (South Africa, Rest of Africa). Key players analyzed include FMC Corporation, ADAMA Agricultural Solutions Ltd, Bayer AG, UPL Limited, and Syngenta Group. The total market size is projected to reach xx Million units by 2033.
Africa Nematicide Market Dynamics & Structure
The Africa nematicide market is characterized by moderate concentration, with a few major players holding significant market share. Technological innovation, driven by the need for more effective and sustainable nematicide solutions, is a key market driver. Regulatory frameworks, varying across African nations, influence product registration and market access. Bio-nematicides and integrated pest management (IPM) strategies represent competitive product substitutes, steadily gaining traction. End-user demographics, heavily influenced by agricultural practices and crop diversity, shape market demand. Mergers and acquisitions (M&A) activity has been moderate, reflecting strategic expansion efforts by major players.
- Market Concentration: The top 5 players account for approximately xx% of the market share in 2025.
- Technological Innovation: Focus on developing eco-friendly nematicides and improved application technologies.
- Regulatory Landscape: Varying regulations across different African countries create challenges for market entry and expansion.
- Competitive Substitutes: Bio-nematicides and IPM strategies are gaining popularity as sustainable alternatives.
- M&A Activity: A moderate level of M&A activity observed, primarily focused on expanding product portfolios and geographical reach. (e.g., ADAMA's acquisitions). The total M&A deal volume between 2019-2024 was estimated at xx deals.
Africa Nematicide Market Growth Trends & Insights
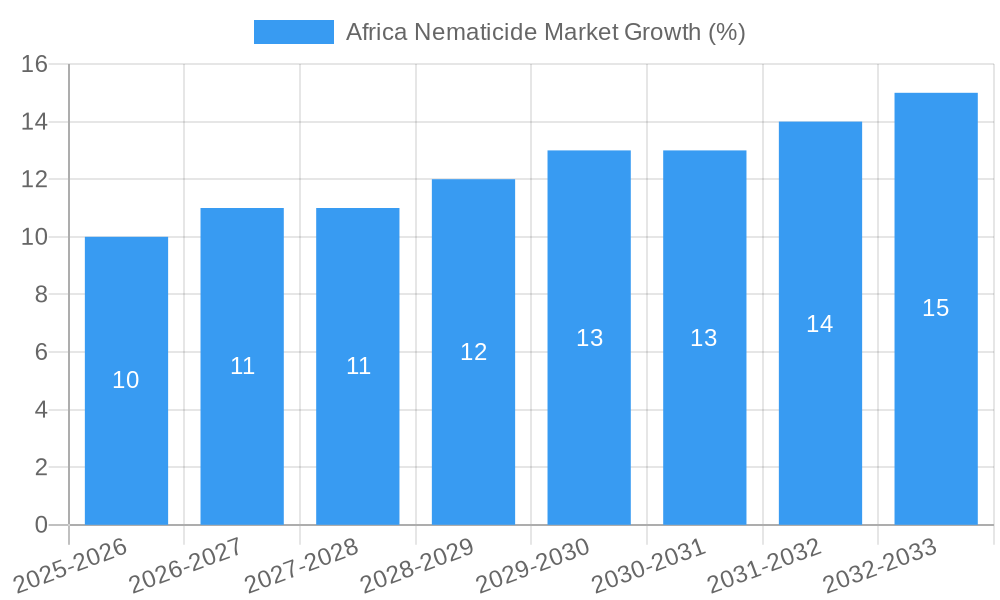
The Africa nematicide market exhibited a CAGR of xx% during the historical period (2019-2024), driven by increasing agricultural production, growing awareness of nematode infestations, and the adoption of improved farming practices. Market penetration is relatively low compared to global standards, indicating significant untapped potential. Technological advancements, such as the development of novel nematicide formulations and precision application technologies, are accelerating market growth. Changes in consumer preferences, such as demand for environmentally friendly products, are influencing product development and market trends. The forecast period (2025-2033) anticipates continued market expansion, with a projected CAGR of xx%, driven by factors including increased investments in agricultural infrastructure, rising disposable incomes in some regions, and government support for sustainable agricultural practices. By 2033, the market is projected to reach xx million units.
Dominant Regions, Countries, or Segments in Africa Nematicide Market
South Africa currently dominates the Africa nematicide market due to its relatively advanced agricultural sector, higher levels of mechanization, and established distribution channels. However, the Rest of Africa segment presents significant growth potential due to expanding agricultural activities, increasing food security concerns, and rising investments in the agricultural sector. Within application modes, soil treatment holds the largest market share reflecting established practices. The Fruits & Vegetables crop type segment demonstrates strong growth, driven by rising demand for these products.
- Key Drivers in South Africa: Established agricultural infrastructure, higher farmer awareness, strong distribution networks.
- Key Drivers in Rest of Africa: Rising agricultural investment, increasing food security concerns, government support for agriculture.
- Dominant Application Mode: Soil treatment (xx% market share in 2025) due to established application methods.
- Fastest-Growing Crop Type: Fruits & Vegetables (xx% CAGR during 2025-2033) driven by rising consumer demand.
Africa Nematicide Market Product Landscape
The Africa nematicide market showcases a diverse range of products, including organophosphates, carbamates, and nematicides based on other chemical families. Recent innovations focus on developing more environmentally friendly nematicides with improved efficacy and reduced impact on non-target organisms. The emphasis is on enhancing crop protection while minimizing environmental concerns. Unique selling propositions include improved efficacy, targeted delivery systems, and reduced environmental impact.
Key Drivers, Barriers & Challenges in Africa Nematicide Market
Key Drivers: Growing demand for food, increasing crop production, rising awareness of nematode damage, government support for agricultural development.
Key Challenges: High cost of nematicides, limited access to technology and information in some regions, stringent regulatory requirements in some countries, supply chain disruptions impacting availability and pricing, potential for environmental concerns related to certain nematicide types. For example, supply chain disruptions in 2022-2023 led to a xx% price increase in some nematicide types.
Emerging Opportunities in Africa Nematicide Market
Untapped markets in the Rest of Africa, increasing demand for bio-nematicides and sustainable solutions, adoption of precision agriculture technologies, and focus on integrated pest management (IPM) offer significant growth opportunities.
Growth Accelerators in the Africa Nematicide Market Industry
Technological advancements in nematicide formulation and application, strategic partnerships to enhance distribution networks, and government initiatives supporting sustainable agriculture will drive long-term growth. Expansion into new markets within the Rest of Africa and increasing investment in agricultural research and development are also crucial catalysts.
Key Players Shaping the Africa Nematicide Market Market
Notable Milestones in Africa Nematicide Market Sector
- May 2021: ADAMA acquired 51% ownership of Huifeng's crop protection manufacturing facilities, strengthening its global product line.
- October 2021: ADAMA invested in a new chemist's center, enhancing its R&D capabilities in plant protection.
- January 2023: Bayer partnered with Oerth Bio to develop eco-friendly crop protection solutions.
In-Depth Africa Nematicide Market Market Outlook
The Africa nematicide market is poised for robust growth, driven by increasing agricultural investments, technological advancements, and a growing focus on sustainable agricultural practices. Strategic partnerships, expansion into new markets, and the development of innovative nematicide solutions will be key to unlocking future market potential. The market's long-term growth trajectory is strongly positive, with opportunities for players to capitalize on expanding demand and evolving consumer preferences.
Africa Nematicide Market Segmentation
-
1. Application Mode
- 1.1. Chemigation
- 1.2. Foliar
- 1.3. Fumigation
- 1.4. Seed Treatment
- 1.5. Soil Treatment
-
2. Crop Type
- 2.1. Commercial Crops
- 2.2. Fruits & Vegetables
- 2.3. Grains & Cereals
- 2.4. Pulses & Oilseeds
- 2.5. Turf & Ornamental
-
3. Application Mode
- 3.1. Chemigation
- 3.2. Foliar
- 3.3. Fumigation
- 3.4. Seed Treatment
- 3.5. Soil Treatment
-
4. Crop Type
- 4.1. Commercial Crops
- 4.2. Fruits & Vegetables
- 4.3. Grains & Cereals
- 4.4. Pulses & Oilseeds
- 4.5. Turf & Ornamental
Africa Nematicide Market Segmentation By Geography
-
1. Africa
- 1.1. Nigeria
- 1.2. South Africa
- 1.3. Egypt
- 1.4. Kenya
- 1.5. Ethiopia
- 1.6. Morocco
- 1.7. Ghana
- 1.8. Algeria
- 1.9. Tanzania
- 1.10. Ivory Coast
Africa Nematicide Market REPORT HIGHLIGHTS
| Aspects | Details |
|---|---|
| Study Period | 2019-2033 |
| Base Year | 2024 |
| Estimated Year | 2025 |
| Forecast Period | 2025-2033 |
| Historical Period | 2019-2024 |
| Growth Rate | CAGR of 6.30% from 2019-2033 |
| Segmentation |
|
Table of Contents
- 1. Introduction
- 1.1. Research Scope
- 1.2. Market Segmentation
- 1.3. Research Methodology
- 1.4. Definitions and Assumptions
- 2. Executive Summary
- 2.1. Introduction
- 3. Market Dynamics
- 3.1. Introduction
- 3.2. Market Drivers
- 3.2.1. Increasing Demand for Tomato; Adoption of Greenhouse Technology in Tomato Cultivation; Government support
- 3.3. Market Restrains
- 3.3.1 Increasing Loses due to Physiological Disorder
- 3.3.2 Pest and Disease; Unfavourable Climatic Condition
- 3.4. Market Trends
- 3.4.1. The focus of African farmers on nematode management to achieve optimal crop health and maximize yield is expected to drive the market
- 4. Market Factor Analysis
- 4.1. Porters Five Forces
- 4.2. Supply/Value Chain
- 4.3. PESTEL analysis
- 4.4. Market Entropy
- 4.5. Patent/Trademark Analysis
- 5. Africa Nematicide Market Analysis, Insights and Forecast, 2019-2031
- 5.1. Market Analysis, Insights and Forecast - by Application Mode
- 5.1.1. Chemigation
- 5.1.2. Foliar
- 5.1.3. Fumigation
- 5.1.4. Seed Treatment
- 5.1.5. Soil Treatment
- 5.2. Market Analysis, Insights and Forecast - by Crop Type
- 5.2.1. Commercial Crops
- 5.2.2. Fruits & Vegetables
- 5.2.3. Grains & Cereals
- 5.2.4. Pulses & Oilseeds
- 5.2.5. Turf & Ornamental
- 5.3. Market Analysis, Insights and Forecast - by Application Mode
- 5.3.1. Chemigation
- 5.3.2. Foliar
- 5.3.3. Fumigation
- 5.3.4. Seed Treatment
- 5.3.5. Soil Treatment
- 5.4. Market Analysis, Insights and Forecast - by Crop Type
- 5.4.1. Commercial Crops
- 5.4.2. Fruits & Vegetables
- 5.4.3. Grains & Cereals
- 5.4.4. Pulses & Oilseeds
- 5.4.5. Turf & Ornamental
- 5.5. Market Analysis, Insights and Forecast - by Region
- 5.5.1. Africa
- 5.1. Market Analysis, Insights and Forecast - by Application Mode
- 6. South Africa Africa Nematicide Market Analysis, Insights and Forecast, 2019-2031
- 7. Sudan Africa Nematicide Market Analysis, Insights and Forecast, 2019-2031
- 8. Uganda Africa Nematicide Market Analysis, Insights and Forecast, 2019-2031
- 9. Tanzania Africa Nematicide Market Analysis, Insights and Forecast, 2019-2031
- 10. Kenya Africa Nematicide Market Analysis, Insights and Forecast, 2019-2031
- 11. Rest of Africa Africa Nematicide Market Analysis, Insights and Forecast, 2019-2031
- 12. Competitive Analysis
- 12.1. Market Share Analysis 2024
- 12.2. Company Profiles
- 12.2.1 FMC Corporation
- 12.2.1.1. Overview
- 12.2.1.2. Products
- 12.2.1.3. SWOT Analysis
- 12.2.1.4. Recent Developments
- 12.2.1.5. Financials (Based on Availability)
- 12.2.2 ADAMA Agricultural Solutions Ltd
- 12.2.2.1. Overview
- 12.2.2.2. Products
- 12.2.2.3. SWOT Analysis
- 12.2.2.4. Recent Developments
- 12.2.2.5. Financials (Based on Availability)
- 12.2.3 Bayer AG
- 12.2.3.1. Overview
- 12.2.3.2. Products
- 12.2.3.3. SWOT Analysis
- 12.2.3.4. Recent Developments
- 12.2.3.5. Financials (Based on Availability)
- 12.2.4 UPL Limite
- 12.2.4.1. Overview
- 12.2.4.2. Products
- 12.2.4.3. SWOT Analysis
- 12.2.4.4. Recent Developments
- 12.2.4.5. Financials (Based on Availability)
- 12.2.5 Syngenta Group
- 12.2.5.1. Overview
- 12.2.5.2. Products
- 12.2.5.3. SWOT Analysis
- 12.2.5.4. Recent Developments
- 12.2.5.5. Financials (Based on Availability)
- 12.2.1 FMC Corporation
List of Figures
- Figure 1: Africa Nematicide Market Revenue Breakdown (Million, %) by Product 2024 & 2032
- Figure 2: Africa Nematicide Market Share (%) by Company 2024
List of Tables
- Table 1: Africa Nematicide Market Revenue Million Forecast, by Region 2019 & 2032
- Table 2: Africa Nematicide Market Volume Kiloton Forecast, by Region 2019 & 2032
- Table 3: Africa Nematicide Market Revenue Million Forecast, by Application Mode 2019 & 2032
- Table 4: Africa Nematicide Market Volume Kiloton Forecast, by Application Mode 2019 & 2032
- Table 5: Africa Nematicide Market Revenue Million Forecast, by Crop Type 2019 & 2032
- Table 6: Africa Nematicide Market Volume Kiloton Forecast, by Crop Type 2019 & 2032
- Table 7: Africa Nematicide Market Revenue Million Forecast, by Application Mode 2019 & 2032
- Table 8: Africa Nematicide Market Volume Kiloton Forecast, by Application Mode 2019 & 2032
- Table 9: Africa Nematicide Market Revenue Million Forecast, by Crop Type 2019 & 2032
- Table 10: Africa Nematicide Market Volume Kiloton Forecast, by Crop Type 2019 & 2032
- Table 11: Africa Nematicide Market Revenue Million Forecast, by Region 2019 & 2032
- Table 12: Africa Nematicide Market Volume Kiloton Forecast, by Region 2019 & 2032
- Table 13: Africa Nematicide Market Revenue Million Forecast, by Country 2019 & 2032
- Table 14: Africa Nematicide Market Volume Kiloton Forecast, by Country 2019 & 2032
- Table 15: South Africa Africa Nematicide Market Revenue (Million) Forecast, by Application 2019 & 2032
- Table 16: South Africa Africa Nematicide Market Volume (Kiloton) Forecast, by Application 2019 & 2032
- Table 17: Sudan Africa Nematicide Market Revenue (Million) Forecast, by Application 2019 & 2032
- Table 18: Sudan Africa Nematicide Market Volume (Kiloton) Forecast, by Application 2019 & 2032
- Table 19: Uganda Africa Nematicide Market Revenue (Million) Forecast, by Application 2019 & 2032
- Table 20: Uganda Africa Nematicide Market Volume (Kiloton) Forecast, by Application 2019 & 2032
- Table 21: Tanzania Africa Nematicide Market Revenue (Million) Forecast, by Application 2019 & 2032
- Table 22: Tanzania Africa Nematicide Market Volume (Kiloton) Forecast, by Application 2019 & 2032
- Table 23: Kenya Africa Nematicide Market Revenue (Million) Forecast, by Application 2019 & 2032
- Table 24: Kenya Africa Nematicide Market Volume (Kiloton) Forecast, by Application 2019 & 2032
- Table 25: Rest of Africa Africa Nematicide Market Revenue (Million) Forecast, by Application 2019 & 2032
- Table 26: Rest of Africa Africa Nematicide Market Volume (Kiloton) Forecast, by Application 2019 & 2032
- Table 27: Africa Nematicide Market Revenue Million Forecast, by Application Mode 2019 & 2032
- Table 28: Africa Nematicide Market Volume Kiloton Forecast, by Application Mode 2019 & 2032
- Table 29: Africa Nematicide Market Revenue Million Forecast, by Crop Type 2019 & 2032
- Table 30: Africa Nematicide Market Volume Kiloton Forecast, by Crop Type 2019 & 2032
- Table 31: Africa Nematicide Market Revenue Million Forecast, by Application Mode 2019 & 2032
- Table 32: Africa Nematicide Market Volume Kiloton Forecast, by Application Mode 2019 & 2032
- Table 33: Africa Nematicide Market Revenue Million Forecast, by Crop Type 2019 & 2032
- Table 34: Africa Nematicide Market Volume Kiloton Forecast, by Crop Type 2019 & 2032
- Table 35: Africa Nematicide Market Revenue Million Forecast, by Country 2019 & 2032
- Table 36: Africa Nematicide Market Volume Kiloton Forecast, by Country 2019 & 2032
- Table 37: Nigeria Africa Nematicide Market Revenue (Million) Forecast, by Application 2019 & 2032
- Table 38: Nigeria Africa Nematicide Market Volume (Kiloton) Forecast, by Application 2019 & 2032
- Table 39: South Africa Africa Nematicide Market Revenue (Million) Forecast, by Application 2019 & 2032
- Table 40: South Africa Africa Nematicide Market Volume (Kiloton) Forecast, by Application 2019 & 2032
- Table 41: Egypt Africa Nematicide Market Revenue (Million) Forecast, by Application 2019 & 2032
- Table 42: Egypt Africa Nematicide Market Volume (Kiloton) Forecast, by Application 2019 & 2032
- Table 43: Kenya Africa Nematicide Market Revenue (Million) Forecast, by Application 2019 & 2032
- Table 44: Kenya Africa Nematicide Market Volume (Kiloton) Forecast, by Application 2019 & 2032
- Table 45: Ethiopia Africa Nematicide Market Revenue (Million) Forecast, by Application 2019 & 2032
- Table 46: Ethiopia Africa Nematicide Market Volume (Kiloton) Forecast, by Application 2019 & 2032
- Table 47: Morocco Africa Nematicide Market Revenue (Million) Forecast, by Application 2019 & 2032
- Table 48: Morocco Africa Nematicide Market Volume (Kiloton) Forecast, by Application 2019 & 2032
- Table 49: Ghana Africa Nematicide Market Revenue (Million) Forecast, by Application 2019 & 2032
- Table 50: Ghana Africa Nematicide Market Volume (Kiloton) Forecast, by Application 2019 & 2032
- Table 51: Algeria Africa Nematicide Market Revenue (Million) Forecast, by Application 2019 & 2032
- Table 52: Algeria Africa Nematicide Market Volume (Kiloton) Forecast, by Application 2019 & 2032
- Table 53: Tanzania Africa Nematicide Market Revenue (Million) Forecast, by Application 2019 & 2032
- Table 54: Tanzania Africa Nematicide Market Volume (Kiloton) Forecast, by Application 2019 & 2032
- Table 55: Ivory Coast Africa Nematicide Market Revenue (Million) Forecast, by Application 2019 & 2032
- Table 56: Ivory Coast Africa Nematicide Market Volume (Kiloton) Forecast, by Application 2019 & 2032
Frequently Asked Questions
1. What is the projected Compound Annual Growth Rate (CAGR) of the Africa Nematicide Market?
The projected CAGR is approximately 6.30%.
2. Which companies are prominent players in the Africa Nematicide Market?
Key companies in the market include FMC Corporation, ADAMA Agricultural Solutions Ltd, Bayer AG, UPL Limite, Syngenta Group.
3. What are the main segments of the Africa Nematicide Market?
The market segments include Application Mode, Crop Type, Application Mode, Crop Type.
4. Can you provide details about the market size?
The market size is estimated to be USD XX Million as of 2022.
5. What are some drivers contributing to market growth?
Increasing Demand for Tomato; Adoption of Greenhouse Technology in Tomato Cultivation; Government support.
6. What are the notable trends driving market growth?
The focus of African farmers on nematode management to achieve optimal crop health and maximize yield is expected to drive the market.
7. Are there any restraints impacting market growth?
Increasing Loses due to Physiological Disorder. Pest and Disease; Unfavourable Climatic Condition.
8. Can you provide examples of recent developments in the market?
January 2023: Bayer formed a new partnership with Oerth Bio to enhance crop protection technology and create more eco-friendly crop protection solutions.October 2021: By investing in a new chemist's center, ADAMA enhanced its R&D capabilities that are aimed to expand and accelerate its own research and development in the field of plant protection.May 2021: ADAMA acquired 51% ownership of Huifeng's crop protection manufacturing facilities, resulting in a stronger global product line for the company.
9. What pricing options are available for accessing the report?
Pricing options include single-user, multi-user, and enterprise licenses priced at USD 3800, USD 4500, and USD 5800 respectively.
10. Is the market size provided in terms of value or volume?
The market size is provided in terms of value, measured in Million and volume, measured in Kiloton.
11. Are there any specific market keywords associated with the report?
Yes, the market keyword associated with the report is "Africa Nematicide Market," which aids in identifying and referencing the specific market segment covered.
12. How do I determine which pricing option suits my needs best?
The pricing options vary based on user requirements and access needs. Individual users may opt for single-user licenses, while businesses requiring broader access may choose multi-user or enterprise licenses for cost-effective access to the report.
13. Are there any additional resources or data provided in the Africa Nematicide Market report?
While the report offers comprehensive insights, it's advisable to review the specific contents or supplementary materials provided to ascertain if additional resources or data are available.
14. How can I stay updated on further developments or reports in the Africa Nematicide Market?
To stay informed about further developments, trends, and reports in the Africa Nematicide Market, consider subscribing to industry newsletters, following relevant companies and organizations, or regularly checking reputable industry news sources and publications.
Methodology
Step 1 - Identification of Relevant Samples Size from Population Database


Step 2 - Approaches for Defining Global Market Size (Value, Volume* & Price*)

Note*: In applicable scenarios
Step 3 - Data Sources
Primary Research
- Web Analytics
- Survey Reports
- Research Institute
- Latest Research Reports
- Opinion Leaders
Secondary Research
- Annual Reports
- White Paper
- Latest Press Release
- Industry Association
- Paid Database
- Investor Presentations

Step 4 - Data Triangulation
Involves using different sources of information in order to increase the validity of a study
These sources are likely to be stakeholders in a program - participants, other researchers, program staff, other community members, and so on.
Then we put all data in single framework & apply various statistical tools to find out the dynamic on the market.
During the analysis stage, feedback from the stakeholder groups would be compared to determine areas of agreement as well as areas of divergence


