


Key Insights
The global Aerial Cables market is projected for significant expansion, with an estimated market size of $33.49 billion in 2025. The market is expected to grow at a Compound Annual Growth Rate (CAGR) of 5.82% through 2033. This growth is driven by increasing demand for advanced power transmission and distribution infrastructure in both developing and developed economies. The continuous need to upgrade electrical grids and extend electricity access to remote areas presents substantial opportunities for aerial cable manufacturers. The growing adoption of renewable energy sources, requiring extensive grid interconnections, also serves as a key growth driver. Aerial cables offer cost-effectiveness, ease of installation, and lower maintenance compared to underground options, positioning them to capitalize on global infrastructure development.
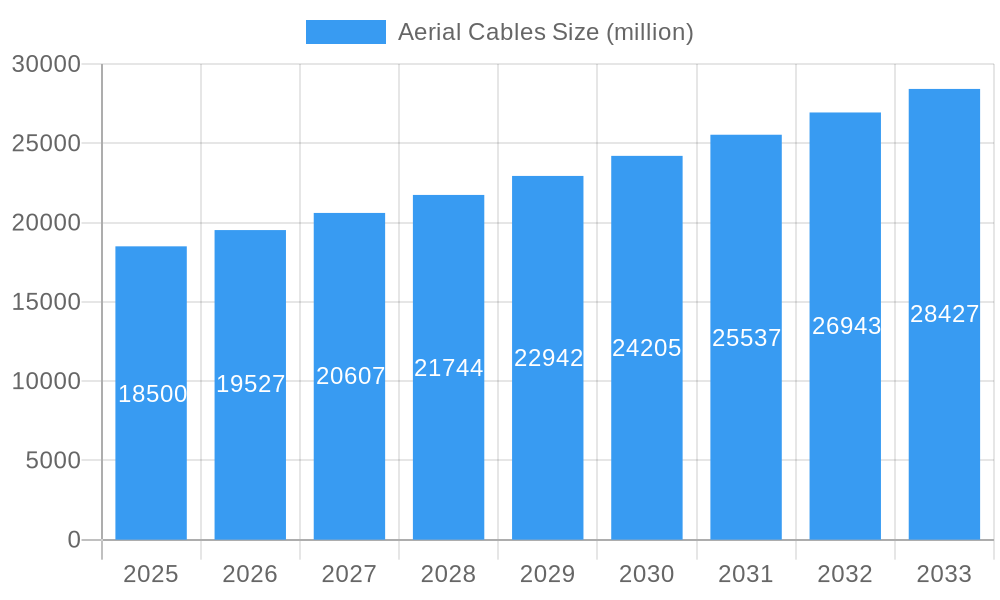
Aerial Cables Market Size (In Billion)

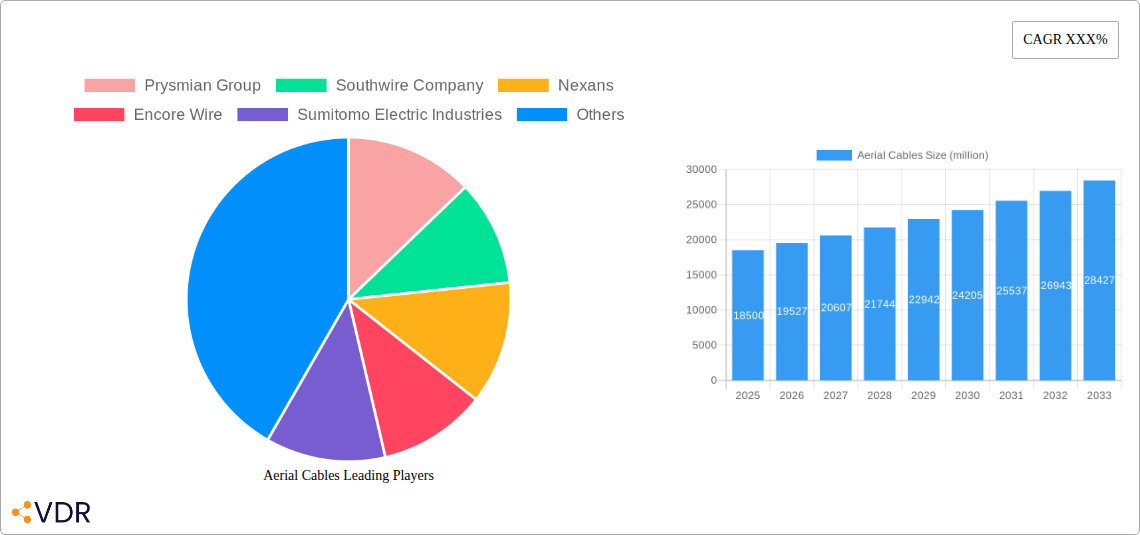
Key applications for aerial cables include power transmission, telecommunications, and industrial use. Conductor types like aluminum conductor steel-reinforced (ACSR) and all-aluminum alloy conductor (AAAC) will see demand influenced by performance and cost. Leading companies such as Prysmian Group, Southwire Company, and Nexans are investing in innovation and production capacity. Challenges include stringent regulatory standards and the impact of extreme weather, necessitating continuous technological advancements and material development for enhanced reliability and resilience.
Aerial Cables Company Market Share
Comprehensive Aerial Cables Market Report: Global Outlook & Future Trajectories (2019-2033)
This in-depth report provides a comprehensive analysis of the global Aerial Cables market, encompassing market dynamics, growth trends, regional dominance, product landscape, key drivers, emerging opportunities, and major players. Leveraging extensive historical data from 2019-2024 and a robust forecast period from 2025-2033, with 2025 as the base and estimated year, this study offers actionable insights for industry stakeholders. We delve into both the parent and child markets, exploring intricate relationships and growth potentials. The report meticulously details quantitative and qualitative factors, providing a 360-degree view of this critical infrastructure component.
Aerial Cables Market Dynamics & Structure
The global Aerial Cables market exhibits a moderate to highly concentrated structure, with leading players like Prysmian Group, Southwire Company, Nexans, and Encore Wire holding significant market shares. Technological innovation serves as a primary driver, fueled by the increasing demand for advanced power transmission and distribution solutions, smart grid integration, and enhanced telecommunications infrastructure. Regulatory frameworks, particularly those promoting renewable energy integration and grid modernization, play a crucial role in shaping market expansion. Competitive product substitutes, while present in certain niche applications, are largely outmatched by the cost-effectiveness and reliability of aerial cables in many scenarios. End-user demographics are diverse, spanning utility companies, telecommunication providers, industrial sectors, and infrastructure development projects. Mergers and acquisitions (M&A) trends are evident, as larger players consolidate their market positions and expand their technological capabilities. For instance, historical M&A activities have seen companies acquiring specialized manufacturers to broaden their product portfolios and geographical reach.
- Market Concentration: Dominated by a few key global manufacturers, with increasing fragmentation in specific regional or niche segments.
- Technological Innovation Drivers: Advancements in conductor materials (e.g., advanced aluminum alloys), insulation technologies for improved durability and safety, and smart cable functionalities.
- Regulatory Frameworks: Government initiatives supporting grid modernization, renewable energy deployment, and digitalization driving demand for high-performance aerial cables.
- Competitive Product Substitutes: Primarily underground cabling for certain applications where aesthetics or land availability are critical, but aerial cables maintain cost and installation advantages.
- End-User Demographics: Utilities (power transmission and distribution), telecommunications (fiber optic and copper networks), industrial plants, transportation infrastructure (railways, airports).
- M&A Trends: Strategic acquisitions aimed at market consolidation, technological integration, and expansion into emerging markets. Deal volumes are projected to remain steady, driven by the need for scale and innovation.
Aerial Cables Growth Trends & Insights
The global Aerial Cables market is poised for robust growth, projected to expand at a Compound Annual Growth Rate (CAGR) of approximately XX% from 2025 to 2033. This expansion is underpinned by a confluence of factors including the escalating global energy demand, the imperative to upgrade aging power grids, and the widespread adoption of renewable energy sources that necessitate efficient and reliable power evacuation infrastructure. The market size, estimated at approximately USD XXXX million in 2025, is forecast to reach USD XXXX million by 2033, reflecting sustained investment in power and telecommunications infrastructure worldwide.
Adoption rates for advanced aerial cable technologies, such as high-voltage direct current (HVDC) aerial cables and composite overhead conductors (ACCC), are on an upward trajectory. These technologies offer superior performance characteristics, including increased current carrying capacity, reduced line losses, and enhanced mechanical strength, making them increasingly attractive for long-distance power transmission and in challenging environmental conditions. Technological disruptions, primarily in material science and manufacturing processes, are enabling the production of lighter, stronger, and more durable aerial cables. This innovation directly impacts the cost-effectiveness and longevity of aerial cable installations, further stimulating market penetration.
Consumer behavior shifts, particularly within the utility sector, are also influencing market dynamics. There's a growing preference for solutions that offer enhanced grid resilience, reduced maintenance costs, and greater flexibility in accommodating future network expansions. The increasing emphasis on smart grids, which integrate advanced communication and control technologies, is driving demand for aerial cables equipped with integrated fiber optics or sensors for real-time monitoring and data transmission. Furthermore, the global push towards electrification of transportation and industries further amplifies the need for robust and expanded electrical infrastructure, directly benefiting the aerial cables market. The penetration of advanced aerial cable solutions is expected to surge as utilities and telecom providers prioritize performance, reliability, and future-proofing their networks.
Dominant Regions, Countries, or Segments in Aerial Cables
The Asia-Pacific region is currently the dominant force in the global Aerial Cables market, driven by its rapid economic development, burgeoning population, and substantial investments in power and telecommunications infrastructure. Countries like China and India are at the forefront, spearheading growth through extensive grid modernization projects, the expansion of renewable energy capacities, and the rollout of 5G networks. The sheer scale of infrastructure development in these nations, coupled with supportive government policies aimed at ensuring reliable energy access and enhancing connectivity, creates a perpetual demand for aerial cables.
Within the Asia-Pacific region, the Application: Power Transmission and Distribution segment is the primary growth engine. This is primarily due to the continuous need to upgrade and expand aging power grids to meet rising energy consumption and integrate intermittent renewable energy sources. The implementation of smart grid technologies further bolsters this segment, as aerial cables are crucial for transmitting both power and data.
- Key Drivers in Asia-Pacific:
- Economic Growth & Urbanization: Rapid industrialization and urbanization lead to increased energy demand and the need for robust power infrastructure.
- Government Initiatives: Strong government support for infrastructure development, renewable energy targets, and rural electrification programs.
- Technological Adoption: Increasing adoption of advanced conductor technologies for enhanced efficiency and capacity.
- Rural Electrification: Efforts to provide electricity to remote and underserved areas, where aerial cables offer cost-effective solutions.
- Telecommunications Expansion: Widespread deployment of fiber optic and copper cables for enhanced connectivity, including 5G rollout.
The Type: High Voltage Aerial Cables segment is experiencing significant traction within this dominant region, reflecting the increasing need for efficient and long-distance power transmission. These cables are essential for connecting power generation sources, often located in remote areas, to urban centers and industrial hubs. The market share within this segment is substantial, estimated at approximately XX% of the total aerial cable market in Asia-Pacific. The growth potential for high-voltage aerial cables remains exceptionally high, projected to grow at a CAGR of XX% through 2033.
Other regions, including North America and Europe, also represent significant markets for aerial cables, driven by grid modernization efforts, replacement of aging infrastructure, and the expansion of telecommunications networks. However, the scale and pace of infrastructure development in Asia-Pacific currently place it in a commanding position.
Aerial Cables Product Landscape
The aerial cables product landscape is characterized by continuous innovation aimed at enhancing performance, durability, and functionality. Key product innovations include advanced conductor designs such as Aluminum Conductor Composite Core (ACCC) and high-performance aluminum alloy conductors, offering superior strength-to-weight ratios and increased conductivity compared to traditional ACSR (Aluminum Conductor Steel Reinforced) cables. These advancements enable higher power transmission capacities over longer distances with reduced sag and improved resistance to environmental stresses. Smart aerial cables, integrating fiber optic strands or sensor technologies, are also gaining prominence, facilitating real-time monitoring of cable health, load, and environmental conditions, crucial for predictive maintenance and grid optimization. Insulation materials are evolving to provide enhanced fire resistance, UV protection, and resistance to extreme temperatures, ensuring reliable operation in diverse climates.
Key Drivers, Barriers & Challenges in Aerial Cables
The key drivers propelling the Aerial Cables market include the escalating global demand for electricity, the imperative to upgrade aging power grids to meet modern standards, and the rapid expansion of renewable energy projects that require efficient power evacuation. Government initiatives promoting grid modernization, smart grid implementation, and rural electrification further fuel market growth. Technological advancements in conductor materials and manufacturing processes, leading to lighter, stronger, and more efficient cables, also act as significant growth accelerators.
- Key Drivers:
- Growing Energy Demand: Global population and economic growth necessitate increased power supply.
- Grid Modernization: Replacing aging infrastructure and enhancing grid resilience.
- Renewable Energy Integration: Efficiently transmitting power from renewable sources.
- Smart Grid Development: Enabling data transmission alongside power.
- Technological Advancements: Improved material science leading to better cable performance.
The primary challenges and restraints facing the Aerial Cables market include the high initial installation costs and the potential for greater vulnerability to extreme weather events compared to underground cables. Supply chain disruptions, particularly concerning raw material availability and price volatility, can impact production costs and delivery timelines. Regulatory hurdles and stringent environmental standards in certain regions can also pose challenges. Moreover, the increasing competition from underground cabling solutions, especially in urban areas where aesthetics and land availability are paramount, presents a significant competitive pressure. The need for specialized skilled labor for installation and maintenance also contributes to operational costs.
- Key Barriers & Challenges:
- High Installation Costs: Significant upfront investment for large-scale projects.
- Weather Vulnerability: Susceptibility to damage from storms, ice, and falling trees.
- Supply Chain Volatility: Fluctuations in raw material prices and availability.
- Regulatory Compliance: Navigating diverse and evolving environmental and safety standards.
- Competition from Underground Cables: Preference in urban settings for aesthetic and security reasons.
- Skilled Labor Shortage: Demand for trained personnel for installation and maintenance.
Emerging Opportunities in Aerial Cables
Emerging opportunities within the Aerial Cables market lie in the development and deployment of advanced conductor technologies capable of higher current carrying capacities and reduced energy losses. The growing need for grid resilience and smart grid integration presents a significant avenue, with opportunities in developing aerial cables equipped with embedded sensors for real-time monitoring and diagnostics. The expansion of telecommunications infrastructure, particularly the rollout of 5G networks, is creating demand for integrated aerial cables that can carry both power and high-speed data. Furthermore, the increasing focus on electrifying transportation and industrial processes will drive demand for robust and reliable aerial power transmission solutions. Untapped markets in developing economies with substantial infrastructure deficits also offer considerable growth potential.
Growth Accelerators in the Aerial Cables Industry
Catalysts driving long-term growth in the Aerial Cables industry are multifaceted. Technological breakthroughs in material science, such as the development of novel composite materials offering superior strength and conductivity, are key. Strategic partnerships between cable manufacturers, utility companies, and technology providers are fostering innovation and accelerating the adoption of smart grid solutions. Market expansion strategies, including a focus on emerging economies with significant infrastructure development needs, are critical. The global push towards decarbonization and the increasing reliance on renewable energy sources will continue to be a major growth accelerator, as aerial cables are essential for integrating these power sources into the grid.
Key Players Shaping the Aerial Cables Market
- Prysmian Group
- Southwire Company
- Nexans
- Encore Wire
- Sumitomo Electric Industries
- Furukawa Electric
- LS Cable & System
- Hengtong Group
- ZTT
- Apar Industries
- Tratos Group
Notable Milestones in Aerial Cables Sector
- 2019: Launch of advanced composite overhead conductors (ACCC) with enhanced performance for high-voltage applications.
- 2020: Increased adoption of smart aerial cables with integrated fiber optics for telecommunications and grid monitoring.
- 2021: Significant investments in grid modernization projects across North America and Europe, driving demand for high-performance aerial cables.
- 2022: Growing emphasis on sustainable manufacturing processes for aerial cables, with a focus on recycled materials and energy-efficient production.
- 2023: Expansion of high-capacity aerial cable networks to support the integration of large-scale offshore wind farms in Europe.
- 2024: Strategic partnerships formed for the development of next-generation aerial cables with enhanced cybersecurity features for smart grids.
In-Depth Aerial Cables Market Outlook
The Aerial Cables market is set for a period of sustained growth and transformation, driven by the indispensable role these cables play in global power transmission and telecommunications infrastructure. Future market potential is significant, fueled by ongoing grid modernization efforts, the rapid expansion of renewable energy, and the relentless demand for enhanced digital connectivity. Strategic opportunities lie in the development of innovative, high-performance, and "smart" aerial cable solutions that can address the evolving needs of a more electrified and connected world. Manufacturers focusing on sustainability, cost-efficiency, and resilience will be well-positioned to capitalize on the evolving market landscape.
Aerial Cables Segmentation
-
1. Application
- 1.1. undefined
-
2. Type
- 2.1. undefined
Aerial Cables Segmentation By Geography
- 1. undefined
- 2. undefined
- 3. undefined
- 4. undefined
- 5. undefined
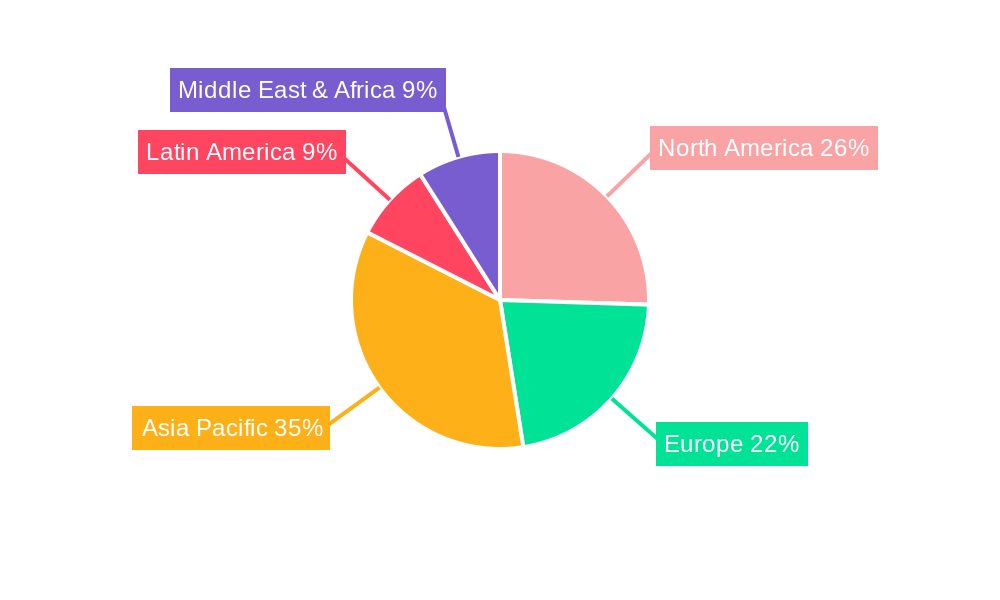
Aerial Cables Regional Market Share
Geographic Coverage of Aerial Cables
Aerial Cables REPORT HIGHLIGHTS
| Aspects | Details |
|---|---|
| Study Period | 2020-2034 |
| Base Year | 2025 |
| Estimated Year | 2026 |
| Forecast Period | 2026-2034 |
| Historical Period | 2020-2025 |
| Growth Rate | CAGR of 5.82% from 2020-2034 |
| Segmentation |
|
Table of Contents
- 1. Introduction
- 1.1. Research Scope
- 1.2. Market Segmentation
- 1.3. Research Methodology
- 1.4. Definitions and Assumptions
- 2. Executive Summary
- 2.1. Introduction
- 3. Market Dynamics
- 3.1. Introduction
- 3.2. Market Drivers
- 3.3. Market Restrains
- 3.4. Market Trends
- 4. Market Factor Analysis
- 4.1. Porters Five Forces
- 4.2. Supply/Value Chain
- 4.3. PESTEL analysis
- 4.4. Market Entropy
- 4.5. Patent/Trademark Analysis
- 5. Global Aerial Cables Analysis, Insights and Forecast, 2020-2032
- 5.1. Market Analysis, Insights and Forecast - by Application
- 5.1.1.
- 5.2. Market Analysis, Insights and Forecast - by Type
- 5.2.1.
- 5.3. Market Analysis, Insights and Forecast - by Region
- 5.3.1.
- 5.3.2.
- 5.3.3.
- 5.3.4.
- 5.3.5.
- 5.1. Market Analysis, Insights and Forecast - by Application
- 6. undefined Aerial Cables Analysis, Insights and Forecast, 2020-2032
- 6.1. Market Analysis, Insights and Forecast - by Application
- 6.1.1.
- 6.2. Market Analysis, Insights and Forecast - by Type
- 6.2.1.
- 6.1. Market Analysis, Insights and Forecast - by Application
- 7. undefined Aerial Cables Analysis, Insights and Forecast, 2020-2032
- 7.1. Market Analysis, Insights and Forecast - by Application
- 7.1.1.
- 7.2. Market Analysis, Insights and Forecast - by Type
- 7.2.1.
- 7.1. Market Analysis, Insights and Forecast - by Application
- 8. undefined Aerial Cables Analysis, Insights and Forecast, 2020-2032
- 8.1. Market Analysis, Insights and Forecast - by Application
- 8.1.1.
- 8.2. Market Analysis, Insights and Forecast - by Type
- 8.2.1.
- 8.1. Market Analysis, Insights and Forecast - by Application
- 9. undefined Aerial Cables Analysis, Insights and Forecast, 2020-2032
- 9.1. Market Analysis, Insights and Forecast - by Application
- 9.1.1.
- 9.2. Market Analysis, Insights and Forecast - by Type
- 9.2.1.
- 9.1. Market Analysis, Insights and Forecast - by Application
- 10. undefined Aerial Cables Analysis, Insights and Forecast, 2020-2032
- 10.1. Market Analysis, Insights and Forecast - by Application
- 10.1.1.
- 10.2. Market Analysis, Insights and Forecast - by Type
- 10.2.1.
- 10.1. Market Analysis, Insights and Forecast - by Application
- 11. Competitive Analysis
- 11.1. Global Market Share Analysis 2025
- 11.2. Company Profiles
- 11.2.1 Prysmian Group
- 11.2.1.1. Overview
- 11.2.1.2. Products
- 11.2.1.3. SWOT Analysis
- 11.2.1.4. Recent Developments
- 11.2.1.5. Financials (Based on Availability)
- 11.2.2 Southwire Company
- 11.2.2.1. Overview
- 11.2.2.2. Products
- 11.2.2.3. SWOT Analysis
- 11.2.2.4. Recent Developments
- 11.2.2.5. Financials (Based on Availability)
- 11.2.3 Nexans
- 11.2.3.1. Overview
- 11.2.3.2. Products
- 11.2.3.3. SWOT Analysis
- 11.2.3.4. Recent Developments
- 11.2.3.5. Financials (Based on Availability)
- 11.2.4 Encore Wire
- 11.2.4.1. Overview
- 11.2.4.2. Products
- 11.2.4.3. SWOT Analysis
- 11.2.4.4. Recent Developments
- 11.2.4.5. Financials (Based on Availability)
- 11.2.5 Sumitomo Electric Industries
- 11.2.5.1. Overview
- 11.2.5.2. Products
- 11.2.5.3. SWOT Analysis
- 11.2.5.4. Recent Developments
- 11.2.5.5. Financials (Based on Availability)
- 11.2.6 Furukawa Electric
- 11.2.6.1. Overview
- 11.2.6.2. Products
- 11.2.6.3. SWOT Analysis
- 11.2.6.4. Recent Developments
- 11.2.6.5. Financials (Based on Availability)
- 11.2.7 LS Cable & System
- 11.2.7.1. Overview
- 11.2.7.2. Products
- 11.2.7.3. SWOT Analysis
- 11.2.7.4. Recent Developments
- 11.2.7.5. Financials (Based on Availability)
- 11.2.8 Hengtong Group
- 11.2.8.1. Overview
- 11.2.8.2. Products
- 11.2.8.3. SWOT Analysis
- 11.2.8.4. Recent Developments
- 11.2.8.5. Financials (Based on Availability)
- 11.2.9 ZTT
- 11.2.9.1. Overview
- 11.2.9.2. Products
- 11.2.9.3. SWOT Analysis
- 11.2.9.4. Recent Developments
- 11.2.9.5. Financials (Based on Availability)
- 11.2.10 Apar Industries
- 11.2.10.1. Overview
- 11.2.10.2. Products
- 11.2.10.3. SWOT Analysis
- 11.2.10.4. Recent Developments
- 11.2.10.5. Financials (Based on Availability)
- 11.2.11 Tratos Group
- 11.2.11.1. Overview
- 11.2.11.2. Products
- 11.2.11.3. SWOT Analysis
- 11.2.11.4. Recent Developments
- 11.2.11.5. Financials (Based on Availability)
- 11.2.1 Prysmian Group
List of Figures
- Figure 1: Global Aerial Cables Revenue Breakdown (billion, %) by Region 2025 & 2033
- Figure 2: Global Aerial Cables Volume Breakdown (K, %) by Region 2025 & 2033
- Figure 3: undefined Aerial Cables Revenue (billion), by Application 2025 & 2033
- Figure 4: undefined Aerial Cables Volume (K), by Application 2025 & 2033
- Figure 5: undefined Aerial Cables Revenue Share (%), by Application 2025 & 2033
- Figure 6: undefined Aerial Cables Volume Share (%), by Application 2025 & 2033
- Figure 7: undefined Aerial Cables Revenue (billion), by Type 2025 & 2033
- Figure 8: undefined Aerial Cables Volume (K), by Type 2025 & 2033
- Figure 9: undefined Aerial Cables Revenue Share (%), by Type 2025 & 2033
- Figure 10: undefined Aerial Cables Volume Share (%), by Type 2025 & 2033
- Figure 11: undefined Aerial Cables Revenue (billion), by Country 2025 & 2033
- Figure 12: undefined Aerial Cables Volume (K), by Country 2025 & 2033
- Figure 13: undefined Aerial Cables Revenue Share (%), by Country 2025 & 2033
- Figure 14: undefined Aerial Cables Volume Share (%), by Country 2025 & 2033
- Figure 15: undefined Aerial Cables Revenue (billion), by Application 2025 & 2033
- Figure 16: undefined Aerial Cables Volume (K), by Application 2025 & 2033
- Figure 17: undefined Aerial Cables Revenue Share (%), by Application 2025 & 2033
- Figure 18: undefined Aerial Cables Volume Share (%), by Application 2025 & 2033
- Figure 19: undefined Aerial Cables Revenue (billion), by Type 2025 & 2033
- Figure 20: undefined Aerial Cables Volume (K), by Type 2025 & 2033
- Figure 21: undefined Aerial Cables Revenue Share (%), by Type 2025 & 2033
- Figure 22: undefined Aerial Cables Volume Share (%), by Type 2025 & 2033
- Figure 23: undefined Aerial Cables Revenue (billion), by Country 2025 & 2033
- Figure 24: undefined Aerial Cables Volume (K), by Country 2025 & 2033
- Figure 25: undefined Aerial Cables Revenue Share (%), by Country 2025 & 2033
- Figure 26: undefined Aerial Cables Volume Share (%), by Country 2025 & 2033
- Figure 27: undefined Aerial Cables Revenue (billion), by Application 2025 & 2033
- Figure 28: undefined Aerial Cables Volume (K), by Application 2025 & 2033
- Figure 29: undefined Aerial Cables Revenue Share (%), by Application 2025 & 2033
- Figure 30: undefined Aerial Cables Volume Share (%), by Application 2025 & 2033
- Figure 31: undefined Aerial Cables Revenue (billion), by Type 2025 & 2033
- Figure 32: undefined Aerial Cables Volume (K), by Type 2025 & 2033
- Figure 33: undefined Aerial Cables Revenue Share (%), by Type 2025 & 2033
- Figure 34: undefined Aerial Cables Volume Share (%), by Type 2025 & 2033
- Figure 35: undefined Aerial Cables Revenue (billion), by Country 2025 & 2033
- Figure 36: undefined Aerial Cables Volume (K), by Country 2025 & 2033
- Figure 37: undefined Aerial Cables Revenue Share (%), by Country 2025 & 2033
- Figure 38: undefined Aerial Cables Volume Share (%), by Country 2025 & 2033
- Figure 39: undefined Aerial Cables Revenue (billion), by Application 2025 & 2033
- Figure 40: undefined Aerial Cables Volume (K), by Application 2025 & 2033
- Figure 41: undefined Aerial Cables Revenue Share (%), by Application 2025 & 2033
- Figure 42: undefined Aerial Cables Volume Share (%), by Application 2025 & 2033
- Figure 43: undefined Aerial Cables Revenue (billion), by Type 2025 & 2033
- Figure 44: undefined Aerial Cables Volume (K), by Type 2025 & 2033
- Figure 45: undefined Aerial Cables Revenue Share (%), by Type 2025 & 2033
- Figure 46: undefined Aerial Cables Volume Share (%), by Type 2025 & 2033
- Figure 47: undefined Aerial Cables Revenue (billion), by Country 2025 & 2033
- Figure 48: undefined Aerial Cables Volume (K), by Country 2025 & 2033
- Figure 49: undefined Aerial Cables Revenue Share (%), by Country 2025 & 2033
- Figure 50: undefined Aerial Cables Volume Share (%), by Country 2025 & 2033
- Figure 51: undefined Aerial Cables Revenue (billion), by Application 2025 & 2033
- Figure 52: undefined Aerial Cables Volume (K), by Application 2025 & 2033
- Figure 53: undefined Aerial Cables Revenue Share (%), by Application 2025 & 2033
- Figure 54: undefined Aerial Cables Volume Share (%), by Application 2025 & 2033
- Figure 55: undefined Aerial Cables Revenue (billion), by Type 2025 & 2033
- Figure 56: undefined Aerial Cables Volume (K), by Type 2025 & 2033
- Figure 57: undefined Aerial Cables Revenue Share (%), by Type 2025 & 2033
- Figure 58: undefined Aerial Cables Volume Share (%), by Type 2025 & 2033
- Figure 59: undefined Aerial Cables Revenue (billion), by Country 2025 & 2033
- Figure 60: undefined Aerial Cables Volume (K), by Country 2025 & 2033
- Figure 61: undefined Aerial Cables Revenue Share (%), by Country 2025 & 2033
- Figure 62: undefined Aerial Cables Volume Share (%), by Country 2025 & 2033
List of Tables
- Table 1: Global Aerial Cables Revenue billion Forecast, by Application 2020 & 2033
- Table 2: Global Aerial Cables Volume K Forecast, by Application 2020 & 2033
- Table 3: Global Aerial Cables Revenue billion Forecast, by Type 2020 & 2033
- Table 4: Global Aerial Cables Volume K Forecast, by Type 2020 & 2033
- Table 5: Global Aerial Cables Revenue billion Forecast, by Region 2020 & 2033
- Table 6: Global Aerial Cables Volume K Forecast, by Region 2020 & 2033
- Table 7: Global Aerial Cables Revenue billion Forecast, by Application 2020 & 2033
- Table 8: Global Aerial Cables Volume K Forecast, by Application 2020 & 2033
- Table 9: Global Aerial Cables Revenue billion Forecast, by Type 2020 & 2033
- Table 10: Global Aerial Cables Volume K Forecast, by Type 2020 & 2033
- Table 11: Global Aerial Cables Revenue billion Forecast, by Country 2020 & 2033
- Table 12: Global Aerial Cables Volume K Forecast, by Country 2020 & 2033
- Table 13: Global Aerial Cables Revenue billion Forecast, by Application 2020 & 2033
- Table 14: Global Aerial Cables Volume K Forecast, by Application 2020 & 2033
- Table 15: Global Aerial Cables Revenue billion Forecast, by Type 2020 & 2033
- Table 16: Global Aerial Cables Volume K Forecast, by Type 2020 & 2033
- Table 17: Global Aerial Cables Revenue billion Forecast, by Country 2020 & 2033
- Table 18: Global Aerial Cables Volume K Forecast, by Country 2020 & 2033
- Table 19: Global Aerial Cables Revenue billion Forecast, by Application 2020 & 2033
- Table 20: Global Aerial Cables Volume K Forecast, by Application 2020 & 2033
- Table 21: Global Aerial Cables Revenue billion Forecast, by Type 2020 & 2033
- Table 22: Global Aerial Cables Volume K Forecast, by Type 2020 & 2033
- Table 23: Global Aerial Cables Revenue billion Forecast, by Country 2020 & 2033
- Table 24: Global Aerial Cables Volume K Forecast, by Country 2020 & 2033
- Table 25: Global Aerial Cables Revenue billion Forecast, by Application 2020 & 2033
- Table 26: Global Aerial Cables Volume K Forecast, by Application 2020 & 2033
- Table 27: Global Aerial Cables Revenue billion Forecast, by Type 2020 & 2033
- Table 28: Global Aerial Cables Volume K Forecast, by Type 2020 & 2033
- Table 29: Global Aerial Cables Revenue billion Forecast, by Country 2020 & 2033
- Table 30: Global Aerial Cables Volume K Forecast, by Country 2020 & 2033
- Table 31: Global Aerial Cables Revenue billion Forecast, by Application 2020 & 2033
- Table 32: Global Aerial Cables Volume K Forecast, by Application 2020 & 2033
- Table 33: Global Aerial Cables Revenue billion Forecast, by Type 2020 & 2033
- Table 34: Global Aerial Cables Volume K Forecast, by Type 2020 & 2033
- Table 35: Global Aerial Cables Revenue billion Forecast, by Country 2020 & 2033
- Table 36: Global Aerial Cables Volume K Forecast, by Country 2020 & 2033
Frequently Asked Questions
1. What is the projected Compound Annual Growth Rate (CAGR) of the Aerial Cables?
The projected CAGR is approximately 5.82%.
2. Which companies are prominent players in the Aerial Cables?
Key companies in the market include Prysmian Group, Southwire Company, Nexans, Encore Wire, Sumitomo Electric Industries, Furukawa Electric, LS Cable & System, Hengtong Group, ZTT, Apar Industries, Tratos Group.
3. What are the main segments of the Aerial Cables?
The market segments include Application, Type.
4. Can you provide details about the market size?
The market size is estimated to be USD 33.49 billion as of 2022.
5. What are some drivers contributing to market growth?
N/A
6. What are the notable trends driving market growth?
N/A
7. Are there any restraints impacting market growth?
N/A
8. Can you provide examples of recent developments in the market?
N/A
9. What pricing options are available for accessing the report?
Pricing options include single-user, multi-user, and enterprise licenses priced at USD 3950.00, USD 5925.00, and USD 7900.00 respectively.
10. Is the market size provided in terms of value or volume?
The market size is provided in terms of value, measured in billion and volume, measured in K.
11. Are there any specific market keywords associated with the report?
Yes, the market keyword associated with the report is "Aerial Cables," which aids in identifying and referencing the specific market segment covered.
12. How do I determine which pricing option suits my needs best?
The pricing options vary based on user requirements and access needs. Individual users may opt for single-user licenses, while businesses requiring broader access may choose multi-user or enterprise licenses for cost-effective access to the report.
13. Are there any additional resources or data provided in the Aerial Cables report?
While the report offers comprehensive insights, it's advisable to review the specific contents or supplementary materials provided to ascertain if additional resources or data are available.
14. How can I stay updated on further developments or reports in the Aerial Cables?
To stay informed about further developments, trends, and reports in the Aerial Cables, consider subscribing to industry newsletters, following relevant companies and organizations, or regularly checking reputable industry news sources and publications.
Methodology
Step 1 - Identification of Relevant Samples Size from Population Database


Step 2 - Approaches for Defining Global Market Size (Value, Volume* & Price*)

Note*: In applicable scenarios
Step 3 - Data Sources
Primary Research
- Web Analytics
- Survey Reports
- Research Institute
- Latest Research Reports
- Opinion Leaders
Secondary Research
- Annual Reports
- White Paper
- Latest Press Release
- Industry Association
- Paid Database
- Investor Presentations

Step 4 - Data Triangulation
Involves using different sources of information in order to increase the validity of a study
These sources are likely to be stakeholders in a program - participants, other researchers, program staff, other community members, and so on.
Then we put all data in single framework & apply various statistical tools to find out the dynamic on the market.
During the analysis stage, feedback from the stakeholder groups would be compared to determine areas of agreement as well as areas of divergence