
Key Insights
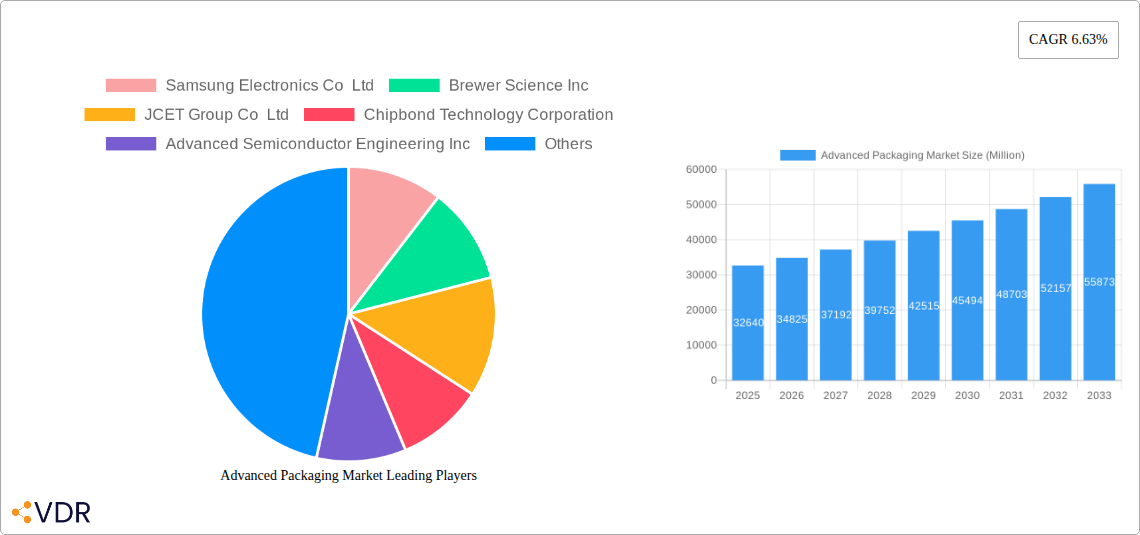
The advanced packaging market is experiencing robust growth, projected to reach \$32.64 billion in 2025 and expand at a Compound Annual Growth Rate (CAGR) of 6.63% from 2025 to 2033. This expansion is driven by several key factors. The increasing demand for high-performance computing (HPC), artificial intelligence (AI), and 5G technologies necessitates advanced packaging solutions to enable smaller, faster, and more power-efficient devices. Miniaturization trends in electronics, coupled with the need for increased integration and improved thermal management, are further fueling market growth. Furthermore, the rise of heterogeneous integration, which combines different types of chips on a single package, is creating significant opportunities for advanced packaging technologies. The shift towards advanced nodes in semiconductor manufacturing also significantly contributes to the market's growth trajectory. Specific packaging platforms like Flip Chip, Embedded Die, and the increasingly prevalent 2.5D/3D packaging (Fi-WLP and Fo-WLP) are experiencing particularly strong adoption rates due to their capabilities in delivering superior performance and density.
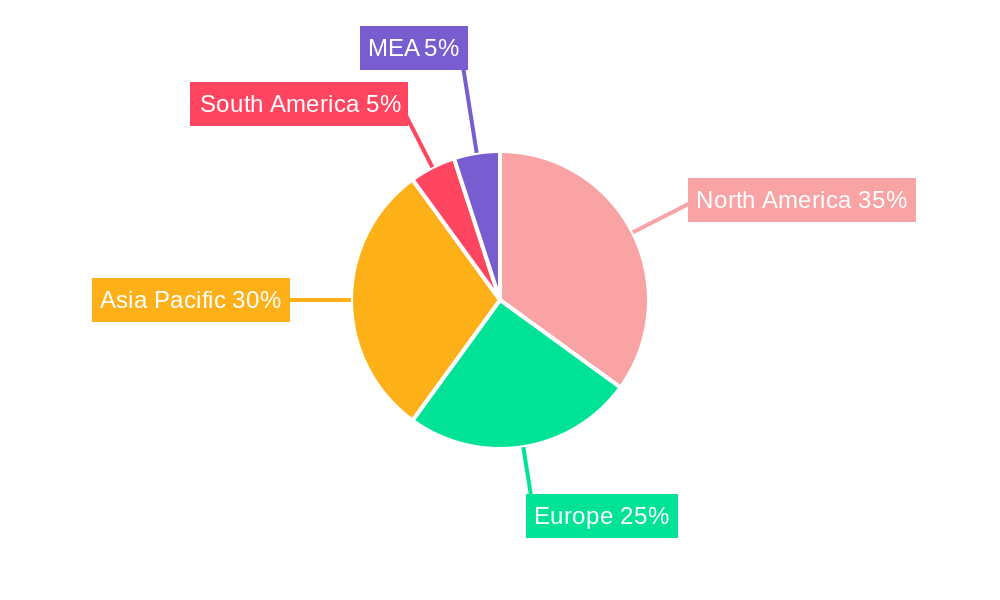
Major players like Samsung Electronics, Intel, TSMC, and Amkor Technology are actively investing in research and development, expanding their manufacturing capabilities, and strategically acquiring smaller companies to solidify their market positions. Geographic expansion is also a key feature of this market, with North America, Asia-Pacific (particularly China, South Korea, and Japan), and Europe representing significant revenue streams. While the market faces challenges like high initial investment costs associated with advanced packaging technologies and potential supply chain complexities, the long-term growth prospects remain exceedingly positive, driven by continuous innovation and the unrelenting demand for higher performance in electronics across various applications. The market segmentation by packaging platform provides further insights into the technology advancements and market share held by each type, allowing for granular market analysis and future projection based on observed adoption patterns and technology roadmaps from key players.
Advanced Packaging Market Report: 2019-2033 Forecast
This comprehensive report provides an in-depth analysis of the Advanced Packaging Market, encompassing market dynamics, growth trends, regional segmentation, product landscape, key players, and future outlook. The report covers the historical period (2019-2024), base year (2025), and forecast period (2025-2033), offering valuable insights for industry professionals, investors, and stakeholders. The parent market is the broader Semiconductor Packaging market, while the child market focuses specifically on advanced packaging technologies. Market values are presented in million units.
Advanced Packaging Market Market Dynamics & Structure
The Advanced Packaging market is characterized by a moderately concentrated landscape with a few dominant players and several smaller, specialized firms. Technological innovation, particularly in areas like 3D packaging and chiplet integration, is a key driver, while regulatory frameworks concerning material sourcing and environmental impact play a significant role. Competitive product substitutes are limited, as advanced packaging solutions offer unique performance advantages. End-user demographics are primarily driven by the electronics, automotive, and communication sectors. M&A activity has been significant, with strategic acquisitions aimed at expanding technological capabilities and market share.
- Market Concentration: xx% controlled by top 5 players (2024).
- Technological Innovation: Focus on 3D stacking, chiplets, and heterogeneous integration.
- Regulatory Frameworks: Growing emphasis on sustainability and material traceability.
- Competitive Substitutes: Limited, due to performance advantages of advanced packaging.
- End-User Demographics: Strong demand from electronics, automotive, and communication sectors.
- M&A Trends: xx deals recorded in the past 5 years, with a focus on technology acquisition and market expansion.
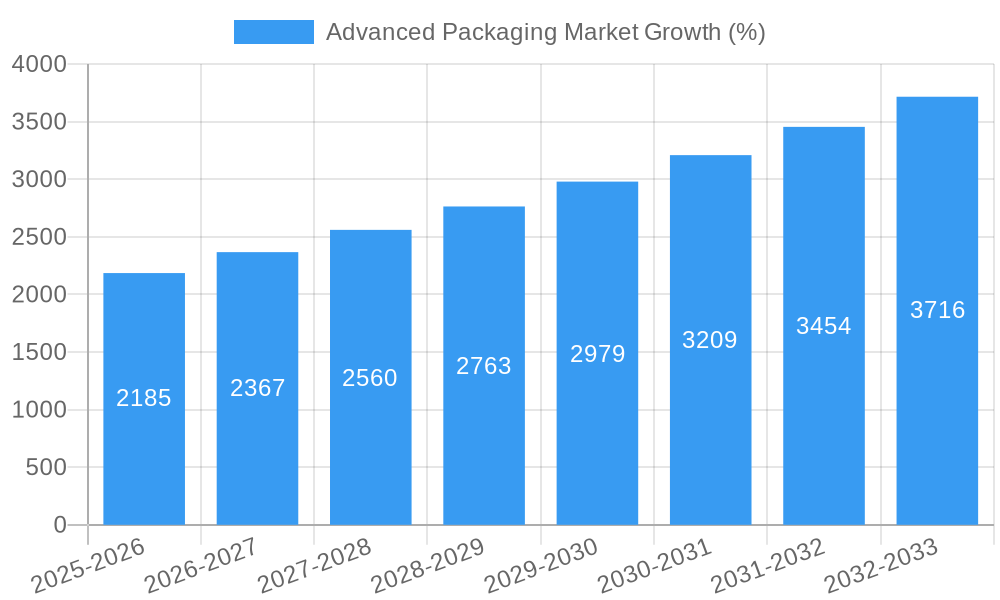
Advanced Packaging Market Growth Trends & Insights
The Advanced Packaging market has witnessed significant growth over the past few years, driven by increasing demand for higher performance, smaller form factor, and lower power consumption electronics. The market size is projected to reach xx million units by 2025, growing at a CAGR of xx% during the forecast period (2025-2033). This growth is fueled by the adoption of advanced packaging technologies in high-growth segments like smartphones, high-performance computing, and autonomous vehicles. Technological disruptions, such as the emergence of chiplet technology, are further accelerating market expansion. Consumer behavior shifts towards advanced mobile and computing devices also contribute to this growth trend.
- Market Size: xx million units (2025), projected to reach xx million units by 2033.
- CAGR: xx% (2025-2033)
- Market Penetration: xx% in key end-user sectors (2025).
Dominant Regions, Countries, or Segments in Advanced Packaging Market
The Asia-Pacific region, particularly countries like Taiwan, South Korea, and China, dominates the Advanced Packaging market, driven by the concentration of semiconductor manufacturing facilities and a strong electronics industry. Within packaging platforms, Flip Chip technology currently holds the largest market share, followed by Embedded Die, with Fi-WLP and Fo-WLP exhibiting significant growth potential.
- Leading Region: Asia-Pacific (Market share: xx% in 2025).
- Dominant Countries: Taiwan, South Korea, China.
- Leading Segment (Packaging Platform): Flip Chip (Market share: xx% in 2025).
- Key Drivers: Strong semiconductor manufacturing presence, substantial electronics industry, favorable government policies promoting technological advancements.
Advanced Packaging Market Product Landscape
Advanced packaging solutions offer significant improvements in performance, power efficiency, and size reduction compared to traditional packaging methods. Innovations in materials science, process technology, and design methodologies contribute to enhanced thermal management, improved signal integrity, and increased interconnect density. Unique selling propositions include miniaturization, higher bandwidth, and reduced power consumption. Technological advancements focus on 3D integration, chiplet-based systems, and advanced substrate materials.
Key Drivers, Barriers & Challenges in Advanced Packaging Market
Key Drivers:
- Increasing demand for high-performance electronics.
- Miniaturization trends in consumer electronics and data centers.
- Growing adoption of advanced silicon technologies (e.g., chiplets).
- Government initiatives promoting semiconductor manufacturing.
Key Challenges and Restraints:
- High capital expenditure requirements for advanced packaging technologies.
- Complex manufacturing processes and yield challenges.
- Supply chain disruptions and material scarcity.
- Intense competition among OSAT providers.
- Estimated impact: xx% reduction in market growth in 2024 due to supply chain issues.
Emerging Opportunities in Advanced Packaging Market
- Expansion into new applications such as automotive electronics and medical devices.
- Development of advanced packaging solutions for AI and high-performance computing.
- Adoption of sustainable and environmentally friendly packaging materials.
- Growth of outsourced semiconductor assembly and test (OSAT) services.
Growth Accelerators in the Advanced Packaging Market Industry
Technological breakthroughs, such as advancements in 3D packaging and heterogeneous integration, are significantly accelerating the market's growth. Strategic partnerships among semiconductor manufacturers, packaging companies, and materials suppliers are fostering innovation and enhancing supply chain efficiency. Market expansion strategies targeting high-growth sectors like 5G infrastructure and AI applications are driving considerable market expansion.
Key Players Shaping the Advanced Packaging Market Market
- Samsung Electronics Co Ltd
- Brewer Science Inc
- JCET Group Co Ltd
- Chipbond Technology Corporation
- Advanced Semiconductor Engineering Inc
- Amkor Technology Inc
- Universal Instruments Corporation
- Taiwan Semiconductor Manufacturing Company Limited
- ChipMOS Technologies Inc
- Intel Corporation
Notable Milestones in Advanced Packaging Market Sector
- October 2023: Advanced Semiconductor Engineering Inc. (ASE) launched its Integrated Design Ecosystem (IDE), a collaborative design toolset for advanced package architecture.
- June 2023: Amkor Technology Inc. highlighted its innovation in advanced packaging for the automotive industry, leveraging its extensive automotive experience.
In-Depth Advanced Packaging Market Market Outlook
The Advanced Packaging market is poised for sustained growth driven by the increasing demand for miniaturized, high-performance, and power-efficient electronic devices. Strategic investments in R&D, collaborative partnerships, and expansion into high-growth application areas will further fuel market expansion. Companies that can effectively navigate technological advancements, supply chain complexities, and competitive pressures will be best positioned to capture significant market share.
Advanced Packaging Market Segmentation
-
1. Packaging Platform
- 1.1. Flip Chip
- 1.2. Embedded Die
- 1.3. Fi-WLP
- 1.4. Fo-WLP
- 1.5. 2.5D/3D
-
2. Application
- 2.1. Smartphones
- 2.2. Tablets
- 2.3. Laptops
- 2.4. Data centers
- 2.5. High-performance computing (HPC)
-
3. Region
- 3.1. Asia Pacific
- 3.2. North America
- 3.3. Europe
Advanced Packaging Market Segmentation By Geography
- 1. North America
- 2. Europe
- 3. Asia
- 4. Australia and New Zealand
- 5. Latin America
- 6. Middle East and Africa
Advanced Packaging Market REPORT HIGHLIGHTS
| Aspects | Details |
|---|---|
| Study Period | 2019-2033 |
| Base Year | 2024 |
| Estimated Year | 2025 |
| Forecast Period | 2025-2033 |
| Historical Period | 2019-2024 |
| Growth Rate | CAGR of 6.63% from 2019-2033 |
| Segmentation |
|
Table of Contents
- 1. Introduction
- 1.1. Research Scope
- 1.2. Market Segmentation
- 1.3. Research Methodology
- 1.4. Definitions and Assumptions
- 2. Executive Summary
- 2.1. Introduction
- 3. Market Dynamics
- 3.1. Introduction
- 3.2. Market Drivers
- 3.2.1. Increasing Trend of Advanced Architecture in Electronic Products; Favorable Government Policies and Regulations in Developing Countries
- 3.3. Market Restrains
- 3.3.1. Market Consolidation affecting Overall Profitability
- 3.4. Market Trends
- 3.4.1. Embedded Die to Witness Significant Growth Rate
- 4. Market Factor Analysis
- 4.1. Porters Five Forces
- 4.2. Supply/Value Chain
- 4.3. PESTEL analysis
- 4.4. Market Entropy
- 4.5. Patent/Trademark Analysis
- 5. Global Advanced Packaging Market Analysis, Insights and Forecast, 2019-2031
- 5.1. Market Analysis, Insights and Forecast - by Packaging Platform
- 5.1.1. Flip Chip
- 5.1.2. Embedded Die
- 5.1.3. Fi-WLP
- 5.1.4. Fo-WLP
- 5.1.5. 2.5D/3D
- 5.2. Market Analysis, Insights and Forecast - by Application
- 5.2.1. Smartphones
- 5.2.2. Tablets
- 5.2.3. Laptops
- 5.2.4. Data centers
- 5.2.5. High-performance computing (HPC)
- 5.3. Market Analysis, Insights and Forecast - by Region
- 5.3.1. Asia Pacific
- 5.3.2. North America
- 5.3.3. Europe
- 5.4. Market Analysis, Insights and Forecast - by Region
- 5.4.1. North America
- 5.4.2. Europe
- 5.4.3. Asia
- 5.4.4. Australia and New Zealand
- 5.4.5. Latin America
- 5.4.6. Middle East and Africa
- 5.1. Market Analysis, Insights and Forecast - by Packaging Platform
- 6. North America Advanced Packaging Market Analysis, Insights and Forecast, 2019-2031
- 6.1. Market Analysis, Insights and Forecast - by Packaging Platform
- 6.1.1. Flip Chip
- 6.1.2. Embedded Die
- 6.1.3. Fi-WLP
- 6.1.4. Fo-WLP
- 6.1.5. 2.5D/3D
- 6.2. Market Analysis, Insights and Forecast - by Application
- 6.2.1. Smartphones
- 6.2.2. Tablets
- 6.2.3. Laptops
- 6.2.4. Data centers
- 6.2.5. High-performance computing (HPC)
- 6.3. Market Analysis, Insights and Forecast - by Region
- 6.3.1. Asia Pacific
- 6.3.2. North America
- 6.3.3. Europe
- 6.1. Market Analysis, Insights and Forecast - by Packaging Platform
- 7. Europe Advanced Packaging Market Analysis, Insights and Forecast, 2019-2031
- 7.1. Market Analysis, Insights and Forecast - by Packaging Platform
- 7.1.1. Flip Chip
- 7.1.2. Embedded Die
- 7.1.3. Fi-WLP
- 7.1.4. Fo-WLP
- 7.1.5. 2.5D/3D
- 7.2. Market Analysis, Insights and Forecast - by Application
- 7.2.1. Smartphones
- 7.2.2. Tablets
- 7.2.3. Laptops
- 7.2.4. Data centers
- 7.2.5. High-performance computing (HPC)
- 7.3. Market Analysis, Insights and Forecast - by Region
- 7.3.1. Asia Pacific
- 7.3.2. North America
- 7.3.3. Europe
- 7.1. Market Analysis, Insights and Forecast - by Packaging Platform
- 8. Asia Advanced Packaging Market Analysis, Insights and Forecast, 2019-2031
- 8.1. Market Analysis, Insights and Forecast - by Packaging Platform
- 8.1.1. Flip Chip
- 8.1.2. Embedded Die
- 8.1.3. Fi-WLP
- 8.1.4. Fo-WLP
- 8.1.5. 2.5D/3D
- 8.2. Market Analysis, Insights and Forecast - by Application
- 8.2.1. Smartphones
- 8.2.2. Tablets
- 8.2.3. Laptops
- 8.2.4. Data centers
- 8.2.5. High-performance computing (HPC)
- 8.3. Market Analysis, Insights and Forecast - by Region
- 8.3.1. Asia Pacific
- 8.3.2. North America
- 8.3.3. Europe
- 8.1. Market Analysis, Insights and Forecast - by Packaging Platform
- 9. Australia and New Zealand Advanced Packaging Market Analysis, Insights and Forecast, 2019-2031
- 9.1. Market Analysis, Insights and Forecast - by Packaging Platform
- 9.1.1. Flip Chip
- 9.1.2. Embedded Die
- 9.1.3. Fi-WLP
- 9.1.4. Fo-WLP
- 9.1.5. 2.5D/3D
- 9.2. Market Analysis, Insights and Forecast - by Application
- 9.2.1. Smartphones
- 9.2.2. Tablets
- 9.2.3. Laptops
- 9.2.4. Data centers
- 9.2.5. High-performance computing (HPC)
- 9.3. Market Analysis, Insights and Forecast - by Region
- 9.3.1. Asia Pacific
- 9.3.2. North America
- 9.3.3. Europe
- 9.1. Market Analysis, Insights and Forecast - by Packaging Platform
- 10. Latin America Advanced Packaging Market Analysis, Insights and Forecast, 2019-2031
- 10.1. Market Analysis, Insights and Forecast - by Packaging Platform
- 10.1.1. Flip Chip
- 10.1.2. Embedded Die
- 10.1.3. Fi-WLP
- 10.1.4. Fo-WLP
- 10.1.5. 2.5D/3D
- 10.2. Market Analysis, Insights and Forecast - by Application
- 10.2.1. Smartphones
- 10.2.2. Tablets
- 10.2.3. Laptops
- 10.2.4. Data centers
- 10.2.5. High-performance computing (HPC)
- 10.3. Market Analysis, Insights and Forecast - by Region
- 10.3.1. Asia Pacific
- 10.3.2. North America
- 10.3.3. Europe
- 10.1. Market Analysis, Insights and Forecast - by Packaging Platform
- 11. Middle East and Africa Advanced Packaging Market Analysis, Insights and Forecast, 2019-2031
- 11.1. Market Analysis, Insights and Forecast - by Packaging Platform
- 11.1.1. Flip Chip
- 11.1.2. Embedded Die
- 11.1.3. Fi-WLP
- 11.1.4. Fo-WLP
- 11.1.5. 2.5D/3D
- 11.2. Market Analysis, Insights and Forecast - by Application
- 11.2.1. Smartphones
- 11.2.2. Tablets
- 11.2.3. Laptops
- 11.2.4. Data centers
- 11.2.5. High-performance computing (HPC)
- 11.3. Market Analysis, Insights and Forecast - by Region
- 11.3.1. Asia Pacific
- 11.3.2. North America
- 11.3.3. Europe
- 11.1. Market Analysis, Insights and Forecast - by Packaging Platform
- 12. North America Advanced Packaging Market Analysis, Insights and Forecast, 2019-2031
- 12.1. Market Analysis, Insights and Forecast - By Country/Sub-region
- 12.1.1 United States
- 12.1.2 Canada
- 12.1.3 Mexico
- 13. Europe Advanced Packaging Market Analysis, Insights and Forecast, 2019-2031
- 13.1. Market Analysis, Insights and Forecast - By Country/Sub-region
- 13.1.1 Germany
- 13.1.2 United Kingdom
- 13.1.3 France
- 13.1.4 Spain
- 13.1.5 Italy
- 13.1.6 Spain
- 13.1.7 Belgium
- 13.1.8 Netherland
- 13.1.9 Nordics
- 13.1.10 Rest of Europe
- 14. Asia Pacific Advanced Packaging Market Analysis, Insights and Forecast, 2019-2031
- 14.1. Market Analysis, Insights and Forecast - By Country/Sub-region
- 14.1.1 China
- 14.1.2 Japan
- 14.1.3 India
- 14.1.4 South Korea
- 14.1.5 Southeast Asia
- 14.1.6 Australia
- 14.1.7 Indonesia
- 14.1.8 Phillipes
- 14.1.9 Singapore
- 14.1.10 Thailandc
- 14.1.11 Rest of Asia Pacific
- 15. South America Advanced Packaging Market Analysis, Insights and Forecast, 2019-2031
- 15.1. Market Analysis, Insights and Forecast - By Country/Sub-region
- 15.1.1 Brazil
- 15.1.2 Argentina
- 15.1.3 Peru
- 15.1.4 Chile
- 15.1.5 Colombia
- 15.1.6 Ecuador
- 15.1.7 Venezuela
- 15.1.8 Rest of South America
- 16. North America Advanced Packaging Market Analysis, Insights and Forecast, 2019-2031
- 16.1. Market Analysis, Insights and Forecast - By Country/Sub-region
- 16.1.1 United States
- 16.1.2 Canada
- 16.1.3 Mexico
- 17. MEA Advanced Packaging Market Analysis, Insights and Forecast, 2019-2031
- 17.1. Market Analysis, Insights and Forecast - By Country/Sub-region
- 17.1.1 United Arab Emirates
- 17.1.2 Saudi Arabia
- 17.1.3 South Africa
- 17.1.4 Rest of Middle East and Africa
- 18. Competitive Analysis
- 18.1. Global Market Share Analysis 2024
- 18.2. Company Profiles
- 18.2.1 Samsung Electronics Co Ltd
- 18.2.1.1. Overview
- 18.2.1.2. Products
- 18.2.1.3. SWOT Analysis
- 18.2.1.4. Recent Developments
- 18.2.1.5. Financials (Based on Availability)
- 18.2.2 Brewer Science Inc
- 18.2.2.1. Overview
- 18.2.2.2. Products
- 18.2.2.3. SWOT Analysis
- 18.2.2.4. Recent Developments
- 18.2.2.5. Financials (Based on Availability)
- 18.2.3 JCET Group Co Ltd
- 18.2.3.1. Overview
- 18.2.3.2. Products
- 18.2.3.3. SWOT Analysis
- 18.2.3.4. Recent Developments
- 18.2.3.5. Financials (Based on Availability)
- 18.2.4 Chipbond Technology Corporation
- 18.2.4.1. Overview
- 18.2.4.2. Products
- 18.2.4.3. SWOT Analysis
- 18.2.4.4. Recent Developments
- 18.2.4.5. Financials (Based on Availability)
- 18.2.5 Advanced Semiconductor Engineering Inc
- 18.2.5.1. Overview
- 18.2.5.2. Products
- 18.2.5.3. SWOT Analysis
- 18.2.5.4. Recent Developments
- 18.2.5.5. Financials (Based on Availability)
- 18.2.6 Amkor Technology Inc
- 18.2.6.1. Overview
- 18.2.6.2. Products
- 18.2.6.3. SWOT Analysis
- 18.2.6.4. Recent Developments
- 18.2.6.5. Financials (Based on Availability)
- 18.2.7 Universal Instruments Corporation
- 18.2.7.1. Overview
- 18.2.7.2. Products
- 18.2.7.3. SWOT Analysis
- 18.2.7.4. Recent Developments
- 18.2.7.5. Financials (Based on Availability)
- 18.2.8 Taiwan Semiconductor Manufacturing Company Limited
- 18.2.8.1. Overview
- 18.2.8.2. Products
- 18.2.8.3. SWOT Analysis
- 18.2.8.4. Recent Developments
- 18.2.8.5. Financials (Based on Availability)
- 18.2.9 ChipMOS Technologies Inc
- 18.2.9.1. Overview
- 18.2.9.2. Products
- 18.2.9.3. SWOT Analysis
- 18.2.9.4. Recent Developments
- 18.2.9.5. Financials (Based on Availability)
- 18.2.10 Intel Corporation
- 18.2.10.1. Overview
- 18.2.10.2. Products
- 18.2.10.3. SWOT Analysis
- 18.2.10.4. Recent Developments
- 18.2.10.5. Financials (Based on Availability)
- 18.2.1 Samsung Electronics Co Ltd
List of Figures
- Figure 1: Global Advanced Packaging Market Revenue Breakdown (Million, %) by Region 2024 & 2032
- Figure 2: Global Advanced Packaging Market Volume Breakdown (K Unit, %) by Region 2024 & 2032
- Figure 3: North America Advanced Packaging Market Revenue (Million), by Country 2024 & 2032
- Figure 4: North America Advanced Packaging Market Volume (K Unit), by Country 2024 & 2032
- Figure 5: North America Advanced Packaging Market Revenue Share (%), by Country 2024 & 2032
- Figure 6: North America Advanced Packaging Market Volume Share (%), by Country 2024 & 2032
- Figure 7: Europe Advanced Packaging Market Revenue (Million), by Country 2024 & 2032
- Figure 8: Europe Advanced Packaging Market Volume (K Unit), by Country 2024 & 2032
- Figure 9: Europe Advanced Packaging Market Revenue Share (%), by Country 2024 & 2032
- Figure 10: Europe Advanced Packaging Market Volume Share (%), by Country 2024 & 2032
- Figure 11: Asia Pacific Advanced Packaging Market Revenue (Million), by Country 2024 & 2032
- Figure 12: Asia Pacific Advanced Packaging Market Volume (K Unit), by Country 2024 & 2032
- Figure 13: Asia Pacific Advanced Packaging Market Revenue Share (%), by Country 2024 & 2032
- Figure 14: Asia Pacific Advanced Packaging Market Volume Share (%), by Country 2024 & 2032
- Figure 15: South America Advanced Packaging Market Revenue (Million), by Country 2024 & 2032
- Figure 16: South America Advanced Packaging Market Volume (K Unit), by Country 2024 & 2032
- Figure 17: South America Advanced Packaging Market Revenue Share (%), by Country 2024 & 2032
- Figure 18: South America Advanced Packaging Market Volume Share (%), by Country 2024 & 2032
- Figure 19: North America Advanced Packaging Market Revenue (Million), by Country 2024 & 2032
- Figure 20: North America Advanced Packaging Market Volume (K Unit), by Country 2024 & 2032
- Figure 21: North America Advanced Packaging Market Revenue Share (%), by Country 2024 & 2032
- Figure 22: North America Advanced Packaging Market Volume Share (%), by Country 2024 & 2032
- Figure 23: MEA Advanced Packaging Market Revenue (Million), by Country 2024 & 2032
- Figure 24: MEA Advanced Packaging Market Volume (K Unit), by Country 2024 & 2032
- Figure 25: MEA Advanced Packaging Market Revenue Share (%), by Country 2024 & 2032
- Figure 26: MEA Advanced Packaging Market Volume Share (%), by Country 2024 & 2032
- Figure 27: North America Advanced Packaging Market Revenue (Million), by Packaging Platform 2024 & 2032
- Figure 28: North America Advanced Packaging Market Volume (K Unit), by Packaging Platform 2024 & 2032
- Figure 29: North America Advanced Packaging Market Revenue Share (%), by Packaging Platform 2024 & 2032
- Figure 30: North America Advanced Packaging Market Volume Share (%), by Packaging Platform 2024 & 2032
- Figure 31: North America Advanced Packaging Market Revenue (Million), by Application 2024 & 2032
- Figure 32: North America Advanced Packaging Market Volume (K Unit), by Application 2024 & 2032
- Figure 33: North America Advanced Packaging Market Revenue Share (%), by Application 2024 & 2032
- Figure 34: North America Advanced Packaging Market Volume Share (%), by Application 2024 & 2032
- Figure 35: North America Advanced Packaging Market Revenue (Million), by Region 2024 & 2032
- Figure 36: North America Advanced Packaging Market Volume (K Unit), by Region 2024 & 2032
- Figure 37: North America Advanced Packaging Market Revenue Share (%), by Region 2024 & 2032
- Figure 38: North America Advanced Packaging Market Volume Share (%), by Region 2024 & 2032
- Figure 39: North America Advanced Packaging Market Revenue (Million), by Country 2024 & 2032
- Figure 40: North America Advanced Packaging Market Volume (K Unit), by Country 2024 & 2032
- Figure 41: North America Advanced Packaging Market Revenue Share (%), by Country 2024 & 2032
- Figure 42: North America Advanced Packaging Market Volume Share (%), by Country 2024 & 2032
- Figure 43: Europe Advanced Packaging Market Revenue (Million), by Packaging Platform 2024 & 2032
- Figure 44: Europe Advanced Packaging Market Volume (K Unit), by Packaging Platform 2024 & 2032
- Figure 45: Europe Advanced Packaging Market Revenue Share (%), by Packaging Platform 2024 & 2032
- Figure 46: Europe Advanced Packaging Market Volume Share (%), by Packaging Platform 2024 & 2032
- Figure 47: Europe Advanced Packaging Market Revenue (Million), by Application 2024 & 2032
- Figure 48: Europe Advanced Packaging Market Volume (K Unit), by Application 2024 & 2032
- Figure 49: Europe Advanced Packaging Market Revenue Share (%), by Application 2024 & 2032
- Figure 50: Europe Advanced Packaging Market Volume Share (%), by Application 2024 & 2032
- Figure 51: Europe Advanced Packaging Market Revenue (Million), by Region 2024 & 2032
- Figure 52: Europe Advanced Packaging Market Volume (K Unit), by Region 2024 & 2032
- Figure 53: Europe Advanced Packaging Market Revenue Share (%), by Region 2024 & 2032
- Figure 54: Europe Advanced Packaging Market Volume Share (%), by Region 2024 & 2032
- Figure 55: Europe Advanced Packaging Market Revenue (Million), by Country 2024 & 2032
- Figure 56: Europe Advanced Packaging Market Volume (K Unit), by Country 2024 & 2032
- Figure 57: Europe Advanced Packaging Market Revenue Share (%), by Country 2024 & 2032
- Figure 58: Europe Advanced Packaging Market Volume Share (%), by Country 2024 & 2032
- Figure 59: Asia Advanced Packaging Market Revenue (Million), by Packaging Platform 2024 & 2032
- Figure 60: Asia Advanced Packaging Market Volume (K Unit), by Packaging Platform 2024 & 2032
- Figure 61: Asia Advanced Packaging Market Revenue Share (%), by Packaging Platform 2024 & 2032
- Figure 62: Asia Advanced Packaging Market Volume Share (%), by Packaging Platform 2024 & 2032
- Figure 63: Asia Advanced Packaging Market Revenue (Million), by Application 2024 & 2032
- Figure 64: Asia Advanced Packaging Market Volume (K Unit), by Application 2024 & 2032
- Figure 65: Asia Advanced Packaging Market Revenue Share (%), by Application 2024 & 2032
- Figure 66: Asia Advanced Packaging Market Volume Share (%), by Application 2024 & 2032
- Figure 67: Asia Advanced Packaging Market Revenue (Million), by Region 2024 & 2032
- Figure 68: Asia Advanced Packaging Market Volume (K Unit), by Region 2024 & 2032
- Figure 69: Asia Advanced Packaging Market Revenue Share (%), by Region 2024 & 2032
- Figure 70: Asia Advanced Packaging Market Volume Share (%), by Region 2024 & 2032
- Figure 71: Asia Advanced Packaging Market Revenue (Million), by Country 2024 & 2032
- Figure 72: Asia Advanced Packaging Market Volume (K Unit), by Country 2024 & 2032
- Figure 73: Asia Advanced Packaging Market Revenue Share (%), by Country 2024 & 2032
- Figure 74: Asia Advanced Packaging Market Volume Share (%), by Country 2024 & 2032
- Figure 75: Australia and New Zealand Advanced Packaging Market Revenue (Million), by Packaging Platform 2024 & 2032
- Figure 76: Australia and New Zealand Advanced Packaging Market Volume (K Unit), by Packaging Platform 2024 & 2032
- Figure 77: Australia and New Zealand Advanced Packaging Market Revenue Share (%), by Packaging Platform 2024 & 2032
- Figure 78: Australia and New Zealand Advanced Packaging Market Volume Share (%), by Packaging Platform 2024 & 2032
- Figure 79: Australia and New Zealand Advanced Packaging Market Revenue (Million), by Application 2024 & 2032
- Figure 80: Australia and New Zealand Advanced Packaging Market Volume (K Unit), by Application 2024 & 2032
- Figure 81: Australia and New Zealand Advanced Packaging Market Revenue Share (%), by Application 2024 & 2032
- Figure 82: Australia and New Zealand Advanced Packaging Market Volume Share (%), by Application 2024 & 2032
- Figure 83: Australia and New Zealand Advanced Packaging Market Revenue (Million), by Region 2024 & 2032
- Figure 84: Australia and New Zealand Advanced Packaging Market Volume (K Unit), by Region 2024 & 2032
- Figure 85: Australia and New Zealand Advanced Packaging Market Revenue Share (%), by Region 2024 & 2032
- Figure 86: Australia and New Zealand Advanced Packaging Market Volume Share (%), by Region 2024 & 2032
- Figure 87: Australia and New Zealand Advanced Packaging Market Revenue (Million), by Country 2024 & 2032
- Figure 88: Australia and New Zealand Advanced Packaging Market Volume (K Unit), by Country 2024 & 2032
- Figure 89: Australia and New Zealand Advanced Packaging Market Revenue Share (%), by Country 2024 & 2032
- Figure 90: Australia and New Zealand Advanced Packaging Market Volume Share (%), by Country 2024 & 2032
- Figure 91: Latin America Advanced Packaging Market Revenue (Million), by Packaging Platform 2024 & 2032
- Figure 92: Latin America Advanced Packaging Market Volume (K Unit), by Packaging Platform 2024 & 2032
- Figure 93: Latin America Advanced Packaging Market Revenue Share (%), by Packaging Platform 2024 & 2032
- Figure 94: Latin America Advanced Packaging Market Volume Share (%), by Packaging Platform 2024 & 2032
- Figure 95: Latin America Advanced Packaging Market Revenue (Million), by Application 2024 & 2032
- Figure 96: Latin America Advanced Packaging Market Volume (K Unit), by Application 2024 & 2032
- Figure 97: Latin America Advanced Packaging Market Revenue Share (%), by Application 2024 & 2032
- Figure 98: Latin America Advanced Packaging Market Volume Share (%), by Application 2024 & 2032
- Figure 99: Latin America Advanced Packaging Market Revenue (Million), by Region 2024 & 2032
- Figure 100: Latin America Advanced Packaging Market Volume (K Unit), by Region 2024 & 2032
- Figure 101: Latin America Advanced Packaging Market Revenue Share (%), by Region 2024 & 2032
- Figure 102: Latin America Advanced Packaging Market Volume Share (%), by Region 2024 & 2032
- Figure 103: Latin America Advanced Packaging Market Revenue (Million), by Country 2024 & 2032
- Figure 104: Latin America Advanced Packaging Market Volume (K Unit), by Country 2024 & 2032
- Figure 105: Latin America Advanced Packaging Market Revenue Share (%), by Country 2024 & 2032
- Figure 106: Latin America Advanced Packaging Market Volume Share (%), by Country 2024 & 2032
- Figure 107: Middle East and Africa Advanced Packaging Market Revenue (Million), by Packaging Platform 2024 & 2032
- Figure 108: Middle East and Africa Advanced Packaging Market Volume (K Unit), by Packaging Platform 2024 & 2032
- Figure 109: Middle East and Africa Advanced Packaging Market Revenue Share (%), by Packaging Platform 2024 & 2032
- Figure 110: Middle East and Africa Advanced Packaging Market Volume Share (%), by Packaging Platform 2024 & 2032
- Figure 111: Middle East and Africa Advanced Packaging Market Revenue (Million), by Application 2024 & 2032
- Figure 112: Middle East and Africa Advanced Packaging Market Volume (K Unit), by Application 2024 & 2032
- Figure 113: Middle East and Africa Advanced Packaging Market Revenue Share (%), by Application 2024 & 2032
- Figure 114: Middle East and Africa Advanced Packaging Market Volume Share (%), by Application 2024 & 2032
- Figure 115: Middle East and Africa Advanced Packaging Market Revenue (Million), by Region 2024 & 2032
- Figure 116: Middle East and Africa Advanced Packaging Market Volume (K Unit), by Region 2024 & 2032
- Figure 117: Middle East and Africa Advanced Packaging Market Revenue Share (%), by Region 2024 & 2032
- Figure 118: Middle East and Africa Advanced Packaging Market Volume Share (%), by Region 2024 & 2032
- Figure 119: Middle East and Africa Advanced Packaging Market Revenue (Million), by Country 2024 & 2032
- Figure 120: Middle East and Africa Advanced Packaging Market Volume (K Unit), by Country 2024 & 2032
- Figure 121: Middle East and Africa Advanced Packaging Market Revenue Share (%), by Country 2024 & 2032
- Figure 122: Middle East and Africa Advanced Packaging Market Volume Share (%), by Country 2024 & 2032
List of Tables
- Table 1: Global Advanced Packaging Market Revenue Million Forecast, by Region 2019 & 2032
- Table 2: Global Advanced Packaging Market Volume K Unit Forecast, by Region 2019 & 2032
- Table 3: Global Advanced Packaging Market Revenue Million Forecast, by Packaging Platform 2019 & 2032
- Table 4: Global Advanced Packaging Market Volume K Unit Forecast, by Packaging Platform 2019 & 2032
- Table 5: Global Advanced Packaging Market Revenue Million Forecast, by Application 2019 & 2032
- Table 6: Global Advanced Packaging Market Volume K Unit Forecast, by Application 2019 & 2032
- Table 7: Global Advanced Packaging Market Revenue Million Forecast, by Region 2019 & 2032
- Table 8: Global Advanced Packaging Market Volume K Unit Forecast, by Region 2019 & 2032
- Table 9: Global Advanced Packaging Market Revenue Million Forecast, by Region 2019 & 2032
- Table 10: Global Advanced Packaging Market Volume K Unit Forecast, by Region 2019 & 2032
- Table 11: Global Advanced Packaging Market Revenue Million Forecast, by Country 2019 & 2032
- Table 12: Global Advanced Packaging Market Volume K Unit Forecast, by Country 2019 & 2032
- Table 13: United States Advanced Packaging Market Revenue (Million) Forecast, by Application 2019 & 2032
- Table 14: United States Advanced Packaging Market Volume (K Unit) Forecast, by Application 2019 & 2032
- Table 15: Canada Advanced Packaging Market Revenue (Million) Forecast, by Application 2019 & 2032
- Table 16: Canada Advanced Packaging Market Volume (K Unit) Forecast, by Application 2019 & 2032
- Table 17: Mexico Advanced Packaging Market Revenue (Million) Forecast, by Application 2019 & 2032
- Table 18: Mexico Advanced Packaging Market Volume (K Unit) Forecast, by Application 2019 & 2032
- Table 19: Global Advanced Packaging Market Revenue Million Forecast, by Country 2019 & 2032
- Table 20: Global Advanced Packaging Market Volume K Unit Forecast, by Country 2019 & 2032
- Table 21: Germany Advanced Packaging Market Revenue (Million) Forecast, by Application 2019 & 2032
- Table 22: Germany Advanced Packaging Market Volume (K Unit) Forecast, by Application 2019 & 2032
- Table 23: United Kingdom Advanced Packaging Market Revenue (Million) Forecast, by Application 2019 & 2032
- Table 24: United Kingdom Advanced Packaging Market Volume (K Unit) Forecast, by Application 2019 & 2032
- Table 25: France Advanced Packaging Market Revenue (Million) Forecast, by Application 2019 & 2032
- Table 26: France Advanced Packaging Market Volume (K Unit) Forecast, by Application 2019 & 2032
- Table 27: Spain Advanced Packaging Market Revenue (Million) Forecast, by Application 2019 & 2032
- Table 28: Spain Advanced Packaging Market Volume (K Unit) Forecast, by Application 2019 & 2032
- Table 29: Italy Advanced Packaging Market Revenue (Million) Forecast, by Application 2019 & 2032
- Table 30: Italy Advanced Packaging Market Volume (K Unit) Forecast, by Application 2019 & 2032
- Table 31: Spain Advanced Packaging Market Revenue (Million) Forecast, by Application 2019 & 2032
- Table 32: Spain Advanced Packaging Market Volume (K Unit) Forecast, by Application 2019 & 2032
- Table 33: Belgium Advanced Packaging Market Revenue (Million) Forecast, by Application 2019 & 2032
- Table 34: Belgium Advanced Packaging Market Volume (K Unit) Forecast, by Application 2019 & 2032
- Table 35: Netherland Advanced Packaging Market Revenue (Million) Forecast, by Application 2019 & 2032
- Table 36: Netherland Advanced Packaging Market Volume (K Unit) Forecast, by Application 2019 & 2032
- Table 37: Nordics Advanced Packaging Market Revenue (Million) Forecast, by Application 2019 & 2032
- Table 38: Nordics Advanced Packaging Market Volume (K Unit) Forecast, by Application 2019 & 2032
- Table 39: Rest of Europe Advanced Packaging Market Revenue (Million) Forecast, by Application 2019 & 2032
- Table 40: Rest of Europe Advanced Packaging Market Volume (K Unit) Forecast, by Application 2019 & 2032
- Table 41: Global Advanced Packaging Market Revenue Million Forecast, by Country 2019 & 2032
- Table 42: Global Advanced Packaging Market Volume K Unit Forecast, by Country 2019 & 2032
- Table 43: China Advanced Packaging Market Revenue (Million) Forecast, by Application 2019 & 2032
- Table 44: China Advanced Packaging Market Volume (K Unit) Forecast, by Application 2019 & 2032
- Table 45: Japan Advanced Packaging Market Revenue (Million) Forecast, by Application 2019 & 2032
- Table 46: Japan Advanced Packaging Market Volume (K Unit) Forecast, by Application 2019 & 2032
- Table 47: India Advanced Packaging Market Revenue (Million) Forecast, by Application 2019 & 2032
- Table 48: India Advanced Packaging Market Volume (K Unit) Forecast, by Application 2019 & 2032
- Table 49: South Korea Advanced Packaging Market Revenue (Million) Forecast, by Application 2019 & 2032
- Table 50: South Korea Advanced Packaging Market Volume (K Unit) Forecast, by Application 2019 & 2032
- Table 51: Southeast Asia Advanced Packaging Market Revenue (Million) Forecast, by Application 2019 & 2032
- Table 52: Southeast Asia Advanced Packaging Market Volume (K Unit) Forecast, by Application 2019 & 2032
- Table 53: Australia Advanced Packaging Market Revenue (Million) Forecast, by Application 2019 & 2032
- Table 54: Australia Advanced Packaging Market Volume (K Unit) Forecast, by Application 2019 & 2032
- Table 55: Indonesia Advanced Packaging Market Revenue (Million) Forecast, by Application 2019 & 2032
- Table 56: Indonesia Advanced Packaging Market Volume (K Unit) Forecast, by Application 2019 & 2032
- Table 57: Phillipes Advanced Packaging Market Revenue (Million) Forecast, by Application 2019 & 2032
- Table 58: Phillipes Advanced Packaging Market Volume (K Unit) Forecast, by Application 2019 & 2032
- Table 59: Singapore Advanced Packaging Market Revenue (Million) Forecast, by Application 2019 & 2032
- Table 60: Singapore Advanced Packaging Market Volume (K Unit) Forecast, by Application 2019 & 2032
- Table 61: Thailandc Advanced Packaging Market Revenue (Million) Forecast, by Application 2019 & 2032
- Table 62: Thailandc Advanced Packaging Market Volume (K Unit) Forecast, by Application 2019 & 2032
- Table 63: Rest of Asia Pacific Advanced Packaging Market Revenue (Million) Forecast, by Application 2019 & 2032
- Table 64: Rest of Asia Pacific Advanced Packaging Market Volume (K Unit) Forecast, by Application 2019 & 2032
- Table 65: Global Advanced Packaging Market Revenue Million Forecast, by Country 2019 & 2032
- Table 66: Global Advanced Packaging Market Volume K Unit Forecast, by Country 2019 & 2032
- Table 67: Brazil Advanced Packaging Market Revenue (Million) Forecast, by Application 2019 & 2032
- Table 68: Brazil Advanced Packaging Market Volume (K Unit) Forecast, by Application 2019 & 2032
- Table 69: Argentina Advanced Packaging Market Revenue (Million) Forecast, by Application 2019 & 2032
- Table 70: Argentina Advanced Packaging Market Volume (K Unit) Forecast, by Application 2019 & 2032
- Table 71: Peru Advanced Packaging Market Revenue (Million) Forecast, by Application 2019 & 2032
- Table 72: Peru Advanced Packaging Market Volume (K Unit) Forecast, by Application 2019 & 2032
- Table 73: Chile Advanced Packaging Market Revenue (Million) Forecast, by Application 2019 & 2032
- Table 74: Chile Advanced Packaging Market Volume (K Unit) Forecast, by Application 2019 & 2032
- Table 75: Colombia Advanced Packaging Market Revenue (Million) Forecast, by Application 2019 & 2032
- Table 76: Colombia Advanced Packaging Market Volume (K Unit) Forecast, by Application 2019 & 2032
- Table 77: Ecuador Advanced Packaging Market Revenue (Million) Forecast, by Application 2019 & 2032
- Table 78: Ecuador Advanced Packaging Market Volume (K Unit) Forecast, by Application 2019 & 2032
- Table 79: Venezuela Advanced Packaging Market Revenue (Million) Forecast, by Application 2019 & 2032
- Table 80: Venezuela Advanced Packaging Market Volume (K Unit) Forecast, by Application 2019 & 2032
- Table 81: Rest of South America Advanced Packaging Market Revenue (Million) Forecast, by Application 2019 & 2032
- Table 82: Rest of South America Advanced Packaging Market Volume (K Unit) Forecast, by Application 2019 & 2032
- Table 83: Global Advanced Packaging Market Revenue Million Forecast, by Country 2019 & 2032
- Table 84: Global Advanced Packaging Market Volume K Unit Forecast, by Country 2019 & 2032
- Table 85: United States Advanced Packaging Market Revenue (Million) Forecast, by Application 2019 & 2032
- Table 86: United States Advanced Packaging Market Volume (K Unit) Forecast, by Application 2019 & 2032
- Table 87: Canada Advanced Packaging Market Revenue (Million) Forecast, by Application 2019 & 2032
- Table 88: Canada Advanced Packaging Market Volume (K Unit) Forecast, by Application 2019 & 2032
- Table 89: Mexico Advanced Packaging Market Revenue (Million) Forecast, by Application 2019 & 2032
- Table 90: Mexico Advanced Packaging Market Volume (K Unit) Forecast, by Application 2019 & 2032
- Table 91: Global Advanced Packaging Market Revenue Million Forecast, by Country 2019 & 2032
- Table 92: Global Advanced Packaging Market Volume K Unit Forecast, by Country 2019 & 2032
- Table 93: United Arab Emirates Advanced Packaging Market Revenue (Million) Forecast, by Application 2019 & 2032
- Table 94: United Arab Emirates Advanced Packaging Market Volume (K Unit) Forecast, by Application 2019 & 2032
- Table 95: Saudi Arabia Advanced Packaging Market Revenue (Million) Forecast, by Application 2019 & 2032
- Table 96: Saudi Arabia Advanced Packaging Market Volume (K Unit) Forecast, by Application 2019 & 2032
- Table 97: South Africa Advanced Packaging Market Revenue (Million) Forecast, by Application 2019 & 2032
- Table 98: South Africa Advanced Packaging Market Volume (K Unit) Forecast, by Application 2019 & 2032
- Table 99: Rest of Middle East and Africa Advanced Packaging Market Revenue (Million) Forecast, by Application 2019 & 2032
- Table 100: Rest of Middle East and Africa Advanced Packaging Market Volume (K Unit) Forecast, by Application 2019 & 2032
- Table 101: Global Advanced Packaging Market Revenue Million Forecast, by Packaging Platform 2019 & 2032
- Table 102: Global Advanced Packaging Market Volume K Unit Forecast, by Packaging Platform 2019 & 2032
- Table 103: Global Advanced Packaging Market Revenue Million Forecast, by Application 2019 & 2032
- Table 104: Global Advanced Packaging Market Volume K Unit Forecast, by Application 2019 & 2032
- Table 105: Global Advanced Packaging Market Revenue Million Forecast, by Region 2019 & 2032
- Table 106: Global Advanced Packaging Market Volume K Unit Forecast, by Region 2019 & 2032
- Table 107: Global Advanced Packaging Market Revenue Million Forecast, by Country 2019 & 2032
- Table 108: Global Advanced Packaging Market Volume K Unit Forecast, by Country 2019 & 2032
- Table 109: Global Advanced Packaging Market Revenue Million Forecast, by Packaging Platform 2019 & 2032
- Table 110: Global Advanced Packaging Market Volume K Unit Forecast, by Packaging Platform 2019 & 2032
- Table 111: Global Advanced Packaging Market Revenue Million Forecast, by Application 2019 & 2032
- Table 112: Global Advanced Packaging Market Volume K Unit Forecast, by Application 2019 & 2032
- Table 113: Global Advanced Packaging Market Revenue Million Forecast, by Region 2019 & 2032
- Table 114: Global Advanced Packaging Market Volume K Unit Forecast, by Region 2019 & 2032
- Table 115: Global Advanced Packaging Market Revenue Million Forecast, by Country 2019 & 2032
- Table 116: Global Advanced Packaging Market Volume K Unit Forecast, by Country 2019 & 2032
- Table 117: Global Advanced Packaging Market Revenue Million Forecast, by Packaging Platform 2019 & 2032
- Table 118: Global Advanced Packaging Market Volume K Unit Forecast, by Packaging Platform 2019 & 2032
- Table 119: Global Advanced Packaging Market Revenue Million Forecast, by Application 2019 & 2032
- Table 120: Global Advanced Packaging Market Volume K Unit Forecast, by Application 2019 & 2032
- Table 121: Global Advanced Packaging Market Revenue Million Forecast, by Region 2019 & 2032
- Table 122: Global Advanced Packaging Market Volume K Unit Forecast, by Region 2019 & 2032
- Table 123: Global Advanced Packaging Market Revenue Million Forecast, by Country 2019 & 2032
- Table 124: Global Advanced Packaging Market Volume K Unit Forecast, by Country 2019 & 2032
- Table 125: Global Advanced Packaging Market Revenue Million Forecast, by Packaging Platform 2019 & 2032
- Table 126: Global Advanced Packaging Market Volume K Unit Forecast, by Packaging Platform 2019 & 2032
- Table 127: Global Advanced Packaging Market Revenue Million Forecast, by Application 2019 & 2032
- Table 128: Global Advanced Packaging Market Volume K Unit Forecast, by Application 2019 & 2032
- Table 129: Global Advanced Packaging Market Revenue Million Forecast, by Region 2019 & 2032
- Table 130: Global Advanced Packaging Market Volume K Unit Forecast, by Region 2019 & 2032
- Table 131: Global Advanced Packaging Market Revenue Million Forecast, by Country 2019 & 2032
- Table 132: Global Advanced Packaging Market Volume K Unit Forecast, by Country 2019 & 2032
- Table 133: Global Advanced Packaging Market Revenue Million Forecast, by Packaging Platform 2019 & 2032
- Table 134: Global Advanced Packaging Market Volume K Unit Forecast, by Packaging Platform 2019 & 2032
- Table 135: Global Advanced Packaging Market Revenue Million Forecast, by Application 2019 & 2032
- Table 136: Global Advanced Packaging Market Volume K Unit Forecast, by Application 2019 & 2032
- Table 137: Global Advanced Packaging Market Revenue Million Forecast, by Region 2019 & 2032
- Table 138: Global Advanced Packaging Market Volume K Unit Forecast, by Region 2019 & 2032
- Table 139: Global Advanced Packaging Market Revenue Million Forecast, by Country 2019 & 2032
- Table 140: Global Advanced Packaging Market Volume K Unit Forecast, by Country 2019 & 2032
- Table 141: Global Advanced Packaging Market Revenue Million Forecast, by Packaging Platform 2019 & 2032
- Table 142: Global Advanced Packaging Market Volume K Unit Forecast, by Packaging Platform 2019 & 2032
- Table 143: Global Advanced Packaging Market Revenue Million Forecast, by Application 2019 & 2032
- Table 144: Global Advanced Packaging Market Volume K Unit Forecast, by Application 2019 & 2032
- Table 145: Global Advanced Packaging Market Revenue Million Forecast, by Region 2019 & 2032
- Table 146: Global Advanced Packaging Market Volume K Unit Forecast, by Region 2019 & 2032
- Table 147: Global Advanced Packaging Market Revenue Million Forecast, by Country 2019 & 2032
- Table 148: Global Advanced Packaging Market Volume K Unit Forecast, by Country 2019 & 2032
Frequently Asked Questions
1. What is the projected Compound Annual Growth Rate (CAGR) of the Advanced Packaging Market?
The projected CAGR is approximately 6.63%.
2. Which companies are prominent players in the Advanced Packaging Market?
Key companies in the market include Samsung Electronics Co Ltd, Brewer Science Inc , JCET Group Co Ltd, Chipbond Technology Corporation, Advanced Semiconductor Engineering Inc, Amkor Technology Inc, Universal Instruments Corporation, Taiwan Semiconductor Manufacturing Company Limited, ChipMOS Technologies Inc, Intel Corporation.
3. What are the main segments of the Advanced Packaging Market?
The market segments include Packaging Platform, Application , Region.
4. Can you provide details about the market size?
The market size is estimated to be USD 32.64 Million as of 2022.
5. What are some drivers contributing to market growth?
Increasing Trend of Advanced Architecture in Electronic Products; Favorable Government Policies and Regulations in Developing Countries.
6. What are the notable trends driving market growth?
Embedded Die to Witness Significant Growth Rate.
7. Are there any restraints impacting market growth?
Market Consolidation affecting Overall Profitability.
8. Can you provide examples of recent developments in the market?
October 2023 - Advanced Semiconductor Engineering Inc. (ASE) announced the launch of its Integrated Design Ecosystem (IDE), a collaborative design toolset optimized to boost advanced package architecture across its VIPack platform systematically. This innovative approach allows a seamless transition from single-die SoC to multi-die disaggregated IP blocks, including chiplets and memory for integration using 2.5D or advanced fanout structures.
9. What pricing options are available for accessing the report?
Pricing options include single-user, multi-user, and enterprise licenses priced at USD 4750, USD 5250, and USD 8750 respectively.
10. Is the market size provided in terms of value or volume?
The market size is provided in terms of value, measured in Million and volume, measured in K Unit.
11. Are there any specific market keywords associated with the report?
Yes, the market keyword associated with the report is "Advanced Packaging Market," which aids in identifying and referencing the specific market segment covered.
12. How do I determine which pricing option suits my needs best?
The pricing options vary based on user requirements and access needs. Individual users may opt for single-user licenses, while businesses requiring broader access may choose multi-user or enterprise licenses for cost-effective access to the report.
13. Are there any additional resources or data provided in the Advanced Packaging Market report?
While the report offers comprehensive insights, it's advisable to review the specific contents or supplementary materials provided to ascertain if additional resources or data are available.
14. How can I stay updated on further developments or reports in the Advanced Packaging Market?
To stay informed about further developments, trends, and reports in the Advanced Packaging Market, consider subscribing to industry newsletters, following relevant companies and organizations, or regularly checking reputable industry news sources and publications.
Methodology
Step 1 - Identification of Relevant Samples Size from Population Database


Step 2 - Approaches for Defining Global Market Size (Value, Volume* & Price*)

Note*: In applicable scenarios
Step 3 - Data Sources
Primary Research
- Web Analytics
- Survey Reports
- Research Institute
- Latest Research Reports
- Opinion Leaders
Secondary Research
- Annual Reports
- White Paper
- Latest Press Release
- Industry Association
- Paid Database
- Investor Presentations

Step 4 - Data Triangulation
Involves using different sources of information in order to increase the validity of a study
These sources are likely to be stakeholders in a program - participants, other researchers, program staff, other community members, and so on.
Then we put all data in single framework & apply various statistical tools to find out the dynamic on the market.
During the analysis stage, feedback from the stakeholder groups would be compared to determine areas of agreement as well as areas of divergence


