Acaricides Industry Unlocking Growth Potential: Analysis and Forecasts 2025-2033

Acaricides Industry by Production Analysis, by Consumption Analysis, by Import Market Analysis (Value & Volume), by Export Market Analysis (Value & Volume), by Price Trend Analysis, by North America (United States, Canada, Mexico), by South America (Brazil, Argentina, Rest of South America), by Europe (United Kingdom, Germany, France, Italy, Spain, Russia, Benelux, Nordics, Rest of Europe), by Middle East & Africa (Turkey, Israel, GCC, North Africa, South Africa, Rest of Middle East & Africa), by Asia Pacific (China, India, Japan, South Korea, ASEAN, Oceania, Rest of Asia Pacific) Forecast 2025-2033

Jun 28 2025
Base Year: 2024

234 Pages
Main Logo

Acaricides Industry Unlocking Growth Potential: Analysis and Forecasts 2025-2033


Home
Industries
Agriculture
sponsor image

Tailored for you

  • In-depth Analysis Tailored to Specified Regions or Segments
  • Company Profiles Customized to User Preferences
  • Comprehensive Insights Focused on Specific Segments or Regions
  • Customized Evaluation of Competitive Landscape to Meet Your Needs
  • Tailored Customization to Address Other Specific Requirements
Ask for customization


Key Insights

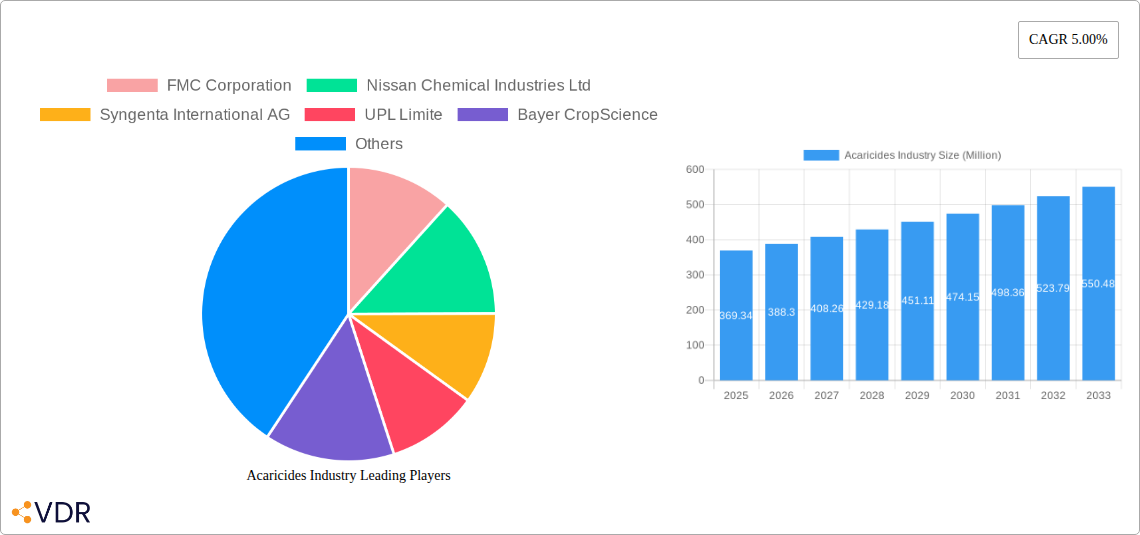
The global acaricide market, valued at $369.34 million in 2025, is projected to experience robust growth, exhibiting a compound annual growth rate (CAGR) of 5.00% from 2025 to 2033. This expansion is driven by several key factors. The increasing prevalence of acaricide-resistant mites and ticks necessitates the development and adoption of novel and effective acaricides, fueling market demand. Furthermore, the growing awareness of vector-borne diseases transmitted by mites and ticks, coupled with intensified agricultural practices requiring robust pest control solutions, are significant contributors to market growth. The expanding global population and increasing demand for food security also play a crucial role, as acaricide usage is essential in protecting crops and livestock. Significant market segments include organophosphates and pyrethroids due to their established efficacy and widespread availability. Spray application remains the dominant method, reflecting established agricultural practices. However, the market also sees growth in other application methods like dipping and hand dressing, driven by specialized needs in different sectors. Major players like FMC Corporation, Syngenta, and Bayer are actively investing in research and development, introducing innovative acaricide formulations to enhance efficacy and address environmental concerns. Regional market share is likely to be dominated by North America and Europe initially, given their established agricultural sectors and stringent regulations, but the Asia-Pacific region is poised for significant growth fueled by its expanding agricultural industry and rising population.

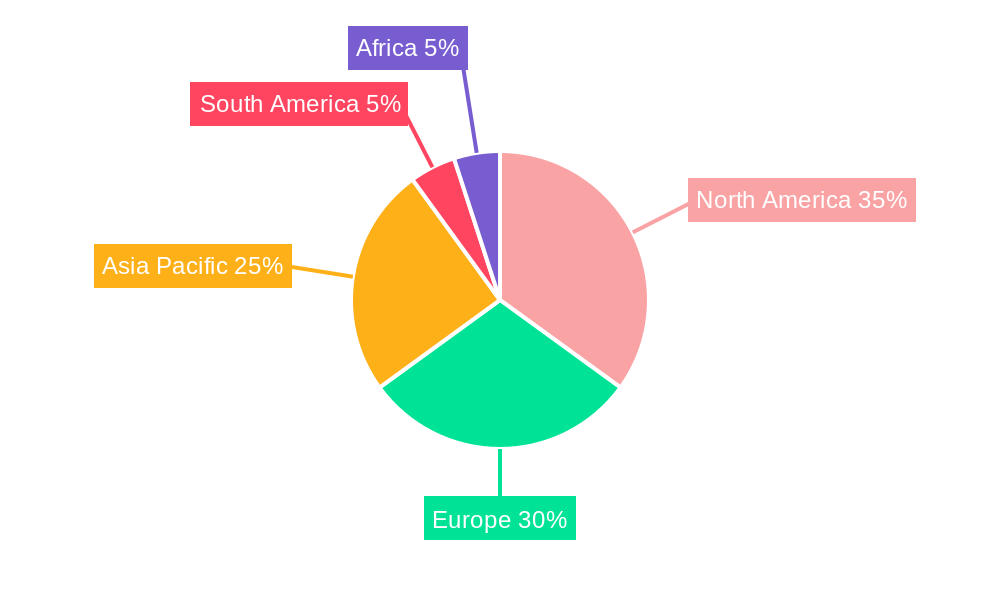
Geographic distribution demonstrates varied market penetration. North America and Europe hold substantial market shares due to established agricultural practices and regulatory frameworks. However, the Asia-Pacific region presents a significant growth opportunity, given its rapidly expanding agricultural sector and increasing awareness of acaricide applications in public health. South America and Africa also represent considerable, albeit presently smaller, market segments with growth potential driven by increasing agricultural activity and improved pest management strategies. Challenges remain, including concerns about environmental impact and the emergence of acaricide resistance. Companies are actively addressing these concerns through the development of bio-pesticides and integrated pest management strategies, creating further diversification within the market. The long-term outlook for the acaricide market remains positive, with continuous innovation and expansion expected across key segments and geographical regions.

Acaricides Industry Research Report - Market Size, Growth & Forecast

Acaricides Industry Market Report: 2019-2033

This comprehensive report provides a detailed analysis of the Acaricides industry, encompassing market dynamics, growth trends, regional performance, product landscapes, and key players. With a study period spanning 2019-2033, a base year of 2025, and a forecast period of 2025-2033, this report offers invaluable insights for industry professionals, investors, and stakeholders seeking to understand and capitalize on the evolving Acaricides market. The market size is predicted to reach xx Million units by 2033.

Acaricides Industry Market Dynamics & Structure

The Acaricides market is characterized by moderate concentration, with key players such as FMC Corporation, Nissan Chemical Industries Ltd, Syngenta International AG, UPL Limited, Bayer CropScience, Corteva Agriscience, and BASF SE holding significant market shares. Technological innovation, driven by the need for more effective and environmentally friendly acaricides, is a key driver. Stringent regulatory frameworks and growing awareness of pesticide residues influence product development and market access. The market also faces competition from biological control methods and integrated pest management strategies. M&A activity has been relatively low in recent years (approximately xx deals between 2019-2024), indicating a trend towards organic growth.

  • Market Concentration: Moderately concentrated, with top 7 players holding approximately xx% market share in 2024.
  • Technological Innovation: Focus on developing low-toxicity, high-efficacy acaricides with improved environmental profiles.
  • Regulatory Framework: Stringent regulations regarding pesticide registration and usage are shaping market dynamics.
  • Competitive Substitutes: Biological control methods and integrated pest management strategies pose a competitive threat.
  • End-User Demographics: Primarily agricultural producers (large-scale farms, smallholder farmers), with varying adoption rates based on geographic location and crop type.
  • M&A Trends: Relatively low M&A activity in recent years (xx deals between 2019-2024), with a focus on strategic partnerships and joint ventures instead.

Acaricides Industry Growth Trends & Insights

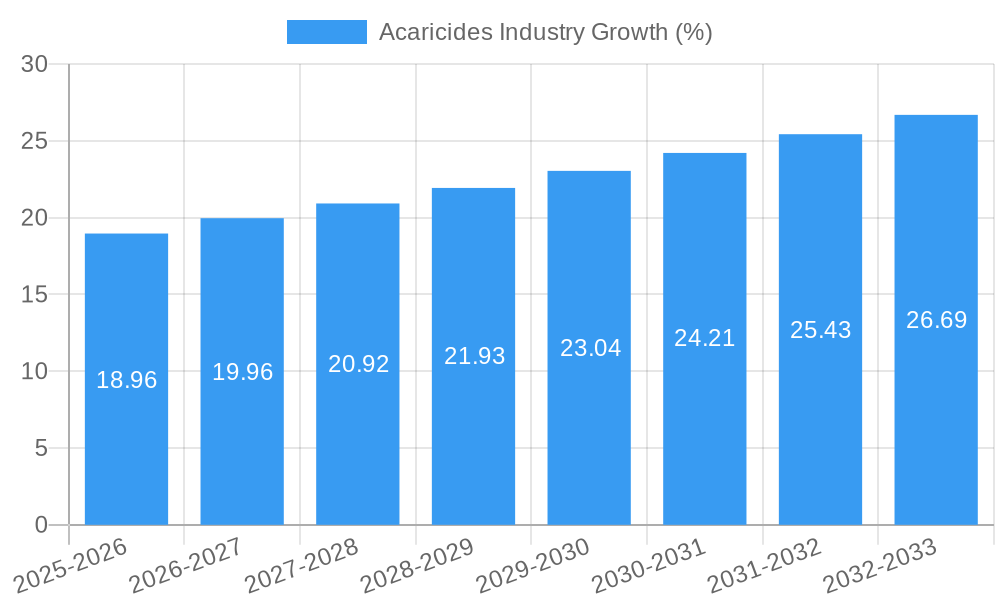
The Acaricides market witnessed a CAGR of xx% during the historical period (2019-2024), driven by factors such as increasing crop production, growing pest resistance, and the adoption of advanced application techniques. The market is expected to maintain a steady growth trajectory during the forecast period (2025-2033), albeit at a slightly moderated pace due to factors like stringent regulations and the emergence of bio-pesticides. Market penetration is high in developed regions, while significant growth potential exists in developing countries. Technological advancements, such as the development of novel formulations and targeted delivery systems, are influencing consumer adoption rates. Changes in consumer preferences, such as increasing demand for organically produced crops, are also shaping market trends. The estimated market size in 2025 is xx Million units.

Acaricides Industry Growth

Dominant Regions, Countries, or Segments in Acaricides Industry

The North American and European regions currently dominate the Acaricides market, driven by high agricultural output and advanced pest management practices. However, rapid growth is anticipated in Asia-Pacific and Latin America due to expanding agricultural activities and increasing pest pressure. Within chemical types, Pyrethroids holds the largest market share due to its effectiveness and broad application. Spray application remains the dominant method, although the adoption of other techniques like dipping and hand dressing is increasing.

  • Leading Regions: North America and Europe (holding approximately xx% market share combined in 2024)
  • High-Growth Regions: Asia-Pacific and Latin America (projected CAGR of xx% during 2025-2033)
  • Dominant Chemical Type: Pyrethroids (approximately xx% market share in 2024)
  • Dominant Application Method: Spray application (approximately xx% market share in 2024)
  • Key Drivers: Increasing crop production, growing pest resistance, expanding agricultural land, government support for agriculture.

Acaricides Industry Product Landscape

The Acaricides market offers a diverse range of products, categorized by chemical type, formulation, and application method. Recent innovations focus on improving efficacy, reducing environmental impact, and enhancing user safety. The development of systemic acaricides with prolonged residual activity and novel formulations that improve spray coverage and reduce drift are notable advancements. Products with improved safety profiles and enhanced compatibility with other crop protection products are gaining traction.

Key Drivers, Barriers & Challenges in Acaricides Industry

Key Drivers: Growing global food demand, increasing pest pressure due to climate change, rising adoption of intensive farming practices, technological advancements in acaricide formulation.

Challenges & Restraints: Stringent regulatory frameworks, concerns about pesticide residues and environmental impact, development of pest resistance, increasing costs of raw materials, competition from bio-pesticides (estimated to impact the market by xx Million units by 2033).

Emerging Opportunities in Acaricides Industry

Untapped market potential exists in developing countries with expanding agricultural sectors. Opportunities also lie in developing novel acaricides with improved efficacy and reduced environmental impact. The use of targeted delivery systems, such as microencapsulation and nano-formulations, offers promising opportunities for enhancing product performance and reducing pesticide usage. Increased adoption of integrated pest management strategies presents a collaborative opportunity.

Growth Accelerators in the Acaricides Industry

Technological advancements, such as the development of novel chemical structures and targeted delivery systems, are driving long-term growth. Strategic partnerships between acaricide manufacturers and agricultural input suppliers are facilitating market expansion. Investment in research and development, coupled with sustainable manufacturing practices, is contributing to market growth.

Key Players Shaping the Acaricides Industry Market

  • FMC Corporation
  • Nissan Chemical Industries Ltd
  • Syngenta International AG
  • UPL Limited
  • Bayer CropScience
  • Corteva Agriscience
  • BASF SE

Notable Milestones in Acaricides Industry Sector

  • 2021: Launch of a new pyrethroid-based acaricide with enhanced efficacy and reduced environmental impact by FMC Corporation.
  • 2022: Syngenta International AG acquired a smaller acaricide manufacturer, expanding its product portfolio.
  • 2023: New regulations regarding acaricide usage implemented in the European Union.

In-Depth Acaricides Industry Market Outlook

The Acaricides market is poised for continued growth, driven by factors such as rising global food demand, increasing pest pressure, and technological advancements. Strategic investments in research and development, coupled with sustainable manufacturing practices, will be crucial for long-term success. Companies focusing on innovative product development, targeted market expansion, and strategic partnerships are best positioned to capitalize on emerging opportunities.

Acaricides Industry Segmentation

  • 1. Production Analysis
  • 2. Consumption Analysis
  • 3. Import Market Analysis (Value & Volume)
  • 4. Export Market Analysis (Value & Volume)
  • 5. Price Trend Analysis

Acaricides Industry Segmentation By Geography

  • 1. North America
    • 1.1. United States
    • 1.2. Canada
    • 1.3. Mexico
  • 2. South America
    • 2.1. Brazil
    • 2.2. Argentina
    • 2.3. Rest of South America
  • 3. Europe
    • 3.1. United Kingdom
    • 3.2. Germany
    • 3.3. France
    • 3.4. Italy
    • 3.5. Spain
    • 3.6. Russia
    • 3.7. Benelux
    • 3.8. Nordics
    • 3.9. Rest of Europe
  • 4. Middle East & Africa
    • 4.1. Turkey
    • 4.2. Israel
    • 4.3. GCC
    • 4.4. North Africa
    • 4.5. South Africa
    • 4.6. Rest of Middle East & Africa
  • 5. Asia Pacific
    • 5.1. China
    • 5.2. India
    • 5.3. Japan
    • 5.4. South Korea
    • 5.5. ASEAN
    • 5.6. Oceania
    • 5.7. Rest of Asia Pacific
Acaricides Industry Regional Share


Acaricides Industry REPORT HIGHLIGHTS

AspectsDetails
Study Period 2019-2033
Base Year 2024
Estimated Year 2025
Forecast Period2025-2033
Historical Period2019-2024
Growth RateCAGR of 5.00% from 2019-2033
Segmentation
    • By Production Analysis
    • By Consumption Analysis
    • By Import Market Analysis (Value & Volume)
    • By Export Market Analysis (Value & Volume)
    • By Price Trend Analysis
  • By Geography
    • North America
      • United States
      • Canada
      • Mexico
    • South America
      • Brazil
      • Argentina
      • Rest of South America
    • Europe
      • United Kingdom
      • Germany
      • France
      • Italy
      • Spain
      • Russia
      • Benelux
      • Nordics
      • Rest of Europe
    • Middle East & Africa
      • Turkey
      • Israel
      • GCC
      • North Africa
      • South Africa
      • Rest of Middle East & Africa
    • Asia Pacific
      • China
      • India
      • Japan
      • South Korea
      • ASEAN
      • Oceania
      • Rest of Asia Pacific


Table of Contents

  1. 1. Introduction
    • 1.1. Research Scope
    • 1.2. Market Segmentation
    • 1.3. Research Methodology
    • 1.4. Definitions and Assumptions
  2. 2. Executive Summary
    • 2.1. Introduction
  3. 3. Market Dynamics
    • 3.1. Introduction
      • 3.2. Market Drivers
        • 3.2.1. Shortage of Skilled Labor; Government Support to Enhance Farm Mechanization
      • 3.3. Market Restrains
        • 3.3.1. Heavy Initial Procurement Cost and High Expenditure on Maintenance
      • 3.4. Market Trends
        • 3.4.1. Increasing Demand for Natural Products
  4. 4. Market Factor Analysis
    • 4.1. Porters Five Forces
    • 4.2. Supply/Value Chain
    • 4.3. PESTEL analysis
    • 4.4. Market Entropy
    • 4.5. Patent/Trademark Analysis
  5. 5. Global Acaricides Industry Analysis, Insights and Forecast, 2019-2031
    • 5.1. Market Analysis, Insights and Forecast - by Production Analysis
      • 5.2. Market Analysis, Insights and Forecast - by Consumption Analysis
        • 5.3. Market Analysis, Insights and Forecast - by Import Market Analysis (Value & Volume)
          • 5.4. Market Analysis, Insights and Forecast - by Export Market Analysis (Value & Volume)
            • 5.5. Market Analysis, Insights and Forecast - by Price Trend Analysis
              • 5.6. Market Analysis, Insights and Forecast - by Region
                • 5.6.1. North America
                • 5.6.2. South America
                • 5.6.3. Europe
                • 5.6.4. Middle East & Africa
                • 5.6.5. Asia Pacific
            • 6. North America Acaricides Industry Analysis, Insights and Forecast, 2019-2031
              • 6.1. Market Analysis, Insights and Forecast - by Production Analysis
                • 6.2. Market Analysis, Insights and Forecast - by Consumption Analysis
                  • 6.3. Market Analysis, Insights and Forecast - by Import Market Analysis (Value & Volume)
                    • 6.4. Market Analysis, Insights and Forecast - by Export Market Analysis (Value & Volume)
                      • 6.5. Market Analysis, Insights and Forecast - by Price Trend Analysis
                      • 7. South America Acaricides Industry Analysis, Insights and Forecast, 2019-2031
                        • 7.1. Market Analysis, Insights and Forecast - by Production Analysis
                          • 7.2. Market Analysis, Insights and Forecast - by Consumption Analysis
                            • 7.3. Market Analysis, Insights and Forecast - by Import Market Analysis (Value & Volume)
                              • 7.4. Market Analysis, Insights and Forecast - by Export Market Analysis (Value & Volume)
                                • 7.5. Market Analysis, Insights and Forecast - by Price Trend Analysis
                                • 8. Europe Acaricides Industry Analysis, Insights and Forecast, 2019-2031
                                  • 8.1. Market Analysis, Insights and Forecast - by Production Analysis
                                    • 8.2. Market Analysis, Insights and Forecast - by Consumption Analysis
                                      • 8.3. Market Analysis, Insights and Forecast - by Import Market Analysis (Value & Volume)
                                        • 8.4. Market Analysis, Insights and Forecast - by Export Market Analysis (Value & Volume)
                                          • 8.5. Market Analysis, Insights and Forecast - by Price Trend Analysis
                                          • 9. Middle East & Africa Acaricides Industry Analysis, Insights and Forecast, 2019-2031
                                            • 9.1. Market Analysis, Insights and Forecast - by Production Analysis
                                              • 9.2. Market Analysis, Insights and Forecast - by Consumption Analysis
                                                • 9.3. Market Analysis, Insights and Forecast - by Import Market Analysis (Value & Volume)
                                                  • 9.4. Market Analysis, Insights and Forecast - by Export Market Analysis (Value & Volume)
                                                    • 9.5. Market Analysis, Insights and Forecast - by Price Trend Analysis
                                                    • 10. Asia Pacific Acaricides Industry Analysis, Insights and Forecast, 2019-2031
                                                      • 10.1. Market Analysis, Insights and Forecast - by Production Analysis
                                                        • 10.2. Market Analysis, Insights and Forecast - by Consumption Analysis
                                                          • 10.3. Market Analysis, Insights and Forecast - by Import Market Analysis (Value & Volume)
                                                            • 10.4. Market Analysis, Insights and Forecast - by Export Market Analysis (Value & Volume)
                                                              • 10.5. Market Analysis, Insights and Forecast - by Price Trend Analysis
                                                              • 11. North America Acaricides Industry Analysis, Insights and Forecast, 2019-2031
                                                                  • 11.1. Market Analysis, Insights and Forecast - By Country/Sub-region
                                                                    • 11.1.1 United States
                                                                    • 11.1.2 Canada
                                                                    • 11.1.3 Mexico
                                                                    • 11.1.4 Rest of North America
                                                              • 12. Europe Acaricides Industry Analysis, Insights and Forecast, 2019-2031
                                                                  • 12.1. Market Analysis, Insights and Forecast - By Country/Sub-region
                                                                    • 12.1.1 Germany
                                                                    • 12.1.2 United Kingdom
                                                                    • 12.1.3 Spain
                                                                    • 12.1.4 France
                                                                    • 12.1.5 Italy
                                                                    • 12.1.6 Russia
                                                                    • 12.1.7 Rest of Europe
                                                              • 13. Asia Pacific Acaricides Industry Analysis, Insights and Forecast, 2019-2031
                                                                  • 13.1. Market Analysis, Insights and Forecast - By Country/Sub-region
                                                                    • 13.1.1 China
                                                                    • 13.1.2 India
                                                                    • 13.1.3 Japan
                                                                    • 13.1.4 Australia
                                                                    • 13.1.5 Rest of Asia Pacific
                                                              • 14. South America Acaricides Industry Analysis, Insights and Forecast, 2019-2031
                                                                  • 14.1. Market Analysis, Insights and Forecast - By Country/Sub-region
                                                                    • 14.1.1 Brazil
                                                                    • 14.1.2 Argentina
                                                                    • 14.1.3 Rest of South America
                                                              • 15. Africa Acaricides Industry Analysis, Insights and Forecast, 2019-2031
                                                                  • 15.1. Market Analysis, Insights and Forecast - By Country/Sub-region
                                                                    • 15.1.1 South Africa
                                                                    • 15.1.2 Rest of Africa
                                                              • 16. Competitive Analysis
                                                                • 16.1. Global Market Share Analysis 2024
                                                                  • 16.2. Company Profiles
                                                                    • 16.2.1 FMC Corporation
                                                                      • 16.2.1.1. Overview
                                                                      • 16.2.1.2. Products
                                                                      • 16.2.1.3. SWOT Analysis
                                                                      • 16.2.1.4. Recent Developments
                                                                      • 16.2.1.5. Financials (Based on Availability)
                                                                    • 16.2.2 Nissan Chemical Industries Ltd
                                                                      • 16.2.2.1. Overview
                                                                      • 16.2.2.2. Products
                                                                      • 16.2.2.3. SWOT Analysis
                                                                      • 16.2.2.4. Recent Developments
                                                                      • 16.2.2.5. Financials (Based on Availability)
                                                                    • 16.2.3 Syngenta International AG
                                                                      • 16.2.3.1. Overview
                                                                      • 16.2.3.2. Products
                                                                      • 16.2.3.3. SWOT Analysis
                                                                      • 16.2.3.4. Recent Developments
                                                                      • 16.2.3.5. Financials (Based on Availability)
                                                                    • 16.2.4 UPL Limite
                                                                      • 16.2.4.1. Overview
                                                                      • 16.2.4.2. Products
                                                                      • 16.2.4.3. SWOT Analysis
                                                                      • 16.2.4.4. Recent Developments
                                                                      • 16.2.4.5. Financials (Based on Availability)
                                                                    • 16.2.5 Bayer CropScience
                                                                      • 16.2.5.1. Overview
                                                                      • 16.2.5.2. Products
                                                                      • 16.2.5.3. SWOT Analysis
                                                                      • 16.2.5.4. Recent Developments
                                                                      • 16.2.5.5. Financials (Based on Availability)
                                                                    • 16.2.6 Corteva Agriscience
                                                                      • 16.2.6.1. Overview
                                                                      • 16.2.6.2. Products
                                                                      • 16.2.6.3. SWOT Analysis
                                                                      • 16.2.6.4. Recent Developments
                                                                      • 16.2.6.5. Financials (Based on Availability)
                                                                    • 16.2.7 BASF SE
                                                                      • 16.2.7.1. Overview
                                                                      • 16.2.7.2. Products
                                                                      • 16.2.7.3. SWOT Analysis
                                                                      • 16.2.7.4. Recent Developments
                                                                      • 16.2.7.5. Financials (Based on Availability)

                                                              List of Figures

                                                              1. Figure 1: Global Acaricides Industry Revenue Breakdown (Million, %) by Region 2024 & 2032
                                                              2. Figure 2: North America Acaricides Industry Revenue (Million), by Country 2024 & 2032
                                                              3. Figure 3: North America Acaricides Industry Revenue Share (%), by Country 2024 & 2032
                                                              4. Figure 4: Europe Acaricides Industry Revenue (Million), by Country 2024 & 2032
                                                              5. Figure 5: Europe Acaricides Industry Revenue Share (%), by Country 2024 & 2032
                                                              6. Figure 6: Asia Pacific Acaricides Industry Revenue (Million), by Country 2024 & 2032
                                                              7. Figure 7: Asia Pacific Acaricides Industry Revenue Share (%), by Country 2024 & 2032
                                                              8. Figure 8: South America Acaricides Industry Revenue (Million), by Country 2024 & 2032
                                                              9. Figure 9: South America Acaricides Industry Revenue Share (%), by Country 2024 & 2032
                                                              10. Figure 10: Africa Acaricides Industry Revenue (Million), by Country 2024 & 2032
                                                              11. Figure 11: Africa Acaricides Industry Revenue Share (%), by Country 2024 & 2032
                                                              12. Figure 12: North America Acaricides Industry Revenue (Million), by Production Analysis 2024 & 2032
                                                              13. Figure 13: North America Acaricides Industry Revenue Share (%), by Production Analysis 2024 & 2032
                                                              14. Figure 14: North America Acaricides Industry Revenue (Million), by Consumption Analysis 2024 & 2032
                                                              15. Figure 15: North America Acaricides Industry Revenue Share (%), by Consumption Analysis 2024 & 2032
                                                              16. Figure 16: North America Acaricides Industry Revenue (Million), by Import Market Analysis (Value & Volume) 2024 & 2032
                                                              17. Figure 17: North America Acaricides Industry Revenue Share (%), by Import Market Analysis (Value & Volume) 2024 & 2032
                                                              18. Figure 18: North America Acaricides Industry Revenue (Million), by Export Market Analysis (Value & Volume) 2024 & 2032
                                                              19. Figure 19: North America Acaricides Industry Revenue Share (%), by Export Market Analysis (Value & Volume) 2024 & 2032
                                                              20. Figure 20: North America Acaricides Industry Revenue (Million), by Price Trend Analysis 2024 & 2032
                                                              21. Figure 21: North America Acaricides Industry Revenue Share (%), by Price Trend Analysis 2024 & 2032
                                                              22. Figure 22: North America Acaricides Industry Revenue (Million), by Country 2024 & 2032
                                                              23. Figure 23: North America Acaricides Industry Revenue Share (%), by Country 2024 & 2032
                                                              24. Figure 24: South America Acaricides Industry Revenue (Million), by Production Analysis 2024 & 2032
                                                              25. Figure 25: South America Acaricides Industry Revenue Share (%), by Production Analysis 2024 & 2032
                                                              26. Figure 26: South America Acaricides Industry Revenue (Million), by Consumption Analysis 2024 & 2032
                                                              27. Figure 27: South America Acaricides Industry Revenue Share (%), by Consumption Analysis 2024 & 2032
                                                              28. Figure 28: South America Acaricides Industry Revenue (Million), by Import Market Analysis (Value & Volume) 2024 & 2032
                                                              29. Figure 29: South America Acaricides Industry Revenue Share (%), by Import Market Analysis (Value & Volume) 2024 & 2032
                                                              30. Figure 30: South America Acaricides Industry Revenue (Million), by Export Market Analysis (Value & Volume) 2024 & 2032
                                                              31. Figure 31: South America Acaricides Industry Revenue Share (%), by Export Market Analysis (Value & Volume) 2024 & 2032
                                                              32. Figure 32: South America Acaricides Industry Revenue (Million), by Price Trend Analysis 2024 & 2032
                                                              33. Figure 33: South America Acaricides Industry Revenue Share (%), by Price Trend Analysis 2024 & 2032
                                                              34. Figure 34: South America Acaricides Industry Revenue (Million), by Country 2024 & 2032
                                                              35. Figure 35: South America Acaricides Industry Revenue Share (%), by Country 2024 & 2032
                                                              36. Figure 36: Europe Acaricides Industry Revenue (Million), by Production Analysis 2024 & 2032
                                                              37. Figure 37: Europe Acaricides Industry Revenue Share (%), by Production Analysis 2024 & 2032
                                                              38. Figure 38: Europe Acaricides Industry Revenue (Million), by Consumption Analysis 2024 & 2032
                                                              39. Figure 39: Europe Acaricides Industry Revenue Share (%), by Consumption Analysis 2024 & 2032
                                                              40. Figure 40: Europe Acaricides Industry Revenue (Million), by Import Market Analysis (Value & Volume) 2024 & 2032
                                                              41. Figure 41: Europe Acaricides Industry Revenue Share (%), by Import Market Analysis (Value & Volume) 2024 & 2032
                                                              42. Figure 42: Europe Acaricides Industry Revenue (Million), by Export Market Analysis (Value & Volume) 2024 & 2032
                                                              43. Figure 43: Europe Acaricides Industry Revenue Share (%), by Export Market Analysis (Value & Volume) 2024 & 2032
                                                              44. Figure 44: Europe Acaricides Industry Revenue (Million), by Price Trend Analysis 2024 & 2032
                                                              45. Figure 45: Europe Acaricides Industry Revenue Share (%), by Price Trend Analysis 2024 & 2032
                                                              46. Figure 46: Europe Acaricides Industry Revenue (Million), by Country 2024 & 2032
                                                              47. Figure 47: Europe Acaricides Industry Revenue Share (%), by Country 2024 & 2032
                                                              48. Figure 48: Middle East & Africa Acaricides Industry Revenue (Million), by Production Analysis 2024 & 2032
                                                              49. Figure 49: Middle East & Africa Acaricides Industry Revenue Share (%), by Production Analysis 2024 & 2032
                                                              50. Figure 50: Middle East & Africa Acaricides Industry Revenue (Million), by Consumption Analysis 2024 & 2032
                                                              51. Figure 51: Middle East & Africa Acaricides Industry Revenue Share (%), by Consumption Analysis 2024 & 2032
                                                              52. Figure 52: Middle East & Africa Acaricides Industry Revenue (Million), by Import Market Analysis (Value & Volume) 2024 & 2032
                                                              53. Figure 53: Middle East & Africa Acaricides Industry Revenue Share (%), by Import Market Analysis (Value & Volume) 2024 & 2032
                                                              54. Figure 54: Middle East & Africa Acaricides Industry Revenue (Million), by Export Market Analysis (Value & Volume) 2024 & 2032
                                                              55. Figure 55: Middle East & Africa Acaricides Industry Revenue Share (%), by Export Market Analysis (Value & Volume) 2024 & 2032
                                                              56. Figure 56: Middle East & Africa Acaricides Industry Revenue (Million), by Price Trend Analysis 2024 & 2032
                                                              57. Figure 57: Middle East & Africa Acaricides Industry Revenue Share (%), by Price Trend Analysis 2024 & 2032
                                                              58. Figure 58: Middle East & Africa Acaricides Industry Revenue (Million), by Country 2024 & 2032
                                                              59. Figure 59: Middle East & Africa Acaricides Industry Revenue Share (%), by Country 2024 & 2032
                                                              60. Figure 60: Asia Pacific Acaricides Industry Revenue (Million), by Production Analysis 2024 & 2032
                                                              61. Figure 61: Asia Pacific Acaricides Industry Revenue Share (%), by Production Analysis 2024 & 2032
                                                              62. Figure 62: Asia Pacific Acaricides Industry Revenue (Million), by Consumption Analysis 2024 & 2032
                                                              63. Figure 63: Asia Pacific Acaricides Industry Revenue Share (%), by Consumption Analysis 2024 & 2032
                                                              64. Figure 64: Asia Pacific Acaricides Industry Revenue (Million), by Import Market Analysis (Value & Volume) 2024 & 2032
                                                              65. Figure 65: Asia Pacific Acaricides Industry Revenue Share (%), by Import Market Analysis (Value & Volume) 2024 & 2032
                                                              66. Figure 66: Asia Pacific Acaricides Industry Revenue (Million), by Export Market Analysis (Value & Volume) 2024 & 2032
                                                              67. Figure 67: Asia Pacific Acaricides Industry Revenue Share (%), by Export Market Analysis (Value & Volume) 2024 & 2032
                                                              68. Figure 68: Asia Pacific Acaricides Industry Revenue (Million), by Price Trend Analysis 2024 & 2032
                                                              69. Figure 69: Asia Pacific Acaricides Industry Revenue Share (%), by Price Trend Analysis 2024 & 2032
                                                              70. Figure 70: Asia Pacific Acaricides Industry Revenue (Million), by Country 2024 & 2032
                                                              71. Figure 71: Asia Pacific Acaricides Industry Revenue Share (%), by Country 2024 & 2032

                                                              List of Tables

                                                              1. Table 1: Global Acaricides Industry Revenue Million Forecast, by Region 2019 & 2032
                                                              2. Table 2: Global Acaricides Industry Revenue Million Forecast, by Production Analysis 2019 & 2032
                                                              3. Table 3: Global Acaricides Industry Revenue Million Forecast, by Consumption Analysis 2019 & 2032
                                                              4. Table 4: Global Acaricides Industry Revenue Million Forecast, by Import Market Analysis (Value & Volume) 2019 & 2032
                                                              5. Table 5: Global Acaricides Industry Revenue Million Forecast, by Export Market Analysis (Value & Volume) 2019 & 2032
                                                              6. Table 6: Global Acaricides Industry Revenue Million Forecast, by Price Trend Analysis 2019 & 2032
                                                              7. Table 7: Global Acaricides Industry Revenue Million Forecast, by Region 2019 & 2032
                                                              8. Table 8: Global Acaricides Industry Revenue Million Forecast, by Country 2019 & 2032
                                                              9. Table 9: United States Acaricides Industry Revenue (Million) Forecast, by Application 2019 & 2032
                                                              10. Table 10: Canada Acaricides Industry Revenue (Million) Forecast, by Application 2019 & 2032
                                                              11. Table 11: Mexico Acaricides Industry Revenue (Million) Forecast, by Application 2019 & 2032
                                                              12. Table 12: Rest of North America Acaricides Industry Revenue (Million) Forecast, by Application 2019 & 2032
                                                              13. Table 13: Global Acaricides Industry Revenue Million Forecast, by Country 2019 & 2032
                                                              14. Table 14: Germany Acaricides Industry Revenue (Million) Forecast, by Application 2019 & 2032
                                                              15. Table 15: United Kingdom Acaricides Industry Revenue (Million) Forecast, by Application 2019 & 2032
                                                              16. Table 16: Spain Acaricides Industry Revenue (Million) Forecast, by Application 2019 & 2032
                                                              17. Table 17: France Acaricides Industry Revenue (Million) Forecast, by Application 2019 & 2032
                                                              18. Table 18: Italy Acaricides Industry Revenue (Million) Forecast, by Application 2019 & 2032
                                                              19. Table 19: Russia Acaricides Industry Revenue (Million) Forecast, by Application 2019 & 2032
                                                              20. Table 20: Rest of Europe Acaricides Industry Revenue (Million) Forecast, by Application 2019 & 2032
                                                              21. Table 21: Global Acaricides Industry Revenue Million Forecast, by Country 2019 & 2032
                                                              22. Table 22: China Acaricides Industry Revenue (Million) Forecast, by Application 2019 & 2032
                                                              23. Table 23: India Acaricides Industry Revenue (Million) Forecast, by Application 2019 & 2032
                                                              24. Table 24: Japan Acaricides Industry Revenue (Million) Forecast, by Application 2019 & 2032
                                                              25. Table 25: Australia Acaricides Industry Revenue (Million) Forecast, by Application 2019 & 2032
                                                              26. Table 26: Rest of Asia Pacific Acaricides Industry Revenue (Million) Forecast, by Application 2019 & 2032
                                                              27. Table 27: Global Acaricides Industry Revenue Million Forecast, by Country 2019 & 2032
                                                              28. Table 28: Brazil Acaricides Industry Revenue (Million) Forecast, by Application 2019 & 2032
                                                              29. Table 29: Argentina Acaricides Industry Revenue (Million) Forecast, by Application 2019 & 2032
                                                              30. Table 30: Rest of South America Acaricides Industry Revenue (Million) Forecast, by Application 2019 & 2032
                                                              31. Table 31: Global Acaricides Industry Revenue Million Forecast, by Country 2019 & 2032
                                                              32. Table 32: South Africa Acaricides Industry Revenue (Million) Forecast, by Application 2019 & 2032
                                                              33. Table 33: Rest of Africa Acaricides Industry Revenue (Million) Forecast, by Application 2019 & 2032
                                                              34. Table 34: Global Acaricides Industry Revenue Million Forecast, by Production Analysis 2019 & 2032
                                                              35. Table 35: Global Acaricides Industry Revenue Million Forecast, by Consumption Analysis 2019 & 2032
                                                              36. Table 36: Global Acaricides Industry Revenue Million Forecast, by Import Market Analysis (Value & Volume) 2019 & 2032
                                                              37. Table 37: Global Acaricides Industry Revenue Million Forecast, by Export Market Analysis (Value & Volume) 2019 & 2032
                                                              38. Table 38: Global Acaricides Industry Revenue Million Forecast, by Price Trend Analysis 2019 & 2032
                                                              39. Table 39: Global Acaricides Industry Revenue Million Forecast, by Country 2019 & 2032
                                                              40. Table 40: United States Acaricides Industry Revenue (Million) Forecast, by Application 2019 & 2032
                                                              41. Table 41: Canada Acaricides Industry Revenue (Million) Forecast, by Application 2019 & 2032
                                                              42. Table 42: Mexico Acaricides Industry Revenue (Million) Forecast, by Application 2019 & 2032
                                                              43. Table 43: Global Acaricides Industry Revenue Million Forecast, by Production Analysis 2019 & 2032
                                                              44. Table 44: Global Acaricides Industry Revenue Million Forecast, by Consumption Analysis 2019 & 2032
                                                              45. Table 45: Global Acaricides Industry Revenue Million Forecast, by Import Market Analysis (Value & Volume) 2019 & 2032
                                                              46. Table 46: Global Acaricides Industry Revenue Million Forecast, by Export Market Analysis (Value & Volume) 2019 & 2032
                                                              47. Table 47: Global Acaricides Industry Revenue Million Forecast, by Price Trend Analysis 2019 & 2032
                                                              48. Table 48: Global Acaricides Industry Revenue Million Forecast, by Country 2019 & 2032
                                                              49. Table 49: Brazil Acaricides Industry Revenue (Million) Forecast, by Application 2019 & 2032
                                                              50. Table 50: Argentina Acaricides Industry Revenue (Million) Forecast, by Application 2019 & 2032
                                                              51. Table 51: Rest of South America Acaricides Industry Revenue (Million) Forecast, by Application 2019 & 2032
                                                              52. Table 52: Global Acaricides Industry Revenue Million Forecast, by Production Analysis 2019 & 2032
                                                              53. Table 53: Global Acaricides Industry Revenue Million Forecast, by Consumption Analysis 2019 & 2032
                                                              54. Table 54: Global Acaricides Industry Revenue Million Forecast, by Import Market Analysis (Value & Volume) 2019 & 2032
                                                              55. Table 55: Global Acaricides Industry Revenue Million Forecast, by Export Market Analysis (Value & Volume) 2019 & 2032
                                                              56. Table 56: Global Acaricides Industry Revenue Million Forecast, by Price Trend Analysis 2019 & 2032
                                                              57. Table 57: Global Acaricides Industry Revenue Million Forecast, by Country 2019 & 2032
                                                              58. Table 58: United Kingdom Acaricides Industry Revenue (Million) Forecast, by Application 2019 & 2032
                                                              59. Table 59: Germany Acaricides Industry Revenue (Million) Forecast, by Application 2019 & 2032
                                                              60. Table 60: France Acaricides Industry Revenue (Million) Forecast, by Application 2019 & 2032
                                                              61. Table 61: Italy Acaricides Industry Revenue (Million) Forecast, by Application 2019 & 2032
                                                              62. Table 62: Spain Acaricides Industry Revenue (Million) Forecast, by Application 2019 & 2032
                                                              63. Table 63: Russia Acaricides Industry Revenue (Million) Forecast, by Application 2019 & 2032
                                                              64. Table 64: Benelux Acaricides Industry Revenue (Million) Forecast, by Application 2019 & 2032
                                                              65. Table 65: Nordics Acaricides Industry Revenue (Million) Forecast, by Application 2019 & 2032
                                                              66. Table 66: Rest of Europe Acaricides Industry Revenue (Million) Forecast, by Application 2019 & 2032
                                                              67. Table 67: Global Acaricides Industry Revenue Million Forecast, by Production Analysis 2019 & 2032
                                                              68. Table 68: Global Acaricides Industry Revenue Million Forecast, by Consumption Analysis 2019 & 2032
                                                              69. Table 69: Global Acaricides Industry Revenue Million Forecast, by Import Market Analysis (Value & Volume) 2019 & 2032
                                                              70. Table 70: Global Acaricides Industry Revenue Million Forecast, by Export Market Analysis (Value & Volume) 2019 & 2032
                                                              71. Table 71: Global Acaricides Industry Revenue Million Forecast, by Price Trend Analysis 2019 & 2032
                                                              72. Table 72: Global Acaricides Industry Revenue Million Forecast, by Country 2019 & 2032
                                                              73. Table 73: Turkey Acaricides Industry Revenue (Million) Forecast, by Application 2019 & 2032
                                                              74. Table 74: Israel Acaricides Industry Revenue (Million) Forecast, by Application 2019 & 2032
                                                              75. Table 75: GCC Acaricides Industry Revenue (Million) Forecast, by Application 2019 & 2032
                                                              76. Table 76: North Africa Acaricides Industry Revenue (Million) Forecast, by Application 2019 & 2032
                                                              77. Table 77: South Africa Acaricides Industry Revenue (Million) Forecast, by Application 2019 & 2032
                                                              78. Table 78: Rest of Middle East & Africa Acaricides Industry Revenue (Million) Forecast, by Application 2019 & 2032
                                                              79. Table 79: Global Acaricides Industry Revenue Million Forecast, by Production Analysis 2019 & 2032
                                                              80. Table 80: Global Acaricides Industry Revenue Million Forecast, by Consumption Analysis 2019 & 2032
                                                              81. Table 81: Global Acaricides Industry Revenue Million Forecast, by Import Market Analysis (Value & Volume) 2019 & 2032
                                                              82. Table 82: Global Acaricides Industry Revenue Million Forecast, by Export Market Analysis (Value & Volume) 2019 & 2032
                                                              83. Table 83: Global Acaricides Industry Revenue Million Forecast, by Price Trend Analysis 2019 & 2032
                                                              84. Table 84: Global Acaricides Industry Revenue Million Forecast, by Country 2019 & 2032
                                                              85. Table 85: China Acaricides Industry Revenue (Million) Forecast, by Application 2019 & 2032
                                                              86. Table 86: India Acaricides Industry Revenue (Million) Forecast, by Application 2019 & 2032
                                                              87. Table 87: Japan Acaricides Industry Revenue (Million) Forecast, by Application 2019 & 2032
                                                              88. Table 88: South Korea Acaricides Industry Revenue (Million) Forecast, by Application 2019 & 2032
                                                              89. Table 89: ASEAN Acaricides Industry Revenue (Million) Forecast, by Application 2019 & 2032
                                                              90. Table 90: Oceania Acaricides Industry Revenue (Million) Forecast, by Application 2019 & 2032
                                                              91. Table 91: Rest of Asia Pacific Acaricides Industry Revenue (Million) Forecast, by Application 2019 & 2032


                                                              Frequently Asked Questions

                                                              1. What is the projected Compound Annual Growth Rate (CAGR) of the Acaricides Industry?

                                                              The projected CAGR is approximately 5.00%.

                                                              2. Which companies are prominent players in the Acaricides Industry?

                                                              Key companies in the market include FMC Corporation, Nissan Chemical Industries Ltd, Syngenta International AG, UPL Limite, Bayer CropScience, Corteva Agriscience, BASF SE.

                                                              3. What are the main segments of the Acaricides Industry?

                                                              The market segments include Production Analysis, Consumption Analysis, Import Market Analysis (Value & Volume), Export Market Analysis (Value & Volume), Price Trend Analysis.

                                                              4. Can you provide details about the market size?

                                                              The market size is estimated to be USD 369.34 Million as of 2022.

                                                              5. What are some drivers contributing to market growth?

                                                              Shortage of Skilled Labor; Government Support to Enhance Farm Mechanization.

                                                              6. What are the notable trends driving market growth?

                                                              Increasing Demand for Natural Products.

                                                              7. Are there any restraints impacting market growth?

                                                              Heavy Initial Procurement Cost and High Expenditure on Maintenance.

                                                              8. Can you provide examples of recent developments in the market?

                                                              N/A

                                                              9. What pricing options are available for accessing the report?

                                                              Pricing options include single-user, multi-user, and enterprise licenses priced at USD 4750, USD 5250, and USD 8750 respectively.

                                                              10. Is the market size provided in terms of value or volume?

                                                              The market size is provided in terms of value, measured in Million.

                                                              11. Are there any specific market keywords associated with the report?

                                                              Yes, the market keyword associated with the report is "Acaricides Industry," which aids in identifying and referencing the specific market segment covered.

                                                              12. How do I determine which pricing option suits my needs best?

                                                              The pricing options vary based on user requirements and access needs. Individual users may opt for single-user licenses, while businesses requiring broader access may choose multi-user or enterprise licenses for cost-effective access to the report.

                                                              13. Are there any additional resources or data provided in the Acaricides Industry report?

                                                              While the report offers comprehensive insights, it's advisable to review the specific contents or supplementary materials provided to ascertain if additional resources or data are available.

                                                              14. How can I stay updated on further developments or reports in the Acaricides Industry?

                                                              To stay informed about further developments, trends, and reports in the Acaricides Industry, consider subscribing to industry newsletters, following relevant companies and organizations, or regularly checking reputable industry news sources and publications.


                                                              Methodology

                                                              Step 1 - Identification of Relevant Samples Size from Population Database

                                                              Step Chart
                                                              Bar Chart
                                                              Method Chart

                                                              Step 2 - Approaches for Defining Global Market Size (Value, Volume* & Price*)

                                                              Approach Chart
                                                              Top-down and bottom-up approaches are used to validate the global market size and estimate the market size for manufactures, regional segments, product, and application.

                                                              Note*: In applicable scenarios

                                                              Step 3 - Data Sources

                                                              Primary Research

                                                              • Web Analytics
                                                              • Survey Reports
                                                              • Research Institute
                                                              • Latest Research Reports
                                                              • Opinion Leaders

                                                              Secondary Research

                                                              • Annual Reports
                                                              • White Paper
                                                              • Latest Press Release
                                                              • Industry Association
                                                              • Paid Database
                                                              • Investor Presentations
                                                              Analyst Chart

                                                              Step 4 - Data Triangulation

                                                              Involves using different sources of information in order to increase the validity of a study

                                                              These sources are likely to be stakeholders in a program - participants, other researchers, program staff, other community members, and so on.

                                                              Then we put all data in single framework & apply various statistical tools to find out the dynamic on the market.

                                                              During the analysis stage, feedback from the stakeholder groups would be compared to determine areas of agreement as well as areas of divergence

                                                              Additionally, after gathering mixed and scattered data from a wide range of sources, data is triangulated and correlated to come up with estimated figures which are further validated through primary mediums or industry experts, opinion leaders.

                                                              About Visionary Data Reports

                                                              Visionary Data Reports provides future-focused market research, advanced analytics, and strategic insights for technology, healthcare, green energy, and finance. Our reports help you anticipate trends, innovate, and lead in your industry. Our expert team combines primary research, data science, and industry knowledge to deliver actionable intelligence. We offer syndicated reports, custom analytics, and consulting services tailored to your business needs. At Visionary Data Reports, we are committed to quality, transparency, and client satisfaction. Every report is rigorously validated to ensure accuracy and relevance. Our global perspective and forward-thinking approach help you understand both current and emerging market dynamics.

                                                              Stay ahead with Visionary Data Reports. Subscribe to our newsletter for the latest insights and research highlights, and follow us on social media for real-time updates. Visionary Data Reports – Your Guide to Tomorrow’s Opportunities.

                                                              artwork spiralartwork spiralRelated Reports
                                                              artwork underline

                                                              Sudan Alfalfa Market Trends and Forecasts: Comprehensive Insights

                                                              Discover the booming Sudan alfalfa market! Projected to reach $373.33 million by 2033, with a 5.5% CAGR, this report analyzes market drivers, trends, and key players like Syngenta and DLF Seeds across segments including hay, pellets & seeds for livestock and human consumption. Explore regional data and investment opportunities.

                                                              July 2025
                                                              Base Year: 2024
                                                              No Of Pages: 150
                                                              Price: $3800

                                                              North America Specialty Fertilizer Market 2025-2033 Overview: Trends, Competitor Dynamics, and Opportunities

                                                              The North American specialty fertilizer market is experiencing robust growth, driven by precision agriculture, sustainable farming practices, and demand for high-yield crops. Explore market size, CAGR, key players (Koch Industries, Mosaic, Nutrien), and regional trends (US, Canada, Mexico) in this in-depth analysis. Discover opportunities and challenges in the liquid, slow-release, and water-soluble fertilizer segments.

                                                              July 2025
                                                              Base Year: 2024
                                                              No Of Pages: 197
                                                              Price: $3800

                                                              Europe Chia Seeds Market Market’s Role in Emerging Tech: Insights and Projections 2025-2033

                                                              Discover the booming European chia seeds market! This in-depth analysis reveals market size, CAGR, key players (The Chia Company, Salba, Nutiva), and growth drivers. Explore trends in packaging, applications (food, supplements, personal care), and regional variations. Learn how this €414.20 million market is poised for significant expansion.

                                                              July 2025
                                                              Base Year: 2024
                                                              No Of Pages: 180
                                                              Price: $4750

                                                              Drivers of Change in Thailand Vegetable Seed Market Market 2025-2033

                                                              Discover the thriving Thailand vegetable seed market's growth trajectory (CAGR 5.20%), driven by consumer demand and technological advancements. Explore market segmentation, key players, and challenges impacting this dynamic sector projected to reach $XXX million by 2033.

                                                              July 2025
                                                              Base Year: 2024
                                                              No Of Pages: 150
                                                              Price: $3800

                                                              Consumer Trends Driving Indonesia Fungicide Market Market Growth

                                                              Discover the booming Indonesia Fungicide Market! This report reveals a projected 16.50% CAGR from 2025-2033, driven by rising disease prevalence, advanced application methods, and government support. Learn about market size, key players (Bayer, Syngenta, BASF), and future trends impacting this dynamic agricultural sector.

                                                              July 2025
                                                              Base Year: 2024
                                                              No Of Pages: 197
                                                              Price: $3800

                                                              Tomato Seed Market 2025-2033 Overview: Trends, Competitor Dynamics, and Opportunities

                                                              Discover the booming global tomato seed market! This comprehensive analysis reveals key trends, growth drivers (hybrid seeds, protected cultivation), restraints, and regional insights (Asia-Pacific leading) for the period 2019-2033, featuring top players like Sakata Seeds and Syngenta. Projected CAGR of 4.70% showcases significant investment opportunities.

                                                              July 2025
                                                              Base Year: 2024
                                                              No Of Pages: 180
                                                              Price: $3800

                                                              Emerging Trends in Brazil Maize Market: A Technology Perspective 2025-2033

                                                              Discover the dynamic Brazil maize market forecast (2025-2033)! This in-depth analysis reveals key growth drivers, including animal feed, biofuel, and human consumption, alongside major players like Syngenta and Corteva. Explore market size, CAGR, and regional insights to understand this lucrative opportunity.

                                                              July 2025
                                                              Base Year: 2024
                                                              No Of Pages: 180
                                                              Price: $3800

                                                              Future Forecasts for North America Seed Treatment Market Industry Growth

                                                              Discover the booming North American seed treatment market! This in-depth analysis reveals a CAGR of 4.20% (2025-2033), driven by precision farming, pest control needs, and government support. Explore key players, market segments (fungicides, insecticides, crops), and regional trends in the US, Canada, and Mexico. Get the data-driven insights you need to succeed.

                                                              July 2025
                                                              Base Year: 2024
                                                              No Of Pages: 150
                                                              Price: $3800

                                                              Africa Chia Seeds Industry Market’s Drivers and Challenges: Strategic Overview 2025-2033

                                                              Discover the booming African chia seed market! Our analysis reveals a $13.87M market in 2025, projected to grow at a 2.10% CAGR through 2033. Explore key trends, segments (organic, hybrid, processed, omega-3 rich), applications (food & beverage, supplements, personal care), and leading companies. Get insights for investment and market entry.

                                                              July 2025
                                                              Base Year: 2024
                                                              No Of Pages: 180
                                                              Price: $4750

                                                              Strategic Trends in Asia-Pacific Seed Coating Materials Market Market 2025-2033

                                                              The Asia-Pacific seed coating materials market is booming, with an 8% CAGR. Discover key trends, leading companies (BASF, Bayer), and segment analysis (polymers, colorants) driving growth in this $XX million market. Explore the forecast to 2033.

                                                              July 2025
                                                              Base Year: 2024
                                                              No Of Pages: 150
                                                              Price: $3800

                                                              Comprehensive Review of UK Fruits and Vegetables Market Growth Potential

                                                              Discover the booming UK fruits and vegetables market! This in-depth analysis reveals a £31.58 billion market with a 2.97% CAGR (2025-2033), driven by health trends and major players like Tesco and Sainsbury's. Explore regional data, consumption patterns, and future growth potential.

                                                              July 2025
                                                              Base Year: 2024
                                                              No Of Pages: 180
                                                              Price: $3800

                                                              Malaysia Agrochemical Market Market’s Drivers and Challenges: Strategic Overview 2025-2033

                                                              Discover the booming Malaysian agrochemical market! This comprehensive analysis reveals a RM 679.59 million market in 2025, projected to grow at a 4.56% CAGR until 2033. Explore key drivers, trends, restraints, and leading companies shaping this dynamic sector. Learn about fertilizers, pesticides, and other agrochemical segments.

                                                              July 2025
                                                              Base Year: 2024
                                                              No Of Pages: 150
                                                              Price: $3800

                                                              Drivers of Change in Agricultural Surfactant Market Market 2025-2033

                                                              The global agricultural surfactant market is booming, projected to reach $3.56 billion by 2033 with a 6.70% CAGR. Driven by precision agriculture and sustainable farming, this market analysis explores key segments (anionic, nonionic, bio-based), top players (BASF, Clariant), and regional growth trends. Discover the future of agricultural surfactants.

                                                              July 2025
                                                              Base Year: 2024
                                                              No Of Pages: 234
                                                              Price: $4750

                                                              Cameroon Grains Industry Industry Analysis and Consumer Behavior

                                                              Discover the booming Cameroon grains industry! Explore market size, growth trends (4.80% CAGR), key players (Sodecoton, CDC, etc.), and challenges impacting cereals, pulses, and oilseeds in Cameroon from 2019-2033. Invest wisely in this promising African market.

                                                              July 2025
                                                              Base Year: 2024
                                                              No Of Pages: 180
                                                              Price: $3800

                                                              Analyzing Consumer Behavior in Agriculture Market in Tanzania Market

                                                              Discover the booming Tanzanian agriculture market! Projected to reach $17.44 billion in 2025, with a 5.63% CAGR, this report analyzes market size, key players (Syngenta, Rijk Zwaan), growth drivers, and future trends in Tanzania's agricultural sector. Explore market segments, including food crops and investment opportunities.

                                                              July 2025
                                                              Base Year: 2024
                                                              No Of Pages: 150
                                                              Price: $3800

                                                              Analyzing Consumer Behavior in Artificial Intelligence in Agriculture Industry Market

                                                              Discover the booming AI in Agriculture market! This comprehensive analysis reveals a 4.20% CAGR, key drivers, trends, restraints, and regional insights from 2019-2033. Learn about leading companies and applications like precision farming, drone analytics, and weather tracking. Explore market size projections and future growth potential.

                                                              July 2025
                                                              Base Year: 2024
                                                              No Of Pages: 150
                                                              Price: $4750

                                                              Exploring Forestry Machinery Market’s Market Size Dynamics 2025-2033

                                                              The global forestry machinery market is booming, projected to reach $15 billion by 2033, driven by rising timber demand and technological advancements. Explore market trends, key players (Deere, Komatsu, etc.), and regional growth in our comprehensive analysis.

                                                              July 2025
                                                              Base Year: 2024
                                                              No Of Pages: 150
                                                              Price: $4750

                                                              Nutrition Canary Seed Market Competitive Strategies: Trends and Forecasts 2025-2033

                                                              Discover the booming nutrition canary seed market! Explore key trends, growth drivers, and regional market share projections for 2025-2033. Learn about leading companies and the increasing demand driven by health-conscious consumers and the birdseed industry.

                                                              July 2025
                                                              Base Year: 2024
                                                              No Of Pages: 234
                                                              Price: $4750

                                                              Consumer Behavior and Cashews Market in South America Trends

                                                              Discover the booming South American cashew market! This comprehensive analysis reveals a $582.24 million market in 2025, projected to grow at a 5.20% CAGR through 2033. Explore key trends, drivers, and leading companies shaping this lucrative industry.

                                                              July 2025
                                                              Base Year: 2024
                                                              No Of Pages: 180
                                                              Price: $3800

                                                              Strategic Growth Drivers for Rye Industry Market

                                                              Discover the latest market analysis of the global rye industry, projecting a steady CAGR of 2.20% to 2033. Explore key drivers, restraints, and regional trends impacting the growth of rye in food, feed, and beverage applications. Learn about leading companies and future market opportunities.

                                                              July 2025
                                                              Base Year: 2024
                                                              No Of Pages: 234
                                                              Price: $4750
                                                              • Home
                                                              • About Us
                                                              • Industries
                                                                • Aerospace & Defense
                                                                • Agriculture
                                                                • Animal Nutrition & Wellness
                                                                • Automotive
                                                                • Chemicals & Materials
                                                                • Consumer Goods and Services
                                                                • Energy & Power
                                                                • Financial Services and Investment Intelligence
                                                                • Food & Beverage
                                                                • Home and Property Improvement
                                                                • Hospitality and Tourism
                                                                • Logistics
                                                                • Manufacturing Products and Services
                                                                • Packaging
                                                                • Professional and Commercial Services
                                                                • Real Estate and Construction
                                                                • Retail
                                                                • Technology, Media and Telecom
                                                                • Healthcare
                                                              • Services
                                                              • Contact
                                                              Main Logo
                                                              • Home
                                                              • About Us
                                                              • Industries
                                                                • Aerospace & Defense
                                                                • Agriculture
                                                                • Animal Nutrition & Wellness
                                                                • Automotive
                                                                • Chemicals & Materials
                                                                • Consumer Goods and Services
                                                                • Energy & Power
                                                                • Financial Services and Investment Intelligence
                                                                • Food & Beverage
                                                                • Home and Property Improvement
                                                                • Hospitality and Tourism
                                                                • Logistics
                                                                • Manufacturing Products and Services
                                                                • Packaging
                                                                • Professional and Commercial Services
                                                                • Real Estate and Construction
                                                                • Retail
                                                                • Technology, Media and Telecom
                                                                • Healthcare
                                                              • Services
                                                              • Contact
                                                              +17162654855
                                                              [email protected]

                                                              +17162654855

                                                              [email protected]

                                                              Business Address

                                                              Head Office

                                                              Office no. A 5010, fifth floor, Solitaire Business Hub, Near Phoenix mall, Pune, Maharashtra 411014

                                                              Contact Information

                                                              Craig Francis

                                                              Business Development Head

                                                              +17162654855

                                                              [email protected]

                                                              Connect With Us

                                                              Secure Payment Partners

                                                              payment image
                                                              RetailLogisticsPackagingAutomotiveHealthcareAgricultureEnergy & PowerFood & BeverageAerospace & DefenseChemicals & MaterialsHospitality and TourismAnimal Nutrition & WellnessConsumer Goods and ServicesReal Estate and ConstructionHome and Property ImprovementTechnology, Media and TelecomManufacturing Products and ServicesFinancial Services and Investment Intelligence

                                                              © 2025 All rights reserved


                                                              Privacy Policy
                                                              Terms and Conditions
                                                              FAQ