

Key Insights
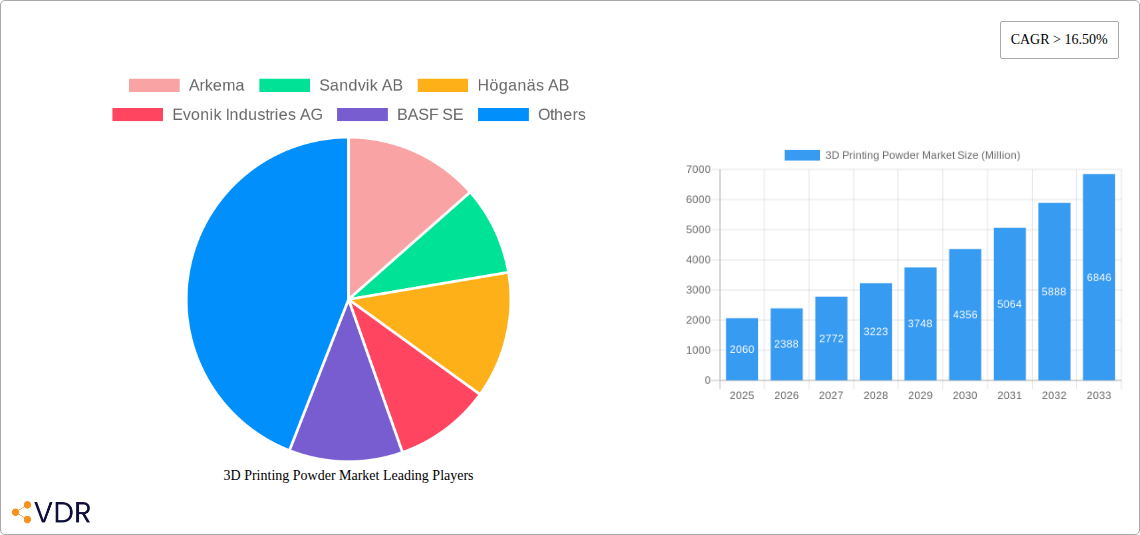
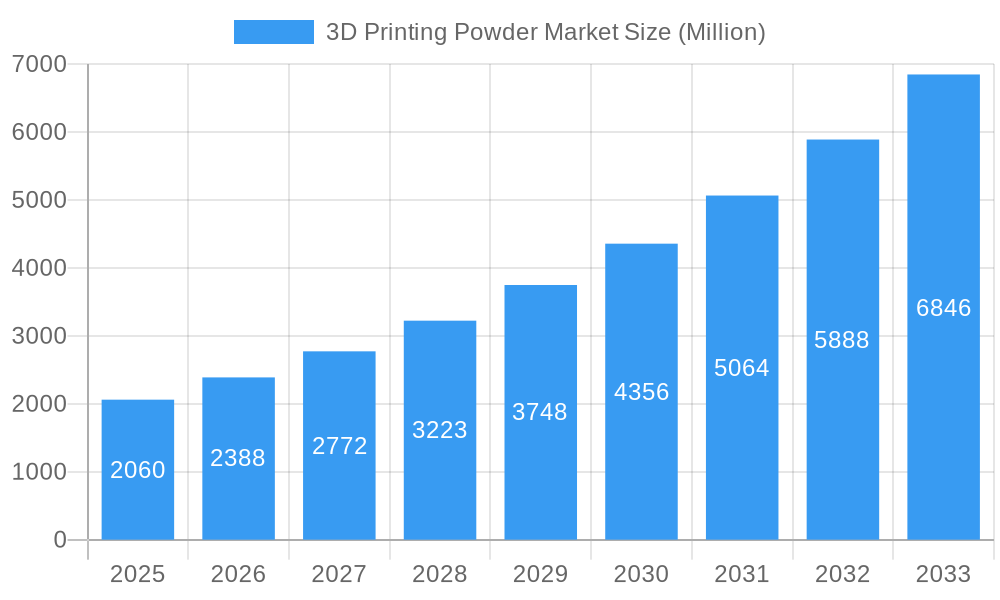
The 3D printing powder market is experiencing robust growth, projected to reach a market size exceeding $2.06 billion by 2025 and exhibiting a Compound Annual Growth Rate (CAGR) of over 16.50% from 2025 to 2033. This expansion is fueled by several key drivers. The increasing adoption of additive manufacturing across diverse sectors, including automotive, aerospace, medical, and architecture, is a significant factor. Demand for lightweight, high-strength, and customized components is driving innovation in powder materials and expanding the applications of 3D printing. Furthermore, advancements in powder metallurgy techniques and the development of new powder materials with enhanced properties are contributing to market growth. The segment of plastic powders currently holds a dominant market share due to its cost-effectiveness and versatility in various applications. However, metal powders are projected to experience significant growth due to their increasing use in high-performance applications such as aerospace and medical devices. Geographic expansion, particularly in rapidly developing economies of Asia-Pacific and other regions, is also contributing to the overall market expansion. While challenges remain, such as the relatively high cost of 3D printing and the need for skilled operators, the overall market outlook remains positive, driven by continuous technological advancements and expanding applications.
3D Printing Powder Market Market Size (In Billion)
Despite the promising growth trajectory, the market faces certain restraints. The high initial investment cost associated with 3D printing equipment can act as a barrier to entry for smaller companies. The complexity of the technology and the need for skilled personnel to operate and maintain the equipment also pose challenges. Furthermore, fluctuations in raw material prices and concerns regarding the environmental impact of powder production and disposal represent potential obstacles to sustainable market growth. However, these challenges are being actively addressed through ongoing research and development efforts focused on cost reduction, process optimization, and sustainable material sourcing and recycling. The market is witnessing the emergence of new players and strategic collaborations, particularly in developing innovative materials and expanding production capacities, further indicating a positive outlook for the future of this technology.
3D Printing Powder Market Company Market Share
3D Printing Powder Market: A Comprehensive Report (2019-2033)
This comprehensive report provides a detailed analysis of the 3D printing powder market, encompassing market dynamics, growth trends, regional dominance, product landscape, challenges, opportunities, and key players. The study period spans from 2019 to 2033, with 2025 serving as the base and estimated year. The forecast period covers 2025-2033, while the historical period encompasses 2019-2024. The market is segmented by powder type (Plastic Powder, Metal Powder, Ceramic Powder, Glass Powder, Other Types), and end-user industry (Automotive, Aerospace & Defense, Medical, Architecture, Other). The market size is valued in Million units.
3D Printing Powder Market Dynamics & Structure
This section analyzes the competitive landscape of the 3D printing powder market, considering market concentration, technological advancements, regulatory landscapes, substitute products, end-user demographics, and mergers & acquisitions (M&A) activities. The market exhibits a moderately concentrated structure, with key players holding significant market shares. Technological innovation, particularly in material science and additive manufacturing processes, is a primary growth driver. Stringent regulatory frameworks concerning material safety and environmental impact influence market dynamics. The emergence of substitute technologies and materials poses a competitive challenge.
- Market Concentration: The top 5 players hold approximately xx% of the market share in 2025.
- Technological Innovation: Focus on developing high-performance, biocompatible, and sustainable powders is driving innovation. The development of new powder types for specialized applications will further stimulate the market.
- Regulatory Framework: Stringent regulations regarding material safety and environmental impact are expected to influence market growth. Compliance costs and potential limitations affect market entry and expansion.
- Competitive Substitutes: Traditional manufacturing methods and alternative 3D printing technologies present competitive pressure. The development of cost-effective and high-performance alternatives could reduce demand for 3D printing powders.
- End-User Demographics: The automotive, aerospace, and medical sectors are key end-users, driving significant demand. Growing adoption across other industries will further expand the market.
- M&A Trends: The number of M&A deals in the 3D printing powder sector has increased by xx% from 2019 to 2024, reflecting strategic consolidation and expansion efforts.
3D Printing Powder Market Growth Trends & Insights
This section provides a comprehensive overview of the 3D printing powder market's growth trajectory, adoption rates, technological disruptions, and evolving consumer behavior. The market has witnessed substantial growth over the historical period (2019-2024), driven by factors such as increasing demand for customized products, advancements in additive manufacturing technologies, and cost reductions. The market is projected to experience a Compound Annual Growth Rate (CAGR) of xx% during the forecast period (2025-2033). Market penetration in key end-user industries is expected to increase significantly due to the rising adoption of 3D printing technologies for rapid prototyping, mass customization, and on-demand manufacturing. Technological disruptions, such as the introduction of new materials and printing processes, will continue to shape market growth. The demand for sustainable and biocompatible powders is increasing, influencing consumer preferences and market trends.
Dominant Regions, Countries, or Segments in 3D Printing Powder Market
This section identifies the leading regions, countries, and segments driving market growth. North America and Europe currently hold significant market shares, driven by strong technological advancements, favorable regulatory frameworks, and high adoption rates across key industries. However, the Asia-Pacific region is expected to witness the fastest growth in the forecast period due to rising industrialization, technological investments, and increasing demand from emerging economies.
- Powder Type: Metal powder segment dominates owing to its extensive use in various industries, particularly aerospace and automotive.
- End-user Industry: The automotive industry is the dominant end-user segment due to high adoption of additive manufacturing for prototyping and production of lightweight components.
- Key Drivers:
- Growing demand for lightweight and high-strength materials in the automotive and aerospace industries.
- Increasing adoption of 3D printing in the medical sector for customized implants and prosthetics.
- Rising investment in research and development activities in additive manufacturing technologies.
3D Printing Powder Market Product Landscape
The 3D printing powder market features a diverse range of products, catering to various applications and end-user needs. Powder characteristics, such as particle size distribution, flowability, and chemical composition, are crucial for printing performance and part quality. Recent innovations focus on enhancing material properties, expanding application possibilities, and improving printing efficiency. The development of high-performance, biocompatible, and sustainable powders is a key trend. Unique selling propositions for individual products include superior mechanical properties, enhanced processability, and reduced printing time.
Key Drivers, Barriers & Challenges in 3D Printing Powder Market
Key Drivers: The rising adoption of additive manufacturing across various industries, increasing demand for customized products, and advancements in material science and printing technologies are key drivers. Government initiatives and subsidies supporting the adoption of 3D printing further propel market growth.
Key Challenges: High material costs, inconsistent powder quality, lack of standardization in powder specifications, and complex post-processing requirements pose significant challenges. Supply chain disruptions, especially raw material shortages, also affect market growth. The limited availability of skilled labor for operating and maintaining 3D printing systems restricts wider adoption.
Emerging Opportunities in 3D Printing Powder Market
Emerging opportunities include the expansion into untapped markets, such as personalized medicine and consumer goods. The development of new materials with enhanced properties, such as biodegradability and self-healing capabilities, opens new avenues. The increasing demand for sustainable and environmentally friendly powders is shaping market trends.
Growth Accelerators in the 3D Printing Powder Market Industry
Technological breakthroughs, such as the development of novel powder materials and improved printing processes, are key growth catalysts. Strategic partnerships between material suppliers and 3D printing equipment manufacturers streamline the supply chain and enhance product development. Expansion into new geographic markets, particularly in emerging economies, presents significant growth potential.
Key Players Shaping the 3D Printing Powder Market Market
- Arkema
- Sandvik AB
- Höganäs AB
- Evonik Industries AG
- BASF SE
- Metalysis
- ERASTEEL
- GKN Powder Metallurgy
- ExOne
Notable Milestones in 3D Printing Powder Market Sector
- 2022: Arkema launched a new range of high-performance plastic powders for 3D printing.
- 2023: Sandvik AB and Höganäs AB announced a joint venture to develop advanced metal powders for additive manufacturing.
- 2024: BASF SE introduced a new sustainable metal powder production process.
- (Further milestones to be added based on available data)
In-Depth 3D Printing Powder Market Market Outlook
The 3D printing powder market is poised for significant growth in the coming years, driven by continued advancements in additive manufacturing technologies, increasing demand across various industries, and the emergence of new applications. Strategic partnerships, acquisitions, and investments in research and development will further shape market dynamics. The focus on developing sustainable and cost-effective powder materials will play a crucial role in expanding market reach and penetration.
3D Printing Powder Market Segmentation
-
1. Powder Type
- 1.1. Plastic Powder
- 1.2. Metal Powder
- 1.3. Ceramic Powder
- 1.4. Glass Powder
- 1.5. Other Types (Composite Powder, etc.)
-
2. End-user Industry
- 2.1. Automotive
- 2.2. Aerospace and Defense
- 2.3. Medical
- 2.4. Architecture
- 2.5. Other En
3D Printing Powder Market Segmentation By Geography
-
1. Asia Pacific
- 1.1. China
- 1.2. India
- 1.3. Japan
- 1.4. South Korea
- 1.5. Rest of Asia Pacific
-
2. North America
- 2.1. United States
- 2.2. Canada
- 2.3. Mexico
-
3. Europe
- 3.1. Germany
- 3.2. United Kingdom
- 3.3. France
- 3.4. Italy
- 3.5. Rest of Europe
-
4. South America
- 4.1. Brazil
- 4.2. Argentina
- 4.3. Rest of South America
-
5. Middle East and Africa
- 5.1. Saudi Arabia
- 5.2. South Africa
- 5.3. Rest of Middle East and Africa
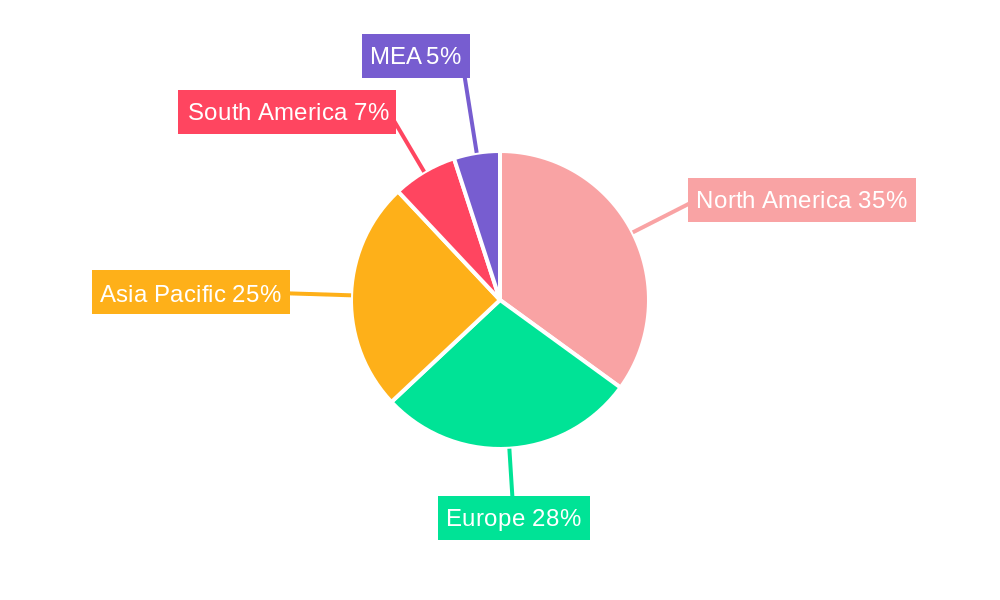
3D Printing Powder Market Regional Market Share
Geographic Coverage of 3D Printing Powder Market
3D Printing Powder Market REPORT HIGHLIGHTS
| Aspects | Details |
|---|---|
| Study Period | 2020-2034 |
| Base Year | 2025 |
| Estimated Year | 2026 |
| Forecast Period | 2026-2034 |
| Historical Period | 2020-2025 |
| Growth Rate | CAGR of > 16.50% from 2020-2034 |
| Segmentation |
|
Table of Contents
- 1. Introduction
- 1.1. Research Scope
- 1.2. Market Segmentation
- 1.3. Research Objective
- 1.4. Definitions and Assumptions
- 2. Executive Summary
- 2.1. Market Snapshot
- 3. Market Dynamics
- 3.1. Market Drivers
- 3.2. Market Restrains
- 3.3. Market Trends
- 3.4. Market Opportunities
- 4. Market Factor Analysis
- 4.1. Porters Five Forces
- 4.1.1. Bargaining Power of Suppliers
- 4.1.2. Bargaining Power of Buyers
- 4.1.3. Threat of New Entrants
- 4.1.4. Threat of Substitutes
- 4.1.5. Competitive Rivalry
- 4.2. PESTEL analysis
- 4.3. BCG Analysis
- 4.3.1. Stars (High Growth, High Market Share)
- 4.3.2. Cash Cows (Low Growth, High Market Share)
- 4.3.3. Question Mark (High Growth, Low Market Share)
- 4.3.4. Dogs (Low Growth, Low Market Share)
- 4.4. Ansoff Matrix Analysis
- 4.5. Supply Chain Analysis
- 4.6. Regulatory Landscape
- 4.7. Current Market Potential and Opportunity Assessment (TAM–SAM–SOM Framework)
- 4.8. VDR Analyst Note
- 4.1. Porters Five Forces
- 5. Market Analysis, Insights and Forecast 2021-2033
- 5.1. Market Analysis, Insights and Forecast - by Powder Type
- 5.1.1. Plastic Powder
- 5.1.2. Metal Powder
- 5.1.3. Ceramic Powder
- 5.1.4. Glass Powder
- 5.1.5. Other Types (Composite Powder, etc.)
- 5.2. Market Analysis, Insights and Forecast - by End-user Industry
- 5.2.1. Automotive
- 5.2.2. Aerospace and Defense
- 5.2.3. Medical
- 5.2.4. Architecture
- 5.2.5. Other En
- 5.3. Market Analysis, Insights and Forecast - by Region
- 5.3.1. Asia Pacific
- 5.3.2. North America
- 5.3.3. Europe
- 5.3.4. South America
- 5.3.5. Middle East and Africa
- 5.1. Market Analysis, Insights and Forecast - by Powder Type
- 6. Global 3D Printing Powder Market Analysis, Insights and Forecast, 2021-2033
- 6.1. Market Analysis, Insights and Forecast - by Powder Type
- 6.1.1. Plastic Powder
- 6.1.2. Metal Powder
- 6.1.3. Ceramic Powder
- 6.1.4. Glass Powder
- 6.1.5. Other Types (Composite Powder, etc.)
- 6.2. Market Analysis, Insights and Forecast - by End-user Industry
- 6.2.1. Automotive
- 6.2.2. Aerospace and Defense
- 6.2.3. Medical
- 6.2.4. Architecture
- 6.2.5. Other En
- 6.1. Market Analysis, Insights and Forecast - by Powder Type
- 7. Asia Pacific 3D Printing Powder Market Analysis, Insights and Forecast, 2021-2033
- 7.1. Market Analysis, Insights and Forecast - by Powder Type
- 7.1.1. Plastic Powder
- 7.1.2. Metal Powder
- 7.1.3. Ceramic Powder
- 7.1.4. Glass Powder
- 7.1.5. Other Types (Composite Powder, etc.)
- 7.2. Market Analysis, Insights and Forecast - by End-user Industry
- 7.2.1. Automotive
- 7.2.2. Aerospace and Defense
- 7.2.3. Medical
- 7.2.4. Architecture
- 7.2.5. Other En
- 7.1. Market Analysis, Insights and Forecast - by Powder Type
- 8. North America 3D Printing Powder Market Analysis, Insights and Forecast, 2021-2033
- 8.1. Market Analysis, Insights and Forecast - by Powder Type
- 8.1.1. Plastic Powder
- 8.1.2. Metal Powder
- 8.1.3. Ceramic Powder
- 8.1.4. Glass Powder
- 8.1.5. Other Types (Composite Powder, etc.)
- 8.2. Market Analysis, Insights and Forecast - by End-user Industry
- 8.2.1. Automotive
- 8.2.2. Aerospace and Defense
- 8.2.3. Medical
- 8.2.4. Architecture
- 8.2.5. Other En
- 8.1. Market Analysis, Insights and Forecast - by Powder Type
- 9. Europe 3D Printing Powder Market Analysis, Insights and Forecast, 2021-2033
- 9.1. Market Analysis, Insights and Forecast - by Powder Type
- 9.1.1. Plastic Powder
- 9.1.2. Metal Powder
- 9.1.3. Ceramic Powder
- 9.1.4. Glass Powder
- 9.1.5. Other Types (Composite Powder, etc.)
- 9.2. Market Analysis, Insights and Forecast - by End-user Industry
- 9.2.1. Automotive
- 9.2.2. Aerospace and Defense
- 9.2.3. Medical
- 9.2.4. Architecture
- 9.2.5. Other En
- 9.1. Market Analysis, Insights and Forecast - by Powder Type
- 10. South America 3D Printing Powder Market Analysis, Insights and Forecast, 2021-2033
- 10.1. Market Analysis, Insights and Forecast - by Powder Type
- 10.1.1. Plastic Powder
- 10.1.2. Metal Powder
- 10.1.3. Ceramic Powder
- 10.1.4. Glass Powder
- 10.1.5. Other Types (Composite Powder, etc.)
- 10.2. Market Analysis, Insights and Forecast - by End-user Industry
- 10.2.1. Automotive
- 10.2.2. Aerospace and Defense
- 10.2.3. Medical
- 10.2.4. Architecture
- 10.2.5. Other En
- 10.1. Market Analysis, Insights and Forecast - by Powder Type
- 11. Middle East and Africa 3D Printing Powder Market Analysis, Insights and Forecast, 2021-2033
- 11.1. Market Analysis, Insights and Forecast - by Powder Type
- 11.1.1. Plastic Powder
- 11.1.2. Metal Powder
- 11.1.3. Ceramic Powder
- 11.1.4. Glass Powder
- 11.1.5. Other Types (Composite Powder, etc.)
- 11.2. Market Analysis, Insights and Forecast - by End-user Industry
- 11.2.1. Automotive
- 11.2.2. Aerospace and Defense
- 11.2.3. Medical
- 11.2.4. Architecture
- 11.2.5. Other En
- 11.1. Market Analysis, Insights and Forecast - by Powder Type
- 12. Competitive Analysis
- 12.1. Company Profiles
- 12.1.1 Arkema
- 12.1.1.1. Company Overview
- 12.1.1.2. Products
- 12.1.1.3. Company Financials
- 12.1.1.4. SWOT Analysis
- 12.1.2 Sandvik AB
- 12.1.2.1. Company Overview
- 12.1.2.2. Products
- 12.1.2.3. Company Financials
- 12.1.2.4. SWOT Analysis
- 12.1.3 Höganäs AB
- 12.1.3.1. Company Overview
- 12.1.3.2. Products
- 12.1.3.3. Company Financials
- 12.1.3.4. SWOT Analysis
- 12.1.4 Evonik Industries AG
- 12.1.4.1. Company Overview
- 12.1.4.2. Products
- 12.1.4.3. Company Financials
- 12.1.4.4. SWOT Analysis
- 12.1.5 BASF SE
- 12.1.5.1. Company Overview
- 12.1.5.2. Products
- 12.1.5.3. Company Financials
- 12.1.5.4. SWOT Analysis
- 12.1.6 Metalysis
- 12.1.6.1. Company Overview
- 12.1.6.2. Products
- 12.1.6.3. Company Financials
- 12.1.6.4. SWOT Analysis
- 12.1.7 ERASTEEL
- 12.1.7.1. Company Overview
- 12.1.7.2. Products
- 12.1.7.3. Company Financials
- 12.1.7.4. SWOT Analysis
- 12.1.8 GKN Powder Metallurgy
- 12.1.8.1. Company Overview
- 12.1.8.2. Products
- 12.1.8.3. Company Financials
- 12.1.8.4. SWOT Analysis
- 12.1.9 ExOne
- 12.1.9.1. Company Overview
- 12.1.9.2. Products
- 12.1.9.3. Company Financials
- 12.1.9.4. SWOT Analysis
- 12.1.1 Arkema
- 12.2. Market Entropy
- 12.2.1 Company's Key Areas Served
- 12.2.2 Recent Developments
- 12.3. Company Market Share Analysis 2025
- 12.3.1 Top 5 Companies Market Share Analysis
- 12.3.2 Top 3 Companies Market Share Analysis
- 12.4. List of Potential Customers
- 13. Research Methodology
List of Figures
- Figure 1: Global 3D Printing Powder Market Revenue Breakdown (Million, %) by Region 2025 & 2033
- Figure 2: Global 3D Printing Powder Market Volume Breakdown (K Tons, %) by Region 2025 & 2033
- Figure 3: Asia Pacific 3D Printing Powder Market Revenue (Million), by Powder Type 2025 & 2033
- Figure 4: Asia Pacific 3D Printing Powder Market Volume (K Tons), by Powder Type 2025 & 2033
- Figure 5: Asia Pacific 3D Printing Powder Market Revenue Share (%), by Powder Type 2025 & 2033
- Figure 6: Asia Pacific 3D Printing Powder Market Volume Share (%), by Powder Type 2025 & 2033
- Figure 7: Asia Pacific 3D Printing Powder Market Revenue (Million), by End-user Industry 2025 & 2033
- Figure 8: Asia Pacific 3D Printing Powder Market Volume (K Tons), by End-user Industry 2025 & 2033
- Figure 9: Asia Pacific 3D Printing Powder Market Revenue Share (%), by End-user Industry 2025 & 2033
- Figure 10: Asia Pacific 3D Printing Powder Market Volume Share (%), by End-user Industry 2025 & 2033
- Figure 11: Asia Pacific 3D Printing Powder Market Revenue (Million), by Country 2025 & 2033
- Figure 12: Asia Pacific 3D Printing Powder Market Volume (K Tons), by Country 2025 & 2033
- Figure 13: Asia Pacific 3D Printing Powder Market Revenue Share (%), by Country 2025 & 2033
- Figure 14: Asia Pacific 3D Printing Powder Market Volume Share (%), by Country 2025 & 2033
- Figure 15: North America 3D Printing Powder Market Revenue (Million), by Powder Type 2025 & 2033
- Figure 16: North America 3D Printing Powder Market Volume (K Tons), by Powder Type 2025 & 2033
- Figure 17: North America 3D Printing Powder Market Revenue Share (%), by Powder Type 2025 & 2033
- Figure 18: North America 3D Printing Powder Market Volume Share (%), by Powder Type 2025 & 2033
- Figure 19: North America 3D Printing Powder Market Revenue (Million), by End-user Industry 2025 & 2033
- Figure 20: North America 3D Printing Powder Market Volume (K Tons), by End-user Industry 2025 & 2033
- Figure 21: North America 3D Printing Powder Market Revenue Share (%), by End-user Industry 2025 & 2033
- Figure 22: North America 3D Printing Powder Market Volume Share (%), by End-user Industry 2025 & 2033
- Figure 23: North America 3D Printing Powder Market Revenue (Million), by Country 2025 & 2033
- Figure 24: North America 3D Printing Powder Market Volume (K Tons), by Country 2025 & 2033
- Figure 25: North America 3D Printing Powder Market Revenue Share (%), by Country 2025 & 2033
- Figure 26: North America 3D Printing Powder Market Volume Share (%), by Country 2025 & 2033
- Figure 27: Europe 3D Printing Powder Market Revenue (Million), by Powder Type 2025 & 2033
- Figure 28: Europe 3D Printing Powder Market Volume (K Tons), by Powder Type 2025 & 2033
- Figure 29: Europe 3D Printing Powder Market Revenue Share (%), by Powder Type 2025 & 2033
- Figure 30: Europe 3D Printing Powder Market Volume Share (%), by Powder Type 2025 & 2033
- Figure 31: Europe 3D Printing Powder Market Revenue (Million), by End-user Industry 2025 & 2033
- Figure 32: Europe 3D Printing Powder Market Volume (K Tons), by End-user Industry 2025 & 2033
- Figure 33: Europe 3D Printing Powder Market Revenue Share (%), by End-user Industry 2025 & 2033
- Figure 34: Europe 3D Printing Powder Market Volume Share (%), by End-user Industry 2025 & 2033
- Figure 35: Europe 3D Printing Powder Market Revenue (Million), by Country 2025 & 2033
- Figure 36: Europe 3D Printing Powder Market Volume (K Tons), by Country 2025 & 2033
- Figure 37: Europe 3D Printing Powder Market Revenue Share (%), by Country 2025 & 2033
- Figure 38: Europe 3D Printing Powder Market Volume Share (%), by Country 2025 & 2033
- Figure 39: South America 3D Printing Powder Market Revenue (Million), by Powder Type 2025 & 2033
- Figure 40: South America 3D Printing Powder Market Volume (K Tons), by Powder Type 2025 & 2033
- Figure 41: South America 3D Printing Powder Market Revenue Share (%), by Powder Type 2025 & 2033
- Figure 42: South America 3D Printing Powder Market Volume Share (%), by Powder Type 2025 & 2033
- Figure 43: South America 3D Printing Powder Market Revenue (Million), by End-user Industry 2025 & 2033
- Figure 44: South America 3D Printing Powder Market Volume (K Tons), by End-user Industry 2025 & 2033
- Figure 45: South America 3D Printing Powder Market Revenue Share (%), by End-user Industry 2025 & 2033
- Figure 46: South America 3D Printing Powder Market Volume Share (%), by End-user Industry 2025 & 2033
- Figure 47: South America 3D Printing Powder Market Revenue (Million), by Country 2025 & 2033
- Figure 48: South America 3D Printing Powder Market Volume (K Tons), by Country 2025 & 2033
- Figure 49: South America 3D Printing Powder Market Revenue Share (%), by Country 2025 & 2033
- Figure 50: South America 3D Printing Powder Market Volume Share (%), by Country 2025 & 2033
- Figure 51: Middle East and Africa 3D Printing Powder Market Revenue (Million), by Powder Type 2025 & 2033
- Figure 52: Middle East and Africa 3D Printing Powder Market Volume (K Tons), by Powder Type 2025 & 2033
- Figure 53: Middle East and Africa 3D Printing Powder Market Revenue Share (%), by Powder Type 2025 & 2033
- Figure 54: Middle East and Africa 3D Printing Powder Market Volume Share (%), by Powder Type 2025 & 2033
- Figure 55: Middle East and Africa 3D Printing Powder Market Revenue (Million), by End-user Industry 2025 & 2033
- Figure 56: Middle East and Africa 3D Printing Powder Market Volume (K Tons), by End-user Industry 2025 & 2033
- Figure 57: Middle East and Africa 3D Printing Powder Market Revenue Share (%), by End-user Industry 2025 & 2033
- Figure 58: Middle East and Africa 3D Printing Powder Market Volume Share (%), by End-user Industry 2025 & 2033
- Figure 59: Middle East and Africa 3D Printing Powder Market Revenue (Million), by Country 2025 & 2033
- Figure 60: Middle East and Africa 3D Printing Powder Market Volume (K Tons), by Country 2025 & 2033
- Figure 61: Middle East and Africa 3D Printing Powder Market Revenue Share (%), by Country 2025 & 2033
- Figure 62: Middle East and Africa 3D Printing Powder Market Volume Share (%), by Country 2025 & 2033
List of Tables
- Table 1: Global 3D Printing Powder Market Revenue Million Forecast, by Powder Type 2020 & 2033
- Table 2: Global 3D Printing Powder Market Volume K Tons Forecast, by Powder Type 2020 & 2033
- Table 3: Global 3D Printing Powder Market Revenue Million Forecast, by End-user Industry 2020 & 2033
- Table 4: Global 3D Printing Powder Market Volume K Tons Forecast, by End-user Industry 2020 & 2033
- Table 5: Global 3D Printing Powder Market Revenue Million Forecast, by Region 2020 & 2033
- Table 6: Global 3D Printing Powder Market Volume K Tons Forecast, by Region 2020 & 2033
- Table 7: Global 3D Printing Powder Market Revenue Million Forecast, by Powder Type 2020 & 2033
- Table 8: Global 3D Printing Powder Market Volume K Tons Forecast, by Powder Type 2020 & 2033
- Table 9: Global 3D Printing Powder Market Revenue Million Forecast, by End-user Industry 2020 & 2033
- Table 10: Global 3D Printing Powder Market Volume K Tons Forecast, by End-user Industry 2020 & 2033
- Table 11: Global 3D Printing Powder Market Revenue Million Forecast, by Country 2020 & 2033
- Table 12: Global 3D Printing Powder Market Volume K Tons Forecast, by Country 2020 & 2033
- Table 13: China 3D Printing Powder Market Revenue (Million) Forecast, by Application 2020 & 2033
- Table 14: China 3D Printing Powder Market Volume (K Tons) Forecast, by Application 2020 & 2033
- Table 15: India 3D Printing Powder Market Revenue (Million) Forecast, by Application 2020 & 2033
- Table 16: India 3D Printing Powder Market Volume (K Tons) Forecast, by Application 2020 & 2033
- Table 17: Japan 3D Printing Powder Market Revenue (Million) Forecast, by Application 2020 & 2033
- Table 18: Japan 3D Printing Powder Market Volume (K Tons) Forecast, by Application 2020 & 2033
- Table 19: South Korea 3D Printing Powder Market Revenue (Million) Forecast, by Application 2020 & 2033
- Table 20: South Korea 3D Printing Powder Market Volume (K Tons) Forecast, by Application 2020 & 2033
- Table 21: Rest of Asia Pacific 3D Printing Powder Market Revenue (Million) Forecast, by Application 2020 & 2033
- Table 22: Rest of Asia Pacific 3D Printing Powder Market Volume (K Tons) Forecast, by Application 2020 & 2033
- Table 23: Global 3D Printing Powder Market Revenue Million Forecast, by Powder Type 2020 & 2033
- Table 24: Global 3D Printing Powder Market Volume K Tons Forecast, by Powder Type 2020 & 2033
- Table 25: Global 3D Printing Powder Market Revenue Million Forecast, by End-user Industry 2020 & 2033
- Table 26: Global 3D Printing Powder Market Volume K Tons Forecast, by End-user Industry 2020 & 2033
- Table 27: Global 3D Printing Powder Market Revenue Million Forecast, by Country 2020 & 2033
- Table 28: Global 3D Printing Powder Market Volume K Tons Forecast, by Country 2020 & 2033
- Table 29: United States 3D Printing Powder Market Revenue (Million) Forecast, by Application 2020 & 2033
- Table 30: United States 3D Printing Powder Market Volume (K Tons) Forecast, by Application 2020 & 2033
- Table 31: Canada 3D Printing Powder Market Revenue (Million) Forecast, by Application 2020 & 2033
- Table 32: Canada 3D Printing Powder Market Volume (K Tons) Forecast, by Application 2020 & 2033
- Table 33: Mexico 3D Printing Powder Market Revenue (Million) Forecast, by Application 2020 & 2033
- Table 34: Mexico 3D Printing Powder Market Volume (K Tons) Forecast, by Application 2020 & 2033
- Table 35: Global 3D Printing Powder Market Revenue Million Forecast, by Powder Type 2020 & 2033
- Table 36: Global 3D Printing Powder Market Volume K Tons Forecast, by Powder Type 2020 & 2033
- Table 37: Global 3D Printing Powder Market Revenue Million Forecast, by End-user Industry 2020 & 2033
- Table 38: Global 3D Printing Powder Market Volume K Tons Forecast, by End-user Industry 2020 & 2033
- Table 39: Global 3D Printing Powder Market Revenue Million Forecast, by Country 2020 & 2033
- Table 40: Global 3D Printing Powder Market Volume K Tons Forecast, by Country 2020 & 2033
- Table 41: Germany 3D Printing Powder Market Revenue (Million) Forecast, by Application 2020 & 2033
- Table 42: Germany 3D Printing Powder Market Volume (K Tons) Forecast, by Application 2020 & 2033
- Table 43: United Kingdom 3D Printing Powder Market Revenue (Million) Forecast, by Application 2020 & 2033
- Table 44: United Kingdom 3D Printing Powder Market Volume (K Tons) Forecast, by Application 2020 & 2033
- Table 45: France 3D Printing Powder Market Revenue (Million) Forecast, by Application 2020 & 2033
- Table 46: France 3D Printing Powder Market Volume (K Tons) Forecast, by Application 2020 & 2033
- Table 47: Italy 3D Printing Powder Market Revenue (Million) Forecast, by Application 2020 & 2033
- Table 48: Italy 3D Printing Powder Market Volume (K Tons) Forecast, by Application 2020 & 2033
- Table 49: Rest of Europe 3D Printing Powder Market Revenue (Million) Forecast, by Application 2020 & 2033
- Table 50: Rest of Europe 3D Printing Powder Market Volume (K Tons) Forecast, by Application 2020 & 2033
- Table 51: Global 3D Printing Powder Market Revenue Million Forecast, by Powder Type 2020 & 2033
- Table 52: Global 3D Printing Powder Market Volume K Tons Forecast, by Powder Type 2020 & 2033
- Table 53: Global 3D Printing Powder Market Revenue Million Forecast, by End-user Industry 2020 & 2033
- Table 54: Global 3D Printing Powder Market Volume K Tons Forecast, by End-user Industry 2020 & 2033
- Table 55: Global 3D Printing Powder Market Revenue Million Forecast, by Country 2020 & 2033
- Table 56: Global 3D Printing Powder Market Volume K Tons Forecast, by Country 2020 & 2033
- Table 57: Brazil 3D Printing Powder Market Revenue (Million) Forecast, by Application 2020 & 2033
- Table 58: Brazil 3D Printing Powder Market Volume (K Tons) Forecast, by Application 2020 & 2033
- Table 59: Argentina 3D Printing Powder Market Revenue (Million) Forecast, by Application 2020 & 2033
- Table 60: Argentina 3D Printing Powder Market Volume (K Tons) Forecast, by Application 2020 & 2033
- Table 61: Rest of South America 3D Printing Powder Market Revenue (Million) Forecast, by Application 2020 & 2033
- Table 62: Rest of South America 3D Printing Powder Market Volume (K Tons) Forecast, by Application 2020 & 2033
- Table 63: Global 3D Printing Powder Market Revenue Million Forecast, by Powder Type 2020 & 2033
- Table 64: Global 3D Printing Powder Market Volume K Tons Forecast, by Powder Type 2020 & 2033
- Table 65: Global 3D Printing Powder Market Revenue Million Forecast, by End-user Industry 2020 & 2033
- Table 66: Global 3D Printing Powder Market Volume K Tons Forecast, by End-user Industry 2020 & 2033
- Table 67: Global 3D Printing Powder Market Revenue Million Forecast, by Country 2020 & 2033
- Table 68: Global 3D Printing Powder Market Volume K Tons Forecast, by Country 2020 & 2033
- Table 69: Saudi Arabia 3D Printing Powder Market Revenue (Million) Forecast, by Application 2020 & 2033
- Table 70: Saudi Arabia 3D Printing Powder Market Volume (K Tons) Forecast, by Application 2020 & 2033
- Table 71: South Africa 3D Printing Powder Market Revenue (Million) Forecast, by Application 2020 & 2033
- Table 72: South Africa 3D Printing Powder Market Volume (K Tons) Forecast, by Application 2020 & 2033
- Table 73: Rest of Middle East and Africa 3D Printing Powder Market Revenue (Million) Forecast, by Application 2020 & 2033
- Table 74: Rest of Middle East and Africa 3D Printing Powder Market Volume (K Tons) Forecast, by Application 2020 & 2033
Frequently Asked Questions
1. What is the projected Compound Annual Growth Rate (CAGR) of the 3D Printing Powder Market?
The projected CAGR is approximately > 16.50%.
2. Which companies are prominent players in the 3D Printing Powder Market?
Key companies in the market include Arkema, Sandvik AB, Höganäs AB, Evonik Industries AG, BASF SE, Metalysis, ERASTEEL, GKN Powder Metallurgy, ExOne.
3. What are the main segments of the 3D Printing Powder Market?
The market segments include Powder Type, End-user Industry.
4. Can you provide details about the market size?
The market size is estimated to be USD 2.06 Million as of 2022.
5. What are some drivers contributing to market growth?
Increasing Applications in Aerospace and Automobile Industries; Growing Demand from Medical Sector; Other Drivers.
6. What are the notable trends driving market growth?
Growing Demand from Automobile Sector.
7. Are there any restraints impacting market growth?
HIgh Material and Post Processing Cost; Hazardous in Nature.
8. Can you provide examples of recent developments in the market?
N/A
9. What pricing options are available for accessing the report?
Pricing options include single-user, multi-user, and enterprise licenses priced at USD 4750, USD 5250, and USD 8750 respectively.
10. Is the market size provided in terms of value or volume?
The market size is provided in terms of value, measured in Million and volume, measured in K Tons.
11. Are there any specific market keywords associated with the report?
Yes, the market keyword associated with the report is "3D Printing Powder Market," which aids in identifying and referencing the specific market segment covered.
12. How do I determine which pricing option suits my needs best?
The pricing options vary based on user requirements and access needs. Individual users may opt for single-user licenses, while businesses requiring broader access may choose multi-user or enterprise licenses for cost-effective access to the report.
13. Are there any additional resources or data provided in the 3D Printing Powder Market report?
While the report offers comprehensive insights, it's advisable to review the specific contents or supplementary materials provided to ascertain if additional resources or data are available.
14. How can I stay updated on further developments or reports in the 3D Printing Powder Market?
To stay informed about further developments, trends, and reports in the 3D Printing Powder Market, consider subscribing to industry newsletters, following relevant companies and organizations, or regularly checking reputable industry news sources and publications.
Methodology
Step 1 - Identification of Relevant Samples Size from Population Database


Step 2 - Approaches for Defining Global Market Size (Value, Volume* & Price*)

Note*: In applicable scenarios
Step 3 - Data Sources
Primary Research
- Web Analytics
- Survey Reports
- Research Institute
- Latest Research Reports
- Opinion Leaders
Secondary Research
- Annual Reports
- White Paper
- Latest Press Release
- Industry Association
- Paid Database
- Investor Presentations

Step 4 - Data Triangulation
Involves using different sources of information in order to increase the validity of a study
These sources are likely to be stakeholders in a program - participants, other researchers, program staff, other community members, and so on.
Then we put all data in single framework & apply various statistical tools to find out the dynamic on the market.
During the analysis stage, feedback from the stakeholder groups would be compared to determine areas of agreement as well as areas of divergence