
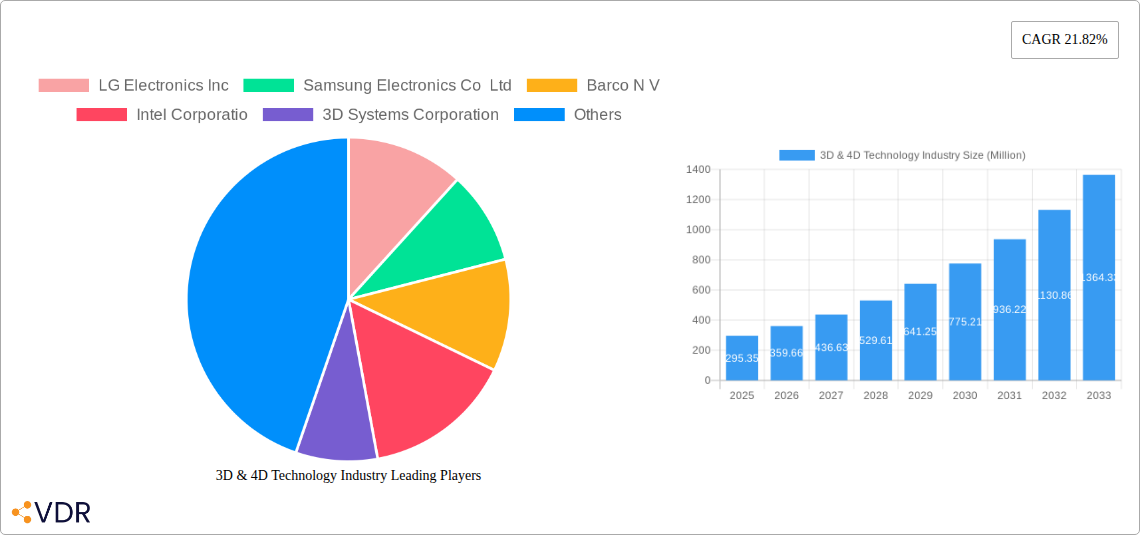
Key Insights
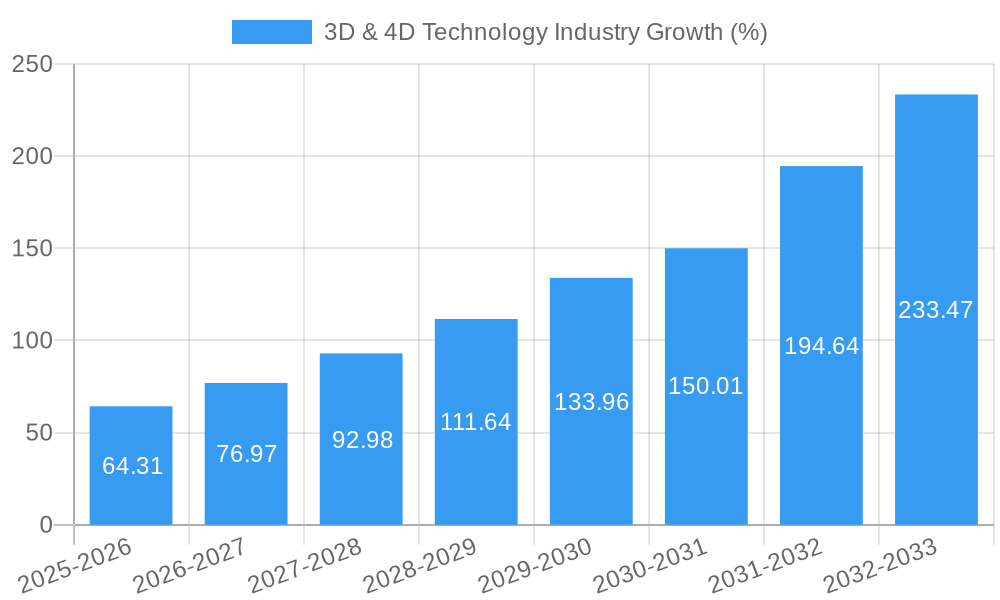
The 3D & 4D technology market is experiencing explosive growth, projected to reach a market size of $295.35 million in 2025 and exhibiting a remarkable Compound Annual Growth Rate (CAGR) of 21.82%. This expansion is fueled by several key drivers. Advancements in sensor technology, particularly 3D sensors, are enabling more precise and affordable 3D imaging solutions across diverse sectors. The increasing adoption of 3D printing in manufacturing, healthcare (prosthetics, surgical planning), and consumer goods is a significant contributor. Furthermore, the burgeoning entertainment and media industries, driven by immersive gaming experiences and advancements in 3D/4D filmmaking, are substantially boosting market demand. The integration of 3D technologies into educational tools and simulations further expands the market's reach. While data limitations prevent a precise breakdown of individual segment contributions, it's evident that 3D sensors and 3D integrated circuits likely constitute the largest portions of the product segment due to their widespread applications. Similarly, the healthcare and entertainment & media sectors probably dominate the end-user segment given the previously mentioned growth drivers.
Despite this impressive growth trajectory, the market faces certain restraints. High initial investment costs for 3D printing equipment and the sophisticated software needed for 3D modeling can be barriers to entry for some businesses and individuals. Furthermore, the complexities involved in developing and implementing advanced 3D and 4D solutions, combined with the need for skilled professionals, can hinder widespread adoption in certain regions. Despite these challenges, the long-term outlook for the 3D & 4D technology market remains exceptionally positive. Continued technological innovations, decreasing costs, and expanding applications across diverse sectors point towards sustained, robust growth throughout the forecast period (2025-2033), with potential for even higher CAGRs in specific niche markets. Key players like LG Electronics, Samsung, and Intel are strategically positioning themselves to capitalize on this burgeoning market opportunity.
3D & 4D Technology Industry Market Report: 2019-2033
This comprehensive report provides an in-depth analysis of the 3D & 4D technology market, encompassing market dynamics, growth trends, regional dominance, product landscape, key players, and future outlook. The study period covers 2019-2033, with 2025 as the base and estimated year. The report offers crucial insights for industry professionals, investors, and strategists seeking to navigate this rapidly evolving sector. Market values are presented in million units.
3D & 4D Technology Industry Market Dynamics & Structure
The 3D & 4D technology market is characterized by a moderately concentrated landscape, with key players like LG Electronics, Samsung, and 3D Systems holding significant market share (xx%). Technological innovation, particularly in 3D printing and 3D sensor technologies, is a primary growth driver. Regulatory frameworks, varying across regions, influence adoption rates and market access. Competitive substitutes, such as traditional manufacturing methods, pose ongoing challenges. End-user demographics are expanding, with increasing adoption across healthcare, entertainment, and education. M&A activity (xx deals in the last 5 years) is shaping market consolidation.
- Market Concentration: Moderately concentrated, with top 5 players holding xx% market share in 2025.
- Technological Innovation: Rapid advancements in 3D printing, 3D sensors, and integrated circuits.
- Regulatory Frameworks: Varying regulations across regions impact market access and adoption.
- Competitive Substitutes: Traditional manufacturing methods pose a competitive challenge.
- End-User Demographics: Expanding adoption across diverse sectors like healthcare and entertainment.
- M&A Trends: Significant M&A activity driving market consolidation, with xx deals projected for 2026-2028.
- Innovation Barriers: High R&D costs and complexities in integrating 3D/4D technologies into existing systems.
3D & 4D Technology Industry Growth Trends & Insights
The 3D & 4D technology market exhibited strong growth during the historical period (2019-2024), registering a CAGR of xx%. This growth is projected to continue through the forecast period (2025-2033), with a projected CAGR of xx%, driven by increasing demand from diverse end-user industries and technological advancements. Adoption rates are rising, particularly in sectors like healthcare and entertainment, fueled by the unique capabilities of 3D/4D technologies in areas like personalized medicine and immersive entertainment experiences. Market penetration is expected to reach xx% by 2033. Technological disruptions, like the rise of 4D printing and advanced 3D imaging techniques, are further accelerating market growth. Consumer behavior shifts towards personalized products and experiences contribute significantly to market expansion. The market size is projected to reach xx million units by 2033.
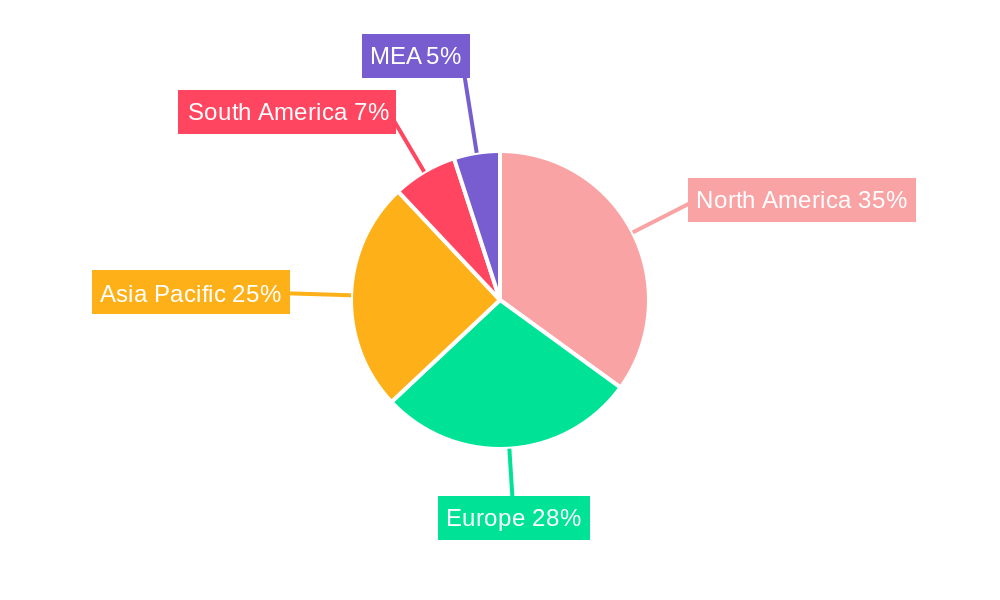
Dominant Regions, Countries, or Segments in 3D & 4D Technology Industry
North America currently dominates the 3D & 4D technology market, accounting for xx% of the global market share in 2025, followed by Europe and Asia-Pacific. Within product segments, the 3D printer market holds the largest share (xx%), driven by increasing adoption in manufacturing and design. In end-user industries, Healthcare leads with a xx% market share, followed by the Entertainment & Media sector.
- Leading Region: North America (xx% market share in 2025).
- Leading Product Segment: 3D Printers (xx% market share in 2025).
- Leading End-User Industry: Healthcare (xx% market share in 2025).
- Key Drivers: Strong technological infrastructure, substantial R&D investments, supportive government policies, and the presence of major players.
- Growth Potential: Asia-Pacific shows significant growth potential due to rising investments and technological advancements.
3D & 4D Technology Industry Product Landscape
The 3D & 4D technology product landscape is constantly evolving, with advancements in 3D sensors offering higher resolution and accuracy, 3D integrated circuits enabling miniaturization and enhanced performance, and 3D printers delivering improved speed and material versatility. The unique selling propositions of these products lie in their ability to deliver personalized solutions, increase efficiency, and enhance user experiences. The integration of artificial intelligence and machine learning is further enhancing the capabilities of 3D & 4D technologies.
Key Drivers, Barriers & Challenges in 3D & 4D Technology Industry
Key Drivers: Increased demand for personalized products, technological advancements like AI-powered 3D printing, growing investments in R&D, supportive government policies promoting technological adoption in key sectors.
Key Challenges: High initial investment costs for equipment and software, skilled labor shortages, complexities in integrating 3D/4D technologies into existing workflows, stringent regulatory requirements in certain sectors, and the potential for supply chain disruptions. Supply chain issues have impacted the industry significantly, resulting in an estimated xx% increase in production costs in 2022.
Emerging Opportunities in 3D & 4D Technology Industry
Untapped markets in developing economies present significant opportunities. Innovative applications in personalized medicine, advanced manufacturing, and construction are emerging. Growing consumer demand for customized products and experiences creates avenues for market expansion. The integration of 3D/4D technologies with IoT (Internet of Things) devices is anticipated to open up new possibilities.
Growth Accelerators in the 3D & 4D Technology Industry
Technological breakthroughs, especially in materials science and software development, are key accelerators. Strategic partnerships between technology companies and end-user industries drive wider adoption. Government initiatives promoting digital manufacturing and innovation foster market expansion. Increased investments in research and development are further propelling market growth.
Key Players Shaping the 3D & 4D Technology Market
- LG Electronics Inc
- Samsung Electronics Co Ltd
- Barco N V
- Intel Corporation
- 3D Systems Corporation
- Autodesk Inc
- Stratus's Inc
- Dolby Laboratories Inc
- Panasonic Corporation
- Sony Corporation
Notable Milestones in 3D & 4D Technology Industry Sector
- June 2023: Epic Games and LVMH partnered to leverage 3D and virtual experiences for product discovery, creating virtual fitting rooms and augmented reality applications.
- May 2023: Formlabs and Hawk Ridge Systems partnered to expand access to digital manufacturing technologies in North America, accelerating adoption among manufacturers.
In-Depth 3D & 4D Technology Industry Market Outlook
The future of the 3D & 4D technology market is promising, with continued growth driven by technological advancements, expanding applications, and increased investments. Strategic partnerships and collaborations are expected to play a crucial role in shaping market dynamics. The market is poised for significant expansion in diverse sectors, offering substantial opportunities for innovation and growth. The focus will shift towards sustainable and environmentally friendly 3D printing technologies, driving further market expansion.
3D & 4D Technology Industry Segmentation
-
1. Products
- 1.1. 3D Sensors
- 1.2. 3D Integrated Circuits
- 1.3. 3D Transistors
- 1.4. 3D Printer
- 1.5. 3D Gaming
- 1.6. Other Products
-
2. End-User Industry
- 2.1. Healthcare
- 2.2. Entertainment & Media
- 2.3. Education
- 2.4. Other End-user Industries
3D & 4D Technology Industry Segmentation By Geography
- 1. North America
- 2. Europe
- 3. Asia
- 4. Australia and New Zealand
- 5. Latin America
- 6. Middle East and Africa
3D & 4D Technology Industry REPORT HIGHLIGHTS
| Aspects | Details |
|---|---|
| Study Period | 2019-2033 |
| Base Year | 2024 |
| Estimated Year | 2025 |
| Forecast Period | 2025-2033 |
| Historical Period | 2019-2024 |
| Growth Rate | CAGR of 21.82% from 2019-2033 |
| Segmentation |
|
Table of Contents
- 1. Introduction
- 1.1. Research Scope
- 1.2. Market Segmentation
- 1.3. Research Methodology
- 1.4. Definitions and Assumptions
- 2. Executive Summary
- 2.1. Introduction
- 3. Market Dynamics
- 3.1. Introduction
- 3.2. Market Drivers
- 3.2.1. Increasing Applications of 3D Technology Across Various End-User Industries; Increasing Demand for 3D Technology in the Entertainment Industry; Increased Investment in R&D to Drive Development of Cost-Effective 3D Technology
- 3.3. Market Restrains
- 3.3.1. High Product Associated Costs and Availability of 3D Printing Materials
- 3.4. Market Trends
- 3.4.1. Increasing Applications of 3D Printing Across Various End-user Industries
- 4. Market Factor Analysis
- 4.1. Porters Five Forces
- 4.2. Supply/Value Chain
- 4.3. PESTEL analysis
- 4.4. Market Entropy
- 4.5. Patent/Trademark Analysis
- 5. Global 3D & 4D Technology Industry Analysis, Insights and Forecast, 2019-2031
- 5.1. Market Analysis, Insights and Forecast - by Products
- 5.1.1. 3D Sensors
- 5.1.2. 3D Integrated Circuits
- 5.1.3. 3D Transistors
- 5.1.4. 3D Printer
- 5.1.5. 3D Gaming
- 5.1.6. Other Products
- 5.2. Market Analysis, Insights and Forecast - by End-User Industry
- 5.2.1. Healthcare
- 5.2.2. Entertainment & Media
- 5.2.3. Education
- 5.2.4. Other End-user Industries
- 5.3. Market Analysis, Insights and Forecast - by Region
- 5.3.1. North America
- 5.3.2. Europe
- 5.3.3. Asia
- 5.3.4. Australia and New Zealand
- 5.3.5. Latin America
- 5.3.6. Middle East and Africa
- 5.1. Market Analysis, Insights and Forecast - by Products
- 6. North America 3D & 4D Technology Industry Analysis, Insights and Forecast, 2019-2031
- 6.1. Market Analysis, Insights and Forecast - by Products
- 6.1.1. 3D Sensors
- 6.1.2. 3D Integrated Circuits
- 6.1.3. 3D Transistors
- 6.1.4. 3D Printer
- 6.1.5. 3D Gaming
- 6.1.6. Other Products
- 6.2. Market Analysis, Insights and Forecast - by End-User Industry
- 6.2.1. Healthcare
- 6.2.2. Entertainment & Media
- 6.2.3. Education
- 6.2.4. Other End-user Industries
- 6.1. Market Analysis, Insights and Forecast - by Products
- 7. Europe 3D & 4D Technology Industry Analysis, Insights and Forecast, 2019-2031
- 7.1. Market Analysis, Insights and Forecast - by Products
- 7.1.1. 3D Sensors
- 7.1.2. 3D Integrated Circuits
- 7.1.3. 3D Transistors
- 7.1.4. 3D Printer
- 7.1.5. 3D Gaming
- 7.1.6. Other Products
- 7.2. Market Analysis, Insights and Forecast - by End-User Industry
- 7.2.1. Healthcare
- 7.2.2. Entertainment & Media
- 7.2.3. Education
- 7.2.4. Other End-user Industries
- 7.1. Market Analysis, Insights and Forecast - by Products
- 8. Asia 3D & 4D Technology Industry Analysis, Insights and Forecast, 2019-2031
- 8.1. Market Analysis, Insights and Forecast - by Products
- 8.1.1. 3D Sensors
- 8.1.2. 3D Integrated Circuits
- 8.1.3. 3D Transistors
- 8.1.4. 3D Printer
- 8.1.5. 3D Gaming
- 8.1.6. Other Products
- 8.2. Market Analysis, Insights and Forecast - by End-User Industry
- 8.2.1. Healthcare
- 8.2.2. Entertainment & Media
- 8.2.3. Education
- 8.2.4. Other End-user Industries
- 8.1. Market Analysis, Insights and Forecast - by Products
- 9. Australia and New Zealand 3D & 4D Technology Industry Analysis, Insights and Forecast, 2019-2031
- 9.1. Market Analysis, Insights and Forecast - by Products
- 9.1.1. 3D Sensors
- 9.1.2. 3D Integrated Circuits
- 9.1.3. 3D Transistors
- 9.1.4. 3D Printer
- 9.1.5. 3D Gaming
- 9.1.6. Other Products
- 9.2. Market Analysis, Insights and Forecast - by End-User Industry
- 9.2.1. Healthcare
- 9.2.2. Entertainment & Media
- 9.2.3. Education
- 9.2.4. Other End-user Industries
- 9.1. Market Analysis, Insights and Forecast - by Products
- 10. Latin America 3D & 4D Technology Industry Analysis, Insights and Forecast, 2019-2031
- 10.1. Market Analysis, Insights and Forecast - by Products
- 10.1.1. 3D Sensors
- 10.1.2. 3D Integrated Circuits
- 10.1.3. 3D Transistors
- 10.1.4. 3D Printer
- 10.1.5. 3D Gaming
- 10.1.6. Other Products
- 10.2. Market Analysis, Insights and Forecast - by End-User Industry
- 10.2.1. Healthcare
- 10.2.2. Entertainment & Media
- 10.2.3. Education
- 10.2.4. Other End-user Industries
- 10.1. Market Analysis, Insights and Forecast - by Products
- 11. Middle East and Africa 3D & 4D Technology Industry Analysis, Insights and Forecast, 2019-2031
- 11.1. Market Analysis, Insights and Forecast - by Products
- 11.1.1. 3D Sensors
- 11.1.2. 3D Integrated Circuits
- 11.1.3. 3D Transistors
- 11.1.4. 3D Printer
- 11.1.5. 3D Gaming
- 11.1.6. Other Products
- 11.2. Market Analysis, Insights and Forecast - by End-User Industry
- 11.2.1. Healthcare
- 11.2.2. Entertainment & Media
- 11.2.3. Education
- 11.2.4. Other End-user Industries
- 11.1. Market Analysis, Insights and Forecast - by Products
- 12. North America 3D & 4D Technology Industry Analysis, Insights and Forecast, 2019-2031
- 12.1. Market Analysis, Insights and Forecast - By Country/Sub-region
- 12.1.1 United States
- 12.1.2 Canada
- 12.1.3 Mexico
- 13. Europe 3D & 4D Technology Industry Analysis, Insights and Forecast, 2019-2031
- 13.1. Market Analysis, Insights and Forecast - By Country/Sub-region
- 13.1.1 Germany
- 13.1.2 United Kingdom
- 13.1.3 France
- 13.1.4 Spain
- 13.1.5 Italy
- 13.1.6 Spain
- 13.1.7 Belgium
- 13.1.8 Netherland
- 13.1.9 Nordics
- 13.1.10 Rest of Europe
- 14. Asia Pacific 3D & 4D Technology Industry Analysis, Insights and Forecast, 2019-2031
- 14.1. Market Analysis, Insights and Forecast - By Country/Sub-region
- 14.1.1 China
- 14.1.2 Japan
- 14.1.3 India
- 14.1.4 South Korea
- 14.1.5 Southeast Asia
- 14.1.6 Australia
- 14.1.7 Indonesia
- 14.1.8 Phillipes
- 14.1.9 Singapore
- 14.1.10 Thailandc
- 14.1.11 Rest of Asia Pacific
- 15. South America 3D & 4D Technology Industry Analysis, Insights and Forecast, 2019-2031
- 15.1. Market Analysis, Insights and Forecast - By Country/Sub-region
- 15.1.1 Brazil
- 15.1.2 Argentina
- 15.1.3 Peru
- 15.1.4 Chile
- 15.1.5 Colombia
- 15.1.6 Ecuador
- 15.1.7 Venezuela
- 15.1.8 Rest of South America
- 16. North America 3D & 4D Technology Industry Analysis, Insights and Forecast, 2019-2031
- 16.1. Market Analysis, Insights and Forecast - By Country/Sub-region
- 16.1.1 United States
- 16.1.2 Canada
- 16.1.3 Mexico
- 17. MEA 3D & 4D Technology Industry Analysis, Insights and Forecast, 2019-2031
- 17.1. Market Analysis, Insights and Forecast - By Country/Sub-region
- 17.1.1 United Arab Emirates
- 17.1.2 Saudi Arabia
- 17.1.3 South Africa
- 17.1.4 Rest of Middle East and Africa
- 18. Competitive Analysis
- 18.1. Global Market Share Analysis 2024
- 18.2. Company Profiles
- 18.2.1 LG Electronics Inc
- 18.2.1.1. Overview
- 18.2.1.2. Products
- 18.2.1.3. SWOT Analysis
- 18.2.1.4. Recent Developments
- 18.2.1.5. Financials (Based on Availability)
- 18.2.2 Samsung Electronics Co Ltd
- 18.2.2.1. Overview
- 18.2.2.2. Products
- 18.2.2.3. SWOT Analysis
- 18.2.2.4. Recent Developments
- 18.2.2.5. Financials (Based on Availability)
- 18.2.3 Barco N V
- 18.2.3.1. Overview
- 18.2.3.2. Products
- 18.2.3.3. SWOT Analysis
- 18.2.3.4. Recent Developments
- 18.2.3.5. Financials (Based on Availability)
- 18.2.4 Intel Corporatio
- 18.2.4.1. Overview
- 18.2.4.2. Products
- 18.2.4.3. SWOT Analysis
- 18.2.4.4. Recent Developments
- 18.2.4.5. Financials (Based on Availability)
- 18.2.5 3D Systems Corporation
- 18.2.5.1. Overview
- 18.2.5.2. Products
- 18.2.5.3. SWOT Analysis
- 18.2.5.4. Recent Developments
- 18.2.5.5. Financials (Based on Availability)
- 18.2.6 Autodesk Inc
- 18.2.6.1. Overview
- 18.2.6.2. Products
- 18.2.6.3. SWOT Analysis
- 18.2.6.4. Recent Developments
- 18.2.6.5. Financials (Based on Availability)
- 18.2.7 Stratus's Inc
- 18.2.7.1. Overview
- 18.2.7.2. Products
- 18.2.7.3. SWOT Analysis
- 18.2.7.4. Recent Developments
- 18.2.7.5. Financials (Based on Availability)
- 18.2.8 Dolby Laboratories Inc
- 18.2.8.1. Overview
- 18.2.8.2. Products
- 18.2.8.3. SWOT Analysis
- 18.2.8.4. Recent Developments
- 18.2.8.5. Financials (Based on Availability)
- 18.2.9 Panasonic Corporation
- 18.2.9.1. Overview
- 18.2.9.2. Products
- 18.2.9.3. SWOT Analysis
- 18.2.9.4. Recent Developments
- 18.2.9.5. Financials (Based on Availability)
- 18.2.10 Sony Corporation
- 18.2.10.1. Overview
- 18.2.10.2. Products
- 18.2.10.3. SWOT Analysis
- 18.2.10.4. Recent Developments
- 18.2.10.5. Financials (Based on Availability)
- 18.2.1 LG Electronics Inc
List of Figures
- Figure 1: Global 3D & 4D Technology Industry Revenue Breakdown (Million, %) by Region 2024 & 2032
- Figure 2: North America 3D & 4D Technology Industry Revenue (Million), by Country 2024 & 2032
- Figure 3: North America 3D & 4D Technology Industry Revenue Share (%), by Country 2024 & 2032
- Figure 4: Europe 3D & 4D Technology Industry Revenue (Million), by Country 2024 & 2032
- Figure 5: Europe 3D & 4D Technology Industry Revenue Share (%), by Country 2024 & 2032
- Figure 6: Asia Pacific 3D & 4D Technology Industry Revenue (Million), by Country 2024 & 2032
- Figure 7: Asia Pacific 3D & 4D Technology Industry Revenue Share (%), by Country 2024 & 2032
- Figure 8: South America 3D & 4D Technology Industry Revenue (Million), by Country 2024 & 2032
- Figure 9: South America 3D & 4D Technology Industry Revenue Share (%), by Country 2024 & 2032
- Figure 10: North America 3D & 4D Technology Industry Revenue (Million), by Country 2024 & 2032
- Figure 11: North America 3D & 4D Technology Industry Revenue Share (%), by Country 2024 & 2032
- Figure 12: MEA 3D & 4D Technology Industry Revenue (Million), by Country 2024 & 2032
- Figure 13: MEA 3D & 4D Technology Industry Revenue Share (%), by Country 2024 & 2032
- Figure 14: North America 3D & 4D Technology Industry Revenue (Million), by Products 2024 & 2032
- Figure 15: North America 3D & 4D Technology Industry Revenue Share (%), by Products 2024 & 2032
- Figure 16: North America 3D & 4D Technology Industry Revenue (Million), by End-User Industry 2024 & 2032
- Figure 17: North America 3D & 4D Technology Industry Revenue Share (%), by End-User Industry 2024 & 2032
- Figure 18: North America 3D & 4D Technology Industry Revenue (Million), by Country 2024 & 2032
- Figure 19: North America 3D & 4D Technology Industry Revenue Share (%), by Country 2024 & 2032
- Figure 20: Europe 3D & 4D Technology Industry Revenue (Million), by Products 2024 & 2032
- Figure 21: Europe 3D & 4D Technology Industry Revenue Share (%), by Products 2024 & 2032
- Figure 22: Europe 3D & 4D Technology Industry Revenue (Million), by End-User Industry 2024 & 2032
- Figure 23: Europe 3D & 4D Technology Industry Revenue Share (%), by End-User Industry 2024 & 2032
- Figure 24: Europe 3D & 4D Technology Industry Revenue (Million), by Country 2024 & 2032
- Figure 25: Europe 3D & 4D Technology Industry Revenue Share (%), by Country 2024 & 2032
- Figure 26: Asia 3D & 4D Technology Industry Revenue (Million), by Products 2024 & 2032
- Figure 27: Asia 3D & 4D Technology Industry Revenue Share (%), by Products 2024 & 2032
- Figure 28: Asia 3D & 4D Technology Industry Revenue (Million), by End-User Industry 2024 & 2032
- Figure 29: Asia 3D & 4D Technology Industry Revenue Share (%), by End-User Industry 2024 & 2032
- Figure 30: Asia 3D & 4D Technology Industry Revenue (Million), by Country 2024 & 2032
- Figure 31: Asia 3D & 4D Technology Industry Revenue Share (%), by Country 2024 & 2032
- Figure 32: Australia and New Zealand 3D & 4D Technology Industry Revenue (Million), by Products 2024 & 2032
- Figure 33: Australia and New Zealand 3D & 4D Technology Industry Revenue Share (%), by Products 2024 & 2032
- Figure 34: Australia and New Zealand 3D & 4D Technology Industry Revenue (Million), by End-User Industry 2024 & 2032
- Figure 35: Australia and New Zealand 3D & 4D Technology Industry Revenue Share (%), by End-User Industry 2024 & 2032
- Figure 36: Australia and New Zealand 3D & 4D Technology Industry Revenue (Million), by Country 2024 & 2032
- Figure 37: Australia and New Zealand 3D & 4D Technology Industry Revenue Share (%), by Country 2024 & 2032
- Figure 38: Latin America 3D & 4D Technology Industry Revenue (Million), by Products 2024 & 2032
- Figure 39: Latin America 3D & 4D Technology Industry Revenue Share (%), by Products 2024 & 2032
- Figure 40: Latin America 3D & 4D Technology Industry Revenue (Million), by End-User Industry 2024 & 2032
- Figure 41: Latin America 3D & 4D Technology Industry Revenue Share (%), by End-User Industry 2024 & 2032
- Figure 42: Latin America 3D & 4D Technology Industry Revenue (Million), by Country 2024 & 2032
- Figure 43: Latin America 3D & 4D Technology Industry Revenue Share (%), by Country 2024 & 2032
- Figure 44: Middle East and Africa 3D & 4D Technology Industry Revenue (Million), by Products 2024 & 2032
- Figure 45: Middle East and Africa 3D & 4D Technology Industry Revenue Share (%), by Products 2024 & 2032
- Figure 46: Middle East and Africa 3D & 4D Technology Industry Revenue (Million), by End-User Industry 2024 & 2032
- Figure 47: Middle East and Africa 3D & 4D Technology Industry Revenue Share (%), by End-User Industry 2024 & 2032
- Figure 48: Middle East and Africa 3D & 4D Technology Industry Revenue (Million), by Country 2024 & 2032
- Figure 49: Middle East and Africa 3D & 4D Technology Industry Revenue Share (%), by Country 2024 & 2032
List of Tables
- Table 1: Global 3D & 4D Technology Industry Revenue Million Forecast, by Region 2019 & 2032
- Table 2: Global 3D & 4D Technology Industry Revenue Million Forecast, by Products 2019 & 2032
- Table 3: Global 3D & 4D Technology Industry Revenue Million Forecast, by End-User Industry 2019 & 2032
- Table 4: Global 3D & 4D Technology Industry Revenue Million Forecast, by Region 2019 & 2032
- Table 5: Global 3D & 4D Technology Industry Revenue Million Forecast, by Country 2019 & 2032
- Table 6: United States 3D & 4D Technology Industry Revenue (Million) Forecast, by Application 2019 & 2032
- Table 7: Canada 3D & 4D Technology Industry Revenue (Million) Forecast, by Application 2019 & 2032
- Table 8: Mexico 3D & 4D Technology Industry Revenue (Million) Forecast, by Application 2019 & 2032
- Table 9: Global 3D & 4D Technology Industry Revenue Million Forecast, by Country 2019 & 2032
- Table 10: Germany 3D & 4D Technology Industry Revenue (Million) Forecast, by Application 2019 & 2032
- Table 11: United Kingdom 3D & 4D Technology Industry Revenue (Million) Forecast, by Application 2019 & 2032
- Table 12: France 3D & 4D Technology Industry Revenue (Million) Forecast, by Application 2019 & 2032
- Table 13: Spain 3D & 4D Technology Industry Revenue (Million) Forecast, by Application 2019 & 2032
- Table 14: Italy 3D & 4D Technology Industry Revenue (Million) Forecast, by Application 2019 & 2032
- Table 15: Spain 3D & 4D Technology Industry Revenue (Million) Forecast, by Application 2019 & 2032
- Table 16: Belgium 3D & 4D Technology Industry Revenue (Million) Forecast, by Application 2019 & 2032
- Table 17: Netherland 3D & 4D Technology Industry Revenue (Million) Forecast, by Application 2019 & 2032
- Table 18: Nordics 3D & 4D Technology Industry Revenue (Million) Forecast, by Application 2019 & 2032
- Table 19: Rest of Europe 3D & 4D Technology Industry Revenue (Million) Forecast, by Application 2019 & 2032
- Table 20: Global 3D & 4D Technology Industry Revenue Million Forecast, by Country 2019 & 2032
- Table 21: China 3D & 4D Technology Industry Revenue (Million) Forecast, by Application 2019 & 2032
- Table 22: Japan 3D & 4D Technology Industry Revenue (Million) Forecast, by Application 2019 & 2032
- Table 23: India 3D & 4D Technology Industry Revenue (Million) Forecast, by Application 2019 & 2032
- Table 24: South Korea 3D & 4D Technology Industry Revenue (Million) Forecast, by Application 2019 & 2032
- Table 25: Southeast Asia 3D & 4D Technology Industry Revenue (Million) Forecast, by Application 2019 & 2032
- Table 26: Australia 3D & 4D Technology Industry Revenue (Million) Forecast, by Application 2019 & 2032
- Table 27: Indonesia 3D & 4D Technology Industry Revenue (Million) Forecast, by Application 2019 & 2032
- Table 28: Phillipes 3D & 4D Technology Industry Revenue (Million) Forecast, by Application 2019 & 2032
- Table 29: Singapore 3D & 4D Technology Industry Revenue (Million) Forecast, by Application 2019 & 2032
- Table 30: Thailandc 3D & 4D Technology Industry Revenue (Million) Forecast, by Application 2019 & 2032
- Table 31: Rest of Asia Pacific 3D & 4D Technology Industry Revenue (Million) Forecast, by Application 2019 & 2032
- Table 32: Global 3D & 4D Technology Industry Revenue Million Forecast, by Country 2019 & 2032
- Table 33: Brazil 3D & 4D Technology Industry Revenue (Million) Forecast, by Application 2019 & 2032
- Table 34: Argentina 3D & 4D Technology Industry Revenue (Million) Forecast, by Application 2019 & 2032
- Table 35: Peru 3D & 4D Technology Industry Revenue (Million) Forecast, by Application 2019 & 2032
- Table 36: Chile 3D & 4D Technology Industry Revenue (Million) Forecast, by Application 2019 & 2032
- Table 37: Colombia 3D & 4D Technology Industry Revenue (Million) Forecast, by Application 2019 & 2032
- Table 38: Ecuador 3D & 4D Technology Industry Revenue (Million) Forecast, by Application 2019 & 2032
- Table 39: Venezuela 3D & 4D Technology Industry Revenue (Million) Forecast, by Application 2019 & 2032
- Table 40: Rest of South America 3D & 4D Technology Industry Revenue (Million) Forecast, by Application 2019 & 2032
- Table 41: Global 3D & 4D Technology Industry Revenue Million Forecast, by Country 2019 & 2032
- Table 42: United States 3D & 4D Technology Industry Revenue (Million) Forecast, by Application 2019 & 2032
- Table 43: Canada 3D & 4D Technology Industry Revenue (Million) Forecast, by Application 2019 & 2032
- Table 44: Mexico 3D & 4D Technology Industry Revenue (Million) Forecast, by Application 2019 & 2032
- Table 45: Global 3D & 4D Technology Industry Revenue Million Forecast, by Country 2019 & 2032
- Table 46: United Arab Emirates 3D & 4D Technology Industry Revenue (Million) Forecast, by Application 2019 & 2032
- Table 47: Saudi Arabia 3D & 4D Technology Industry Revenue (Million) Forecast, by Application 2019 & 2032
- Table 48: South Africa 3D & 4D Technology Industry Revenue (Million) Forecast, by Application 2019 & 2032
- Table 49: Rest of Middle East and Africa 3D & 4D Technology Industry Revenue (Million) Forecast, by Application 2019 & 2032
- Table 50: Global 3D & 4D Technology Industry Revenue Million Forecast, by Products 2019 & 2032
- Table 51: Global 3D & 4D Technology Industry Revenue Million Forecast, by End-User Industry 2019 & 2032
- Table 52: Global 3D & 4D Technology Industry Revenue Million Forecast, by Country 2019 & 2032
- Table 53: Global 3D & 4D Technology Industry Revenue Million Forecast, by Products 2019 & 2032
- Table 54: Global 3D & 4D Technology Industry Revenue Million Forecast, by End-User Industry 2019 & 2032
- Table 55: Global 3D & 4D Technology Industry Revenue Million Forecast, by Country 2019 & 2032
- Table 56: Global 3D & 4D Technology Industry Revenue Million Forecast, by Products 2019 & 2032
- Table 57: Global 3D & 4D Technology Industry Revenue Million Forecast, by End-User Industry 2019 & 2032
- Table 58: Global 3D & 4D Technology Industry Revenue Million Forecast, by Country 2019 & 2032
- Table 59: Global 3D & 4D Technology Industry Revenue Million Forecast, by Products 2019 & 2032
- Table 60: Global 3D & 4D Technology Industry Revenue Million Forecast, by End-User Industry 2019 & 2032
- Table 61: Global 3D & 4D Technology Industry Revenue Million Forecast, by Country 2019 & 2032
- Table 62: Global 3D & 4D Technology Industry Revenue Million Forecast, by Products 2019 & 2032
- Table 63: Global 3D & 4D Technology Industry Revenue Million Forecast, by End-User Industry 2019 & 2032
- Table 64: Global 3D & 4D Technology Industry Revenue Million Forecast, by Country 2019 & 2032
- Table 65: Global 3D & 4D Technology Industry Revenue Million Forecast, by Products 2019 & 2032
- Table 66: Global 3D & 4D Technology Industry Revenue Million Forecast, by End-User Industry 2019 & 2032
- Table 67: Global 3D & 4D Technology Industry Revenue Million Forecast, by Country 2019 & 2032
Frequently Asked Questions
1. What is the projected Compound Annual Growth Rate (CAGR) of the 3D & 4D Technology Industry?
The projected CAGR is approximately 21.82%.
2. Which companies are prominent players in the 3D & 4D Technology Industry?
Key companies in the market include LG Electronics Inc, Samsung Electronics Co Ltd, Barco N V, Intel Corporatio, 3D Systems Corporation, Autodesk Inc, Stratus's Inc, Dolby Laboratories Inc, Panasonic Corporation, Sony Corporation.
3. What are the main segments of the 3D & 4D Technology Industry?
The market segments include Products, End-User Industry.
4. Can you provide details about the market size?
The market size is estimated to be USD 295.35 Million as of 2022.
5. What are some drivers contributing to market growth?
Increasing Applications of 3D Technology Across Various End-User Industries; Increasing Demand for 3D Technology in the Entertainment Industry; Increased Investment in R&D to Drive Development of Cost-Effective 3D Technology.
6. What are the notable trends driving market growth?
Increasing Applications of 3D Printing Across Various End-user Industries.
7. Are there any restraints impacting market growth?
High Product Associated Costs and Availability of 3D Printing Materials.
8. Can you provide examples of recent developments in the market?
June 2023: Epic Games, the creators of Fortnite and Unreal Engine, and LVMH, a France-based luxury goods conglomerate, partnered to modernize the Group's creative process and offer clients new immersive product discovery experiences. Due to this strategic partnership with Epic, LVMH and its brands will be able to provide experiences like virtual fitting rooms and fashion shows, 360-degree product carousels, augmented reality, the development of digital twins, and more.
9. What pricing options are available for accessing the report?
Pricing options include single-user, multi-user, and enterprise licenses priced at USD 4750, USD 5250, and USD 8750 respectively.
10. Is the market size provided in terms of value or volume?
The market size is provided in terms of value, measured in Million.
11. Are there any specific market keywords associated with the report?
Yes, the market keyword associated with the report is "3D & 4D Technology Industry," which aids in identifying and referencing the specific market segment covered.
12. How do I determine which pricing option suits my needs best?
The pricing options vary based on user requirements and access needs. Individual users may opt for single-user licenses, while businesses requiring broader access may choose multi-user or enterprise licenses for cost-effective access to the report.
13. Are there any additional resources or data provided in the 3D & 4D Technology Industry report?
While the report offers comprehensive insights, it's advisable to review the specific contents or supplementary materials provided to ascertain if additional resources or data are available.
14. How can I stay updated on further developments or reports in the 3D & 4D Technology Industry?
To stay informed about further developments, trends, and reports in the 3D & 4D Technology Industry, consider subscribing to industry newsletters, following relevant companies and organizations, or regularly checking reputable industry news sources and publications.
Methodology
Step 1 - Identification of Relevant Samples Size from Population Database


Step 2 - Approaches for Defining Global Market Size (Value, Volume* & Price*)

Note*: In applicable scenarios
Step 3 - Data Sources
Primary Research
- Web Analytics
- Survey Reports
- Research Institute
- Latest Research Reports
- Opinion Leaders
Secondary Research
- Annual Reports
- White Paper
- Latest Press Release
- Industry Association
- Paid Database
- Investor Presentations

Step 4 - Data Triangulation
Involves using different sources of information in order to increase the validity of a study
These sources are likely to be stakeholders in a program - participants, other researchers, program staff, other community members, and so on.
Then we put all data in single framework & apply various statistical tools to find out the dynamic on the market.
During the analysis stage, feedback from the stakeholder groups would be compared to determine areas of agreement as well as areas of divergence


