

Key Insights
The global Whiplash Protection Systems (WPS) market is poised for significant expansion, exhibiting a projected Compound Annual Growth Rate (CAGR) of 8.42% from 2025 to 2033. This robust growth is attributed to several converging factors. Increased global vehicle sales, particularly within emerging economies characterized by a growing middle class, are driving demand for advanced automotive safety features. Concurrently, stringent governmental regulations mandating the integration of sophisticated safety technologies in new vehicles are accelerating market penetration. Heightened consumer awareness regarding the severity and long-term impact of whiplash injuries further contributes to this upward trend. Innovations in technology, leading to the development of more effective proactive head restraint systems, are also pivotal. These advanced systems offer superior protection over conventional reactive restraints and are gaining significant traction, propelling market expansion. The market is segmented by vehicle type, encompassing passenger cars and commercial vehicles, and by system type, including reactive, proactive, and other systems. While passenger cars currently lead due to higher production volumes, the commercial vehicle segment is anticipated to experience substantial growth, driven by escalating regulatory pressures and fleet safety imperatives.
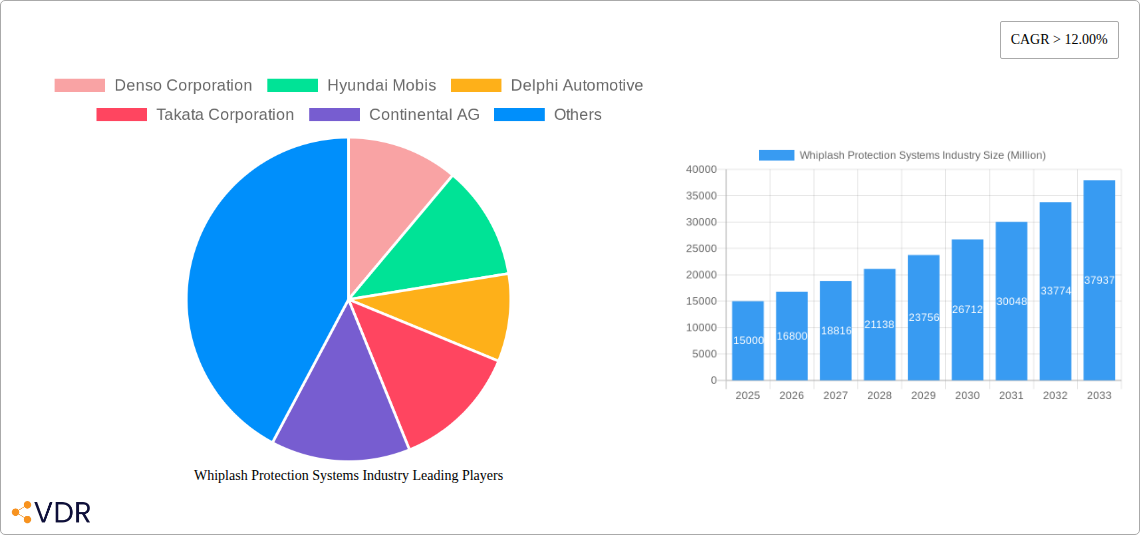
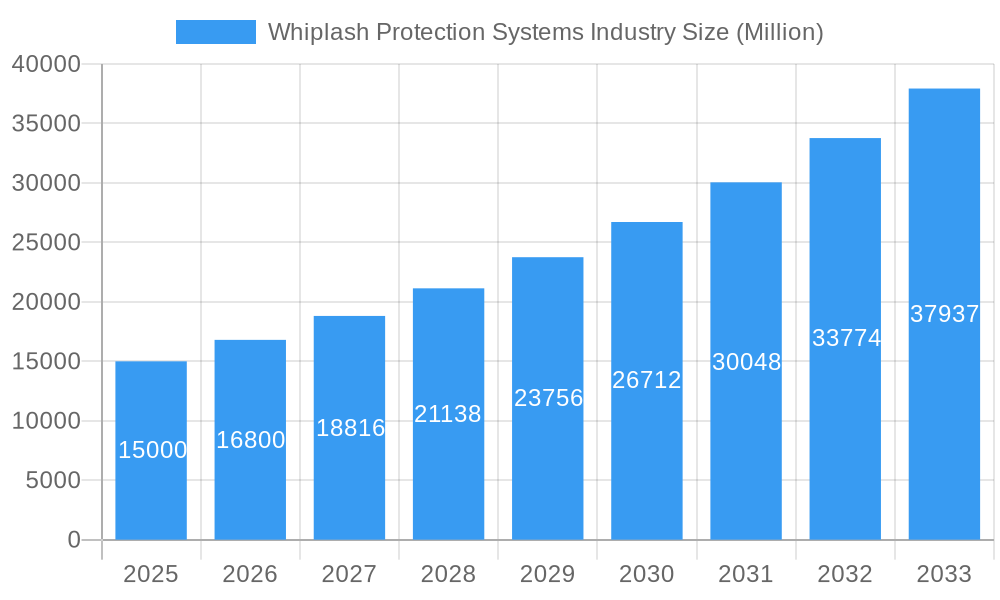
Whiplash Protection Systems Industry Market Size (In Billion)
Geographically, North America and Europe currently command considerable market shares, reflecting high vehicle ownership rates and well-established safety standards. However, the Asia-Pacific region, notably China and India, is forecast to achieve the most rapid growth in the coming years. This expansion is fueled by rapid economic development, escalating vehicle production, and rising consumer disposable incomes. Key industry participants include established automotive component manufacturers such as Denso Corporation, Hyundai Mobis, Autoliv Inc., and Bosch. These companies are making substantial investments in research and development to refine their product portfolios and solidify their market standings. Competitive intensity remains high, with market players prioritizing technological innovation, strategic collaborations, and global expansion to secure market leadership. The market's future outlook indicates sustained strong growth, propelled by a confluence of technological advancements, regulatory mandates, and growing consumer demand for enhanced vehicle safety. The market is projected to reach a market size of approximately $8.93 billion by 2033, surpassing current estimates due to these sustained growth dynamics.
Whiplash Protection Systems Industry Company Market Share
Whiplash Protection Systems Market Report: 2019-2033
This comprehensive report provides a detailed analysis of the global Whiplash Protection Systems market, encompassing market dynamics, growth trends, regional segmentation, product landscape, and key player analysis. The study period covers 2019-2033, with a base year of 2025 and a forecast period of 2025-2033. The report leverages extensive primary and secondary research to deliver actionable insights for industry professionals, investors, and stakeholders. The market is segmented by vehicle type (Passenger Cars, Commercial Vehicles) and system type (Reactive Head Restraint, Proactive Head Restraint, Others). Market values are presented in million units.
Whiplash Protection Systems Industry Market Dynamics & Structure
The global whiplash protection systems market exhibits a moderately consolidated structure, with key players like Denso Corporation, Hyundai Mobis, Delphi Automotive, Takata Corporation, Continental AG, Autoliv Inc, Robert Bosch GmbH, Lear Corporation, Wabco, Grammer AG, and others vying for market share. Technological innovation, particularly in active safety systems and advanced materials, is a key driver. Stringent safety regulations globally, especially in North America and Europe, are compelling adoption. The market witnesses ongoing mergers and acquisitions (M&A) activity, aiming for scale and technology integration. Competitive substitutes include alternative neck support designs, but their market penetration remains relatively limited due to safety concerns.
- Market Concentration: Moderately consolidated, with the top 5 players holding an estimated xx% market share in 2025.
- Technological Innovation: Focus on lightweight materials, AI-driven systems, and improved sensor technologies.
- Regulatory Framework: Stringent safety standards (e.g., Euro NCAP, NHTSA) driving market growth.
- M&A Activity: xx major M&A deals recorded between 2019 and 2024, indicating consolidation trends.
- Innovation Barriers: High R&D costs and stringent testing requirements hinder smaller players.
- End-User Demographics: Growing awareness of whiplash injuries and rising vehicle ownership are key factors.
Whiplash Protection Systems Industry Growth Trends & Insights
The global whiplash protection systems market witnessed robust growth during the historical period (2019-2024), driven primarily by increasing vehicle production, particularly in developing economies. The market is projected to exhibit a CAGR of xx% during the forecast period (2025-2033), reaching a market size of xx million units by 2033. This growth is fueled by technological advancements leading to the adoption of more sophisticated and effective systems. Consumer preferences are shifting towards vehicles equipped with advanced safety features, including whiplash protection systems. Market penetration is expected to increase significantly in emerging markets as vehicle ownership rates rise. Disruptions from autonomous driving technology are expected to create both opportunities and challenges for the market as safety system integration needs evolve. The rising adoption of advanced driver-assistance systems (ADAS) is also creating synergy with the growth of whiplash protection systems.
Dominant Regions, Countries, or Segments in Whiplash Protection Systems Industry
North America and Europe currently dominate the whiplash protection systems market, driven by higher vehicle ownership rates, stringent safety regulations, and a strong emphasis on occupant safety. Within vehicle types, passenger cars represent a larger market segment compared to commercial vehicles, owing to higher production volumes. Proactive head restraints are witnessing increased adoption compared to reactive head restraints due to their superior performance in preventing whiplash injuries. Asia-Pacific is expected to show significant growth in the forecast period, driven by rapid economic development and increasing vehicle production.
- Key Drivers (North America): Stringent safety regulations, high vehicle ownership rates, and strong consumer preference for advanced safety features.
- Key Drivers (Europe): Similar to North America, with additional focus on environmental regulations impacting material choices.
- Key Drivers (Asia-Pacific): Rapid economic growth, rising vehicle production, and increasing disposable income.
- Market Share: North America holds xx% market share in 2025, followed by Europe at xx% and Asia-Pacific at xx%.
- Growth Potential: Asia-Pacific is projected to exhibit the highest growth rate during the forecast period.
Whiplash Protection Systems Industry Product Landscape
The whiplash protection systems market offers a range of products, from basic reactive head restraints to advanced proactive systems incorporating sensors and actuators. Continuous innovations focus on enhancing effectiveness, reducing weight, and integrating systems seamlessly with other vehicle safety technologies. Key selling propositions include enhanced occupant safety, reduced injury severity in collisions, and compliance with evolving safety regulations. Technological advancements such as advanced materials (e.g., lightweight composites), improved sensor technologies, and refined algorithms drive product differentiation and improved performance.
Key Drivers, Barriers & Challenges in Whiplash Protection Systems Industry
Key Drivers: Rising vehicle production globally, stringent safety regulations, increasing consumer awareness of whiplash injuries, and advancements in sensor and actuator technologies. The integration of whiplash protection systems with ADAS is another major growth driver.
Key Challenges: High R&D costs, the need for rigorous testing and certification, intense competition among established players, and supply chain disruptions due to geopolitical factors. Furthermore, the cost of advanced proactive systems can pose a barrier to adoption in certain market segments.
Emerging Opportunities in Whiplash Protection Systems Industry
Emerging opportunities lie in the development of next-generation whiplash protection systems with enhanced functionalities such as AI-powered predictive capabilities, improved ergonomics, and greater integration with other safety systems. Untapped markets in developing economies offer considerable growth potential. Personalized whiplash protection systems tailored to individual occupant characteristics represent a future direction. Furthermore, the increasing demand for eco-friendly materials presents opportunities for innovation.
Growth Accelerators in the Whiplash Protection Systems Industry
Long-term growth will be driven by technological breakthroughs in active safety systems, leading to improved effectiveness and reduced costs. Strategic partnerships between automakers and component suppliers will accelerate innovation and deployment. Expansion into emerging markets with supportive government policies will further fuel market growth. The development of lightweight and sustainable materials is another crucial factor accelerating adoption and reducing manufacturing costs.
Key Players Shaping the Whiplash Protection Systems Industry Market
Notable Milestones in Whiplash Protection Systems Industry Sector
- 2020: Introduction of a new lightweight proactive head restraint system by Autoliv Inc.
- 2022: Acquisition of a smaller whiplash protection systems manufacturer by Bosch.
- 2023: Release of updated safety standards by Euro NCAP influencing system design.
- 2024: Several key players announcing investments in R&D for next-generation systems.
In-Depth Whiplash Protection Systems Industry Market Outlook
The future of the whiplash protection systems market is promising, driven by continuous technological advancements, increasing consumer demand for safety, and the expansion into new markets. Strategic partnerships and focused R&D investments will play a critical role in shaping the market's trajectory. The focus will shift toward AI-integrated systems, lightweight designs, and improved integration with other vehicle safety features, driving long-term growth and creating new strategic opportunities for industry players.
Whiplash Protection Systems Industry Segmentation
-
1. Vehicle Type
- 1.1. Passenger Cars
- 1.2. Commercial Vehicle
-
2. System Type
- 2.1. Reactive Head Restraint
- 2.2. Proactive Head Restraint
- 2.3. Others
Whiplash Protection Systems Industry Segmentation By Geography
-
1. North America
- 1.1. United States
- 1.2. Canada
- 1.3. Rest of North America
-
2. Europe
- 2.1. Germany
- 2.2. United Kingdom
- 2.3. France
- 2.4. Italy
- 2.5. Rest of Europe
-
3. Asia Pacific
- 3.1. India
- 3.2. China
- 3.3. Japan
- 3.4. South Korea
- 3.5. Rest of Asia Pacific
-
4. Rest of the World
- 4.1. Brazil
- 4.2. Mexico
- 4.3. South Africa
- 4.4. Other Countries

Whiplash Protection Systems Industry Regional Market Share
Geographic Coverage of Whiplash Protection Systems Industry
Whiplash Protection Systems Industry REPORT HIGHLIGHTS
| Aspects | Details |
|---|---|
| Study Period | 2020-2034 |
| Base Year | 2025 |
| Estimated Year | 2026 |
| Forecast Period | 2026-2034 |
| Historical Period | 2020-2025 |
| Growth Rate | CAGR of 8.42% from 2020-2034 |
| Segmentation |
|
Table of Contents
- 1. Introduction
- 1.1. Research Scope
- 1.2. Market Segmentation
- 1.3. Research Objective
- 1.4. Definitions and Assumptions
- 2. Executive Summary
- 2.1. Market Snapshot
- 3. Market Dynamics
- 3.1. Market Drivers
- 3.2. Market Restrains
- 3.3. Market Trends
- 3.4. Market Opportunities
- 4. Market Factor Analysis
- 4.1. Porters Five Forces
- 4.1.1. Bargaining Power of Suppliers
- 4.1.2. Bargaining Power of Buyers
- 4.1.3. Threat of New Entrants
- 4.1.4. Threat of Substitutes
- 4.1.5. Competitive Rivalry
- 4.2. PESTEL analysis
- 4.3. BCG Analysis
- 4.3.1. Stars (High Growth, High Market Share)
- 4.3.2. Cash Cows (Low Growth, High Market Share)
- 4.3.3. Question Mark (High Growth, Low Market Share)
- 4.3.4. Dogs (Low Growth, Low Market Share)
- 4.4. Ansoff Matrix Analysis
- 4.5. Supply Chain Analysis
- 4.6. Regulatory Landscape
- 4.7. Current Market Potential and Opportunity Assessment (TAM–SAM–SOM Framework)
- 4.8. VDR Analyst Note
- 4.1. Porters Five Forces
- 5. Market Analysis, Insights and Forecast 2021-2033
- 5.1. Market Analysis, Insights and Forecast - by Vehicle Type
- 5.1.1. Passenger Cars
- 5.1.2. Commercial Vehicle
- 5.2. Market Analysis, Insights and Forecast - by System Type
- 5.2.1. Reactive Head Restraint
- 5.2.2. Proactive Head Restraint
- 5.2.3. Others
- 5.3. Market Analysis, Insights and Forecast - by Region
- 5.3.1. North America
- 5.3.2. Europe
- 5.3.3. Asia Pacific
- 5.3.4. Rest of the World
- 5.1. Market Analysis, Insights and Forecast - by Vehicle Type
- 6. Global Whiplash Protection Systems Industry Analysis, Insights and Forecast, 2021-2033
- 6.1. Market Analysis, Insights and Forecast - by Vehicle Type
- 6.1.1. Passenger Cars
- 6.1.2. Commercial Vehicle
- 6.2. Market Analysis, Insights and Forecast - by System Type
- 6.2.1. Reactive Head Restraint
- 6.2.2. Proactive Head Restraint
- 6.2.3. Others
- 6.1. Market Analysis, Insights and Forecast - by Vehicle Type
- 7. North America Whiplash Protection Systems Industry Analysis, Insights and Forecast, 2021-2033
- 7.1. Market Analysis, Insights and Forecast - by Vehicle Type
- 7.1.1. Passenger Cars
- 7.1.2. Commercial Vehicle
- 7.2. Market Analysis, Insights and Forecast - by System Type
- 7.2.1. Reactive Head Restraint
- 7.2.2. Proactive Head Restraint
- 7.2.3. Others
- 7.1. Market Analysis, Insights and Forecast - by Vehicle Type
- 8. Europe Whiplash Protection Systems Industry Analysis, Insights and Forecast, 2021-2033
- 8.1. Market Analysis, Insights and Forecast - by Vehicle Type
- 8.1.1. Passenger Cars
- 8.1.2. Commercial Vehicle
- 8.2. Market Analysis, Insights and Forecast - by System Type
- 8.2.1. Reactive Head Restraint
- 8.2.2. Proactive Head Restraint
- 8.2.3. Others
- 8.1. Market Analysis, Insights and Forecast - by Vehicle Type
- 9. Asia Pacific Whiplash Protection Systems Industry Analysis, Insights and Forecast, 2021-2033
- 9.1. Market Analysis, Insights and Forecast - by Vehicle Type
- 9.1.1. Passenger Cars
- 9.1.2. Commercial Vehicle
- 9.2. Market Analysis, Insights and Forecast - by System Type
- 9.2.1. Reactive Head Restraint
- 9.2.2. Proactive Head Restraint
- 9.2.3. Others
- 9.1. Market Analysis, Insights and Forecast - by Vehicle Type
- 10. Rest of the World Whiplash Protection Systems Industry Analysis, Insights and Forecast, 2021-2033
- 10.1. Market Analysis, Insights and Forecast - by Vehicle Type
- 10.1.1. Passenger Cars
- 10.1.2. Commercial Vehicle
- 10.2. Market Analysis, Insights and Forecast - by System Type
- 10.2.1. Reactive Head Restraint
- 10.2.2. Proactive Head Restraint
- 10.2.3. Others
- 10.1. Market Analysis, Insights and Forecast - by Vehicle Type
- 11. Competitive Analysis
- 11.1. Company Profiles
- 11.1.1 Denso Corporation
- 11.1.1.1. Company Overview
- 11.1.1.2. Products
- 11.1.1.3. Company Financials
- 11.1.1.4. SWOT Analysis
- 11.1.2 Hyundai Mobis
- 11.1.2.1. Company Overview
- 11.1.2.2. Products
- 11.1.2.3. Company Financials
- 11.1.2.4. SWOT Analysis
- 11.1.3 Delphi Automotive
- 11.1.3.1. Company Overview
- 11.1.3.2. Products
- 11.1.3.3. Company Financials
- 11.1.3.4. SWOT Analysis
- 11.1.4 Takata Corporation
- 11.1.4.1. Company Overview
- 11.1.4.2. Products
- 11.1.4.3. Company Financials
- 11.1.4.4. SWOT Analysis
- 11.1.5 Continental AG
- 11.1.5.1. Company Overview
- 11.1.5.2. Products
- 11.1.5.3. Company Financials
- 11.1.5.4. SWOT Analysis
- 11.1.6 Autoliv Inc
- 11.1.6.1. Company Overview
- 11.1.6.2. Products
- 11.1.6.3. Company Financials
- 11.1.6.4. SWOT Analysis
- 11.1.7 Robert Bosch GmbH
- 11.1.7.1. Company Overview
- 11.1.7.2. Products
- 11.1.7.3. Company Financials
- 11.1.7.4. SWOT Analysis
- 11.1.8 Lear Corporation
- 11.1.8.1. Company Overview
- 11.1.8.2. Products
- 11.1.8.3. Company Financials
- 11.1.8.4. SWOT Analysis
- 11.1.9 Wabco*List Not Exhaustive
- 11.1.9.1. Company Overview
- 11.1.9.2. Products
- 11.1.9.3. Company Financials
- 11.1.9.4. SWOT Analysis
- 11.1.10 Grammer AG
- 11.1.10.1. Company Overview
- 11.1.10.2. Products
- 11.1.10.3. Company Financials
- 11.1.10.4. SWOT Analysis
- 11.1.1 Denso Corporation
- 11.2. Market Entropy
- 11.2.1 Company's Key Areas Served
- 11.2.2 Recent Developments
- 11.3. Company Market Share Analysis 2025
- 11.3.1 Top 5 Companies Market Share Analysis
- 11.3.2 Top 3 Companies Market Share Analysis
- 11.4. List of Potential Customers
- 12. Research Methodology
List of Figures
- Figure 1: Global Whiplash Protection Systems Industry Revenue Breakdown (billion, %) by Region 2025 & 2033
- Figure 2: North America Whiplash Protection Systems Industry Revenue (billion), by Vehicle Type 2025 & 2033
- Figure 3: North America Whiplash Protection Systems Industry Revenue Share (%), by Vehicle Type 2025 & 2033
- Figure 4: North America Whiplash Protection Systems Industry Revenue (billion), by System Type 2025 & 2033
- Figure 5: North America Whiplash Protection Systems Industry Revenue Share (%), by System Type 2025 & 2033
- Figure 6: North America Whiplash Protection Systems Industry Revenue (billion), by Country 2025 & 2033
- Figure 7: North America Whiplash Protection Systems Industry Revenue Share (%), by Country 2025 & 2033
- Figure 8: Europe Whiplash Protection Systems Industry Revenue (billion), by Vehicle Type 2025 & 2033
- Figure 9: Europe Whiplash Protection Systems Industry Revenue Share (%), by Vehicle Type 2025 & 2033
- Figure 10: Europe Whiplash Protection Systems Industry Revenue (billion), by System Type 2025 & 2033
- Figure 11: Europe Whiplash Protection Systems Industry Revenue Share (%), by System Type 2025 & 2033
- Figure 12: Europe Whiplash Protection Systems Industry Revenue (billion), by Country 2025 & 2033
- Figure 13: Europe Whiplash Protection Systems Industry Revenue Share (%), by Country 2025 & 2033
- Figure 14: Asia Pacific Whiplash Protection Systems Industry Revenue (billion), by Vehicle Type 2025 & 2033
- Figure 15: Asia Pacific Whiplash Protection Systems Industry Revenue Share (%), by Vehicle Type 2025 & 2033
- Figure 16: Asia Pacific Whiplash Protection Systems Industry Revenue (billion), by System Type 2025 & 2033
- Figure 17: Asia Pacific Whiplash Protection Systems Industry Revenue Share (%), by System Type 2025 & 2033
- Figure 18: Asia Pacific Whiplash Protection Systems Industry Revenue (billion), by Country 2025 & 2033
- Figure 19: Asia Pacific Whiplash Protection Systems Industry Revenue Share (%), by Country 2025 & 2033
- Figure 20: Rest of the World Whiplash Protection Systems Industry Revenue (billion), by Vehicle Type 2025 & 2033
- Figure 21: Rest of the World Whiplash Protection Systems Industry Revenue Share (%), by Vehicle Type 2025 & 2033
- Figure 22: Rest of the World Whiplash Protection Systems Industry Revenue (billion), by System Type 2025 & 2033
- Figure 23: Rest of the World Whiplash Protection Systems Industry Revenue Share (%), by System Type 2025 & 2033
- Figure 24: Rest of the World Whiplash Protection Systems Industry Revenue (billion), by Country 2025 & 2033
- Figure 25: Rest of the World Whiplash Protection Systems Industry Revenue Share (%), by Country 2025 & 2033
List of Tables
- Table 1: Global Whiplash Protection Systems Industry Revenue billion Forecast, by Vehicle Type 2020 & 2033
- Table 2: Global Whiplash Protection Systems Industry Revenue billion Forecast, by System Type 2020 & 2033
- Table 3: Global Whiplash Protection Systems Industry Revenue billion Forecast, by Region 2020 & 2033
- Table 4: Global Whiplash Protection Systems Industry Revenue billion Forecast, by Vehicle Type 2020 & 2033
- Table 5: Global Whiplash Protection Systems Industry Revenue billion Forecast, by System Type 2020 & 2033
- Table 6: Global Whiplash Protection Systems Industry Revenue billion Forecast, by Country 2020 & 2033
- Table 7: United States Whiplash Protection Systems Industry Revenue (billion) Forecast, by Application 2020 & 2033
- Table 8: Canada Whiplash Protection Systems Industry Revenue (billion) Forecast, by Application 2020 & 2033
- Table 9: Rest of North America Whiplash Protection Systems Industry Revenue (billion) Forecast, by Application 2020 & 2033
- Table 10: Global Whiplash Protection Systems Industry Revenue billion Forecast, by Vehicle Type 2020 & 2033
- Table 11: Global Whiplash Protection Systems Industry Revenue billion Forecast, by System Type 2020 & 2033
- Table 12: Global Whiplash Protection Systems Industry Revenue billion Forecast, by Country 2020 & 2033
- Table 13: Germany Whiplash Protection Systems Industry Revenue (billion) Forecast, by Application 2020 & 2033
- Table 14: United Kingdom Whiplash Protection Systems Industry Revenue (billion) Forecast, by Application 2020 & 2033
- Table 15: France Whiplash Protection Systems Industry Revenue (billion) Forecast, by Application 2020 & 2033
- Table 16: Italy Whiplash Protection Systems Industry Revenue (billion) Forecast, by Application 2020 & 2033
- Table 17: Rest of Europe Whiplash Protection Systems Industry Revenue (billion) Forecast, by Application 2020 & 2033
- Table 18: Global Whiplash Protection Systems Industry Revenue billion Forecast, by Vehicle Type 2020 & 2033
- Table 19: Global Whiplash Protection Systems Industry Revenue billion Forecast, by System Type 2020 & 2033
- Table 20: Global Whiplash Protection Systems Industry Revenue billion Forecast, by Country 2020 & 2033
- Table 21: India Whiplash Protection Systems Industry Revenue (billion) Forecast, by Application 2020 & 2033
- Table 22: China Whiplash Protection Systems Industry Revenue (billion) Forecast, by Application 2020 & 2033
- Table 23: Japan Whiplash Protection Systems Industry Revenue (billion) Forecast, by Application 2020 & 2033
- Table 24: South Korea Whiplash Protection Systems Industry Revenue (billion) Forecast, by Application 2020 & 2033
- Table 25: Rest of Asia Pacific Whiplash Protection Systems Industry Revenue (billion) Forecast, by Application 2020 & 2033
- Table 26: Global Whiplash Protection Systems Industry Revenue billion Forecast, by Vehicle Type 2020 & 2033
- Table 27: Global Whiplash Protection Systems Industry Revenue billion Forecast, by System Type 2020 & 2033
- Table 28: Global Whiplash Protection Systems Industry Revenue billion Forecast, by Country 2020 & 2033
- Table 29: Brazil Whiplash Protection Systems Industry Revenue (billion) Forecast, by Application 2020 & 2033
- Table 30: Mexico Whiplash Protection Systems Industry Revenue (billion) Forecast, by Application 2020 & 2033
- Table 31: South Africa Whiplash Protection Systems Industry Revenue (billion) Forecast, by Application 2020 & 2033
- Table 32: Other Countries Whiplash Protection Systems Industry Revenue (billion) Forecast, by Application 2020 & 2033
Frequently Asked Questions
1. What is the projected Compound Annual Growth Rate (CAGR) of the Whiplash Protection Systems Industry?
The projected CAGR is approximately 8.42%.
2. Which companies are prominent players in the Whiplash Protection Systems Industry?
Key companies in the market include Denso Corporation, Hyundai Mobis, Delphi Automotive, Takata Corporation, Continental AG, Autoliv Inc, Robert Bosch GmbH, Lear Corporation, Wabco*List Not Exhaustive, Grammer AG.
3. What are the main segments of the Whiplash Protection Systems Industry?
The market segments include Vehicle Type, System Type.
4. Can you provide details about the market size?
The market size is estimated to be USD 8.93 billion as of 2022.
5. What are some drivers contributing to market growth?
ADOPTION OF STEER-BY-WIRE SYSTEM AIDING MARKET GROWTH; Others.
6. What are the notable trends driving market growth?
Technological Developments Will Help This Market Grow.
7. Are there any restraints impacting market growth?
RAW MATERIAL PRICE INCREASES ARE EXPECTED TO STIFLE MARKET GROWTH; Others.
8. Can you provide examples of recent developments in the market?
N/A
9. What pricing options are available for accessing the report?
Pricing options include single-user, multi-user, and enterprise licenses priced at USD 4750, USD 5250, and USD 8750 respectively.
10. Is the market size provided in terms of value or volume?
The market size is provided in terms of value, measured in billion.
11. Are there any specific market keywords associated with the report?
Yes, the market keyword associated with the report is "Whiplash Protection Systems Industry," which aids in identifying and referencing the specific market segment covered.
12. How do I determine which pricing option suits my needs best?
The pricing options vary based on user requirements and access needs. Individual users may opt for single-user licenses, while businesses requiring broader access may choose multi-user or enterprise licenses for cost-effective access to the report.
13. Are there any additional resources or data provided in the Whiplash Protection Systems Industry report?
While the report offers comprehensive insights, it's advisable to review the specific contents or supplementary materials provided to ascertain if additional resources or data are available.
14. How can I stay updated on further developments or reports in the Whiplash Protection Systems Industry?
To stay informed about further developments, trends, and reports in the Whiplash Protection Systems Industry, consider subscribing to industry newsletters, following relevant companies and organizations, or regularly checking reputable industry news sources and publications.
Methodology
Step 1 - Identification of Relevant Samples Size from Population Database


Step 2 - Approaches for Defining Global Market Size (Value, Volume* & Price*)

Note*: In applicable scenarios
Step 3 - Data Sources
Primary Research
- Web Analytics
- Survey Reports
- Research Institute
- Latest Research Reports
- Opinion Leaders
Secondary Research
- Annual Reports
- White Paper
- Latest Press Release
- Industry Association
- Paid Database
- Investor Presentations

Step 4 - Data Triangulation
Involves using different sources of information in order to increase the validity of a study
These sources are likely to be stakeholders in a program - participants, other researchers, program staff, other community members, and so on.
Then we put all data in single framework & apply various statistical tools to find out the dynamic on the market.
During the analysis stage, feedback from the stakeholder groups would be compared to determine areas of agreement as well as areas of divergence