


Key Insights
The global wheelchair market is poised for significant expansion, projected to reach $7.42 billion by 2025, with an estimated Compound Annual Growth Rate (CAGR) of 7.3% through 2033. This growth is driven by an aging global population, increasing prevalence of mobility-impairing chronic conditions, and rising healthcare expenditure. The growing demand for assistive technologies that enhance independence and quality of life for individuals with disabilities is a key factor. Furthermore, technological innovations yielding lighter, more durable, and feature-rich wheelchairs, including electric and customized models, are broadening market appeal. Government initiatives promoting accessibility and subsidies for mobility aids are also stimulating market penetration, especially in developed regions.
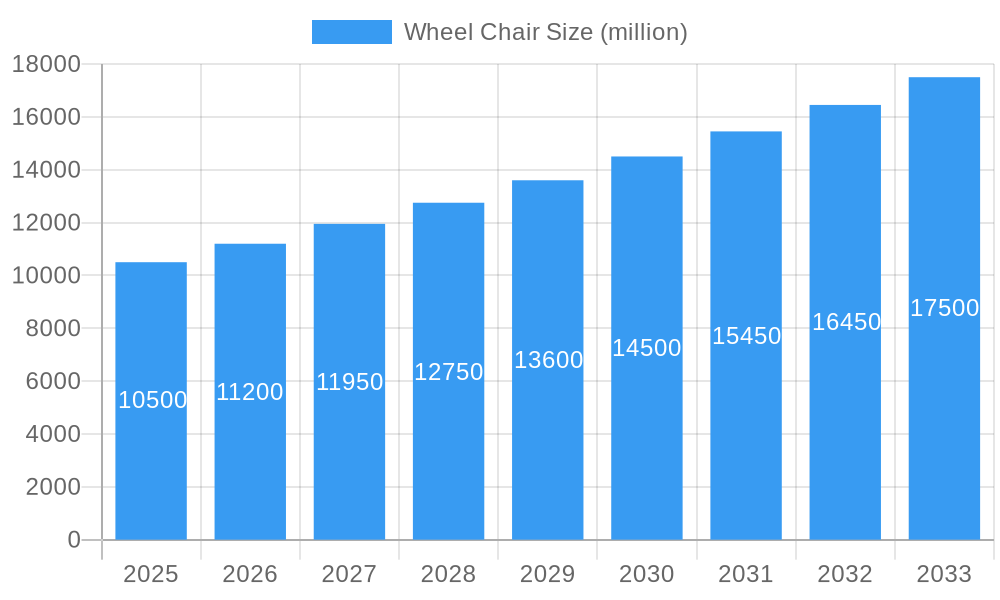
Wheel Chair Market Size (In Billion)

Market segmentation includes electric wheelchairs, which are experiencing substantial growth due to enhanced user convenience, appealing to a wider demographic including the elderly and individuals with severe mobility impairments. Conventional wheelchairs maintain a significant market share owing to their affordability and availability. The household segment is a primary application area, driven by home care trends and the desire for independent living. Hospitals and long-term care facilities are also critical application segments. Geographically, North America and Europe currently dominate the market, supported by high disposable incomes, advanced healthcare infrastructure, and robust policy support. The Asia Pacific region is identified as a high-growth market, propelled by economic development, urbanization, and increasing awareness of assistive technologies. High costs of advanced electric wheelchairs and limited insurance coverage in some developing economies present challenges that are being addressed through innovation and policy adjustments.
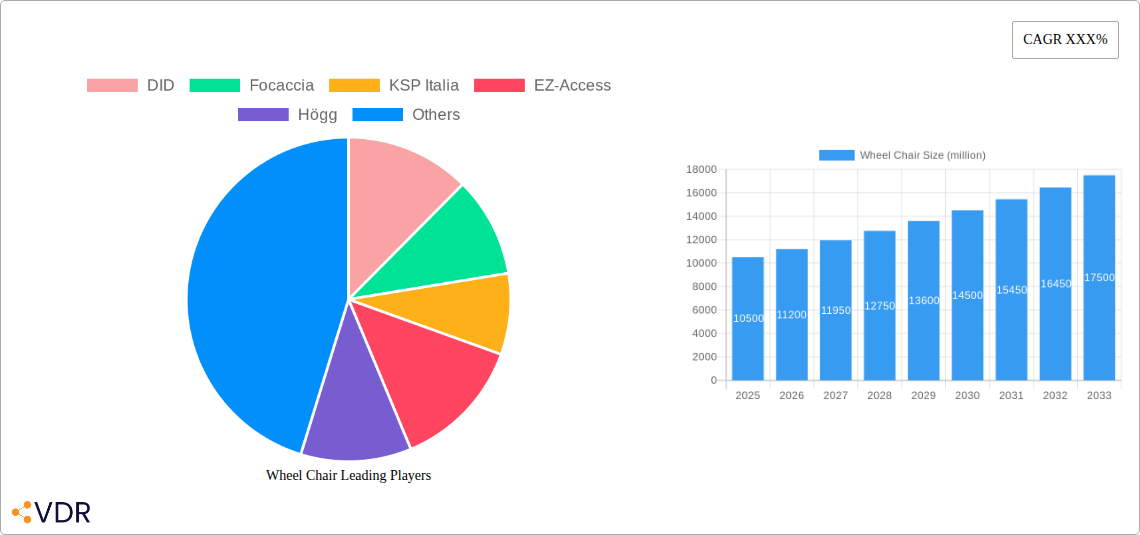
Wheel Chair Company Market Share
Comprehensive Wheelchair Market Analysis: Trends, Innovations, and Growth Projections (2019–2033)
This in-depth report offers a strategic overview of the global wheelchair market, a critical segment within the broader mobility aids industry. Spanning a study period from 2019 to 2033, with a base year of 2025, this analysis provides actionable insights for manufacturers, distributors, healthcare providers, and investors. We dissect market dynamics, identify growth drivers, and forecast future trends, ensuring you are equipped with the knowledge to navigate this evolving landscape. This report covers parent and child market segments, providing a holistic view of the industry.
Wheel Chair Market Dynamics & Structure
The global wheelchair market exhibits a moderately concentrated structure, with a few key players dominating a significant portion of the market share. Technological innovation is a primary driver, fueled by advancements in materials science, battery technology for electric wheelchairs, and intelligent control systems. Regulatory frameworks, particularly those related to medical device safety and accessibility standards, play a crucial role in shaping product development and market entry. Competitive product substitutes, such as personal mobility scooters and advanced walking aids, pose a constant challenge, necessitating continuous innovation in wheelchair design and functionality.
End-user demographics are shifting, with an increasing elderly population and a growing prevalence of chronic conditions contributing to higher demand. Mergers and acquisitions (M&A) trends are observed as companies seek to expand their product portfolios, geographical reach, and technological capabilities. For instance, strategic acquisitions of innovative startups by larger corporations are aimed at integrating cutting-edge features and securing intellectual property. The market share of electric wheelchairs is steadily increasing, reflecting a growing demand for enhanced user autonomy and comfort.
- Market Concentration: Dominated by key players, but with opportunities for niche segment growth.
- Technological Innovation Drivers: Lightweight materials, advanced battery life, smart control, and integrated health monitoring.
- Regulatory Frameworks: FDA, CE marking, and regional accessibility mandates influence product design and market access.
- Competitive Product Substitutes: Personal mobility scooters, smart walkers, and advanced prosthetic limbs.
- End-User Demographics: Aging global population, rising incidence of disabilities and chronic diseases.
- M&A Trends: Consolidation for market share, acquisition of innovative technologies, and expansion into emerging markets.
Wheel Chair Growth Trends & Insights
The wheelchair market is poised for robust growth over the forecast period, driven by a confluence of socioeconomic factors, technological advancements, and evolving consumer preferences. The estimated market size for 2025 is projected to be $15,000 million units, with a significant CAGR expected between 2025 and 2033. This expansion is attributed to the increasing global population of individuals with mobility impairments, a growing awareness of assistive technologies, and favorable healthcare policies promoting independent living.
Adoption rates for advanced wheelchair types, particularly electric and custom wheelchairs, are accelerating. Users are increasingly seeking personalized solutions that cater to their specific needs, lifestyle, and medical conditions. This trend is pushing manufacturers to invest heavily in research and development to offer a wider range of customizable features, ergonomic designs, and advanced functionalities. Technological disruptions, such as the integration of AI for intuitive navigation, advanced sensor systems for fall detection, and lightweight, durable materials, are further enhancing the appeal and performance of wheelchairs.
Consumer behavior is shifting towards a greater emphasis on independence, quality of life, and the ability to participate fully in daily activities. This demand for enhanced mobility solutions is a key catalyst for market growth. Furthermore, the growing disposable income in emerging economies, coupled with increased healthcare spending, is creating new market opportunities. The penetration of smart wheelchairs, which offer connectivity and remote monitoring capabilities, is also expected to rise, aligning with the broader trend of digital health integration.
The historical period (2019–2024) has laid the groundwork for this accelerated growth, marked by steady innovation and increasing market awareness. The base year of 2025 serves as a crucial benchmark for future projections, reflecting current market dynamics and the immediate impact of recent technological breakthroughs. The overall trajectory indicates a sustained upward trend, driven by both necessity and a desire for improved personal mobility solutions.
Dominant Regions, Countries, or Segments in Wheel Chair
North America currently stands as a dominant region in the global wheelchair market, driven by a confluence of factors including a high prevalence of age-related mobility issues, advanced healthcare infrastructure, and strong government initiatives promoting accessibility and independent living. The United States, in particular, represents a significant market share due to its substantial elderly population and robust reimbursement policies for medical devices. Economic policies that encourage investment in healthcare and assistive technologies further bolster this dominance.
Within the country segments, the United States is the leading market, followed by European nations like Germany and the United Kingdom. The market share in these regions is significantly influenced by the adoption rates of electric wheelchairs, which offer enhanced independence for users. The primary drivers for this segment include technological advancements in battery efficiency and motor performance, as well as an increasing demand for personalized mobility solutions.
Analyzing the Type segment, Electric Wheelchairs are experiencing the fastest growth and command a substantial market share due to their ability to provide greater autonomy and reduced physical strain for users. This segment's dominance is further amplified by ongoing technological innovations in areas like battery life, user interface, and smart navigation.
- Dominant Region: North America (with the United States as the leading country).
- Key Drivers in Dominant Regions/Countries:
- Aging population demographics.
- Advanced healthcare infrastructure and accessibility initiatives.
- Favorable reimbursement policies and government funding.
- High disposable income and consumer spending on health and wellness.
- Dominant Segment (Type): Electric Wheelchair.
- Key Drivers for Dominant Segment:
- Technological advancements in battery technology and motor efficiency.
- Increasing demand for enhanced user independence and comfort.
- Customization options catering to specific user needs.
- Integration of smart features and connectivity.
- Growth Potential in Other Segments: Custom wheelchairs are also witnessing significant growth as individuals seek bespoke solutions. While Conventional Wheelchairs maintain a strong presence due to cost-effectiveness, the market is clearly shifting towards technologically advanced options. The "Others" application segment, which can include rehabilitation centers and specialized care facilities, also presents considerable growth opportunities.
Wheel Chair Product Landscape
The wheelchair product landscape is characterized by a continuous stream of innovations focused on enhancing user experience, safety, and adaptability. Manufacturers are increasingly incorporating lightweight yet durable materials like carbon fiber and advanced aluminum alloys to reduce overall weight, improving portability and ease of use. For electric wheelchairs, advancements in battery technology are leading to longer operational ranges and faster charging times, while sophisticated motor systems offer smoother acceleration and deceleration. Smart features, including integrated GPS, fall detection sensors, and connectivity options for remote monitoring by caregivers or healthcare professionals, are becoming more prevalent. Custom wheelchairs continue to be a vital segment, with designs tailored to individual biomechanics, specific medical conditions, and diverse user lifestyles, ensuring optimal comfort and functionality. Performance metrics such as weight capacity, turning radius, maximum speed (for electric models), and battery life are key differentiators, with companies striving to push the boundaries in each area.
Key Drivers, Barriers & Challenges in Wheel Chair
The wheelchair market is propelled by several key drivers. Technological advancements in lightweight materials and battery technology for electric wheelchairs are enhancing performance and usability. Growing government initiatives and healthcare policies promoting accessibility and independent living for individuals with disabilities are creating significant demand. The increasing elderly population globally and the rising prevalence of chronic diseases leading to mobility impairments are fundamental market drivers. Furthermore, growing awareness and acceptance of assistive technologies among consumers are fueling adoption rates.
Key challenges and restraints impacting the wheelchair market include the high cost of advanced electric and custom wheelchairs, which can be a significant barrier for some consumers, especially in developing economies. Stringent regulatory hurdles and lengthy approval processes for new medical devices can slow down innovation and market entry. Supply chain disruptions, as witnessed in recent global events, can impact the availability of components and raw materials, leading to production delays and increased costs. Intense competition from both established players and emerging companies, particularly in price-sensitive segments, puts pressure on profit margins.
Emerging Opportunities in Wheel Chair
Emerging opportunities in the wheelchair sector are abundant, driven by evolving consumer needs and technological frontiers. The integration of Artificial Intelligence (AI) for predictive maintenance, personalized user interfaces, and even autonomous navigation presents a significant growth avenue. Untapped markets in emerging economies with rapidly growing middle classes and increasing healthcare expenditure offer substantial potential. Innovative applications, such as wheelchairs designed for specific outdoor terrains or integrated into smart home ecosystems, are gaining traction. Furthermore, the growing demand for lightweight, foldable, and aesthetically pleasing wheelchairs aligns with shifting consumer preferences towards mobility solutions that blend functionality with lifestyle. The development of modular and upgradable wheelchair systems also presents an opportunity to extend product lifecycles and cater to evolving user needs.
Growth Accelerators in the Wheel Chair Industry
Several factors are acting as significant growth accelerators for the wheelchair industry. Technological breakthroughs in areas like advanced battery management systems, highly efficient electric motors, and sophisticated sensor integration are continuously improving the performance and capabilities of wheelchairs, particularly electric models. Strategic partnerships between wheelchair manufacturers, technology providers, and healthcare institutions are fostering innovation and accelerating the development of integrated mobility solutions. Market expansion strategies, including targeting underserved demographics and geographical regions, are opening up new revenue streams. The increasing focus on user-centric design and customization is also a major accelerator, as it leads to products that better meet the diverse needs of individuals, thereby driving higher adoption and satisfaction rates.
Key Players Shaping the Wheel Chair Market
- DID
- Focaccia
- KSP Italia
- EZ-Access
- Högg
- SANO
- Baronmead
- Antano
- AAT
- Kumalift
- Sugiyasu
- Savaria
- Harmar
- ThyssenKrupp
Notable Milestones in Wheel Chair Sector
- 2019: Introduction of advanced lightweight materials in conventional wheelchairs, improving portability and user handling.
- 2020: Increased focus on smart features in electric wheelchairs, including GPS tracking and remote monitoring capabilities.
- 2021: Significant advancements in battery technology for electric wheelchairs, leading to extended range and faster charging times.
- 2022: Growing integration of AI for enhanced user experience and safety features in next-generation wheelchairs.
- 2023: Increased M&A activity as larger players acquire innovative startups to bolster their product portfolios.
- 2024: Enhanced focus on sustainable manufacturing practices and the use of eco-friendly materials in wheelchair production.
In-Depth Wheel Chair Market Outlook
The future outlook for the wheelchair market is exceptionally promising, driven by sustained growth accelerators and emerging opportunities. The ongoing technological innovation, particularly in electric and smart wheelchair segments, will continue to redefine mobility standards, offering users unprecedented levels of independence and quality of life. Strategic collaborations and expanding into new geographical markets will further fuel this expansion. The increasing demand for personalized and user-centric solutions, coupled with favorable demographic trends, positions the wheelchair industry for significant and long-term growth. Investors and industry stakeholders can anticipate a dynamic and rewarding market characterized by continuous advancements and a strong social impact.
Wheel Chair Segmentation
-
1. Application
- 1.1. Household
- 1.2. Hospital
- 1.3. Old People's Home
- 1.4. Others
-
2. Type
- 2.1. Conventional Wheelchair
- 2.2. Custom Wheelchair
- 2.3. Electric Wheelchair
Wheel Chair Segmentation By Geography
-
1. North America
- 1.1. United States
- 1.2. Canada
- 1.3. Mexico
-
2. South America
- 2.1. Brazil
- 2.2. Argentina
- 2.3. Rest of South America
-
3. Europe
- 3.1. United Kingdom
- 3.2. Germany
- 3.3. France
- 3.4. Italy
- 3.5. Spain
- 3.6. Russia
- 3.7. Benelux
- 3.8. Nordics
- 3.9. Rest of Europe
-
4. Middle East & Africa
- 4.1. Turkey
- 4.2. Israel
- 4.3. GCC
- 4.4. North Africa
- 4.5. South Africa
- 4.6. Rest of Middle East & Africa
-
5. Asia Pacific
- 5.1. China
- 5.2. India
- 5.3. Japan
- 5.4. South Korea
- 5.5. ASEAN
- 5.6. Oceania
- 5.7. Rest of Asia Pacific
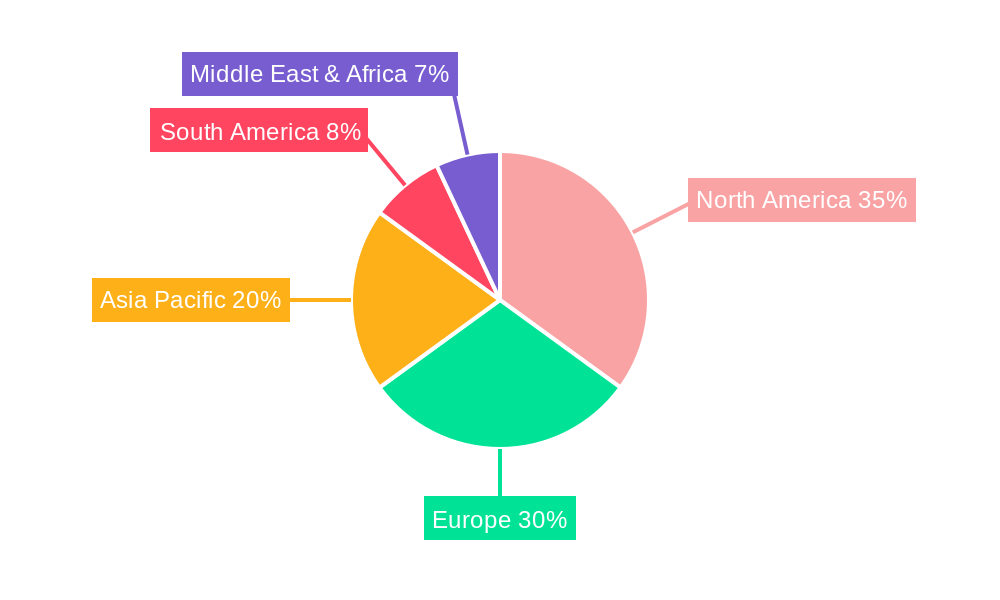
Wheel Chair Regional Market Share
Geographic Coverage of Wheel Chair
Wheel Chair REPORT HIGHLIGHTS
| Aspects | Details |
|---|---|
| Study Period | 2020-2034 |
| Base Year | 2025 |
| Estimated Year | 2026 |
| Forecast Period | 2026-2034 |
| Historical Period | 2020-2025 |
| Growth Rate | CAGR of 7.3% from 2020-2034 |
| Segmentation |
|
Table of Contents
- 1. Introduction
- 1.1. Research Scope
- 1.2. Market Segmentation
- 1.3. Research Methodology
- 1.4. Definitions and Assumptions
- 2. Executive Summary
- 2.1. Introduction
- 3. Market Dynamics
- 3.1. Introduction
- 3.2. Market Drivers
- 3.3. Market Restrains
- 3.4. Market Trends
- 4. Market Factor Analysis
- 4.1. Porters Five Forces
- 4.2. Supply/Value Chain
- 4.3. PESTEL analysis
- 4.4. Market Entropy
- 4.5. Patent/Trademark Analysis
- 5. Global Wheel Chair Analysis, Insights and Forecast, 2020-2032
- 5.1. Market Analysis, Insights and Forecast - by Application
- 5.1.1. Household
- 5.1.2. Hospital
- 5.1.3. Old People's Home
- 5.1.4. Others
- 5.2. Market Analysis, Insights and Forecast - by Type
- 5.2.1. Conventional Wheelchair
- 5.2.2. Custom Wheelchair
- 5.2.3. Electric Wheelchair
- 5.3. Market Analysis, Insights and Forecast - by Region
- 5.3.1. North America
- 5.3.2. South America
- 5.3.3. Europe
- 5.3.4. Middle East & Africa
- 5.3.5. Asia Pacific
- 5.1. Market Analysis, Insights and Forecast - by Application
- 6. North America Wheel Chair Analysis, Insights and Forecast, 2020-2032
- 6.1. Market Analysis, Insights and Forecast - by Application
- 6.1.1. Household
- 6.1.2. Hospital
- 6.1.3. Old People's Home
- 6.1.4. Others
- 6.2. Market Analysis, Insights and Forecast - by Type
- 6.2.1. Conventional Wheelchair
- 6.2.2. Custom Wheelchair
- 6.2.3. Electric Wheelchair
- 6.1. Market Analysis, Insights and Forecast - by Application
- 7. South America Wheel Chair Analysis, Insights and Forecast, 2020-2032
- 7.1. Market Analysis, Insights and Forecast - by Application
- 7.1.1. Household
- 7.1.2. Hospital
- 7.1.3. Old People's Home
- 7.1.4. Others
- 7.2. Market Analysis, Insights and Forecast - by Type
- 7.2.1. Conventional Wheelchair
- 7.2.2. Custom Wheelchair
- 7.2.3. Electric Wheelchair
- 7.1. Market Analysis, Insights and Forecast - by Application
- 8. Europe Wheel Chair Analysis, Insights and Forecast, 2020-2032
- 8.1. Market Analysis, Insights and Forecast - by Application
- 8.1.1. Household
- 8.1.2. Hospital
- 8.1.3. Old People's Home
- 8.1.4. Others
- 8.2. Market Analysis, Insights and Forecast - by Type
- 8.2.1. Conventional Wheelchair
- 8.2.2. Custom Wheelchair
- 8.2.3. Electric Wheelchair
- 8.1. Market Analysis, Insights and Forecast - by Application
- 9. Middle East & Africa Wheel Chair Analysis, Insights and Forecast, 2020-2032
- 9.1. Market Analysis, Insights and Forecast - by Application
- 9.1.1. Household
- 9.1.2. Hospital
- 9.1.3. Old People's Home
- 9.1.4. Others
- 9.2. Market Analysis, Insights and Forecast - by Type
- 9.2.1. Conventional Wheelchair
- 9.2.2. Custom Wheelchair
- 9.2.3. Electric Wheelchair
- 9.1. Market Analysis, Insights and Forecast - by Application
- 10. Asia Pacific Wheel Chair Analysis, Insights and Forecast, 2020-2032
- 10.1. Market Analysis, Insights and Forecast - by Application
- 10.1.1. Household
- 10.1.2. Hospital
- 10.1.3. Old People's Home
- 10.1.4. Others
- 10.2. Market Analysis, Insights and Forecast - by Type
- 10.2.1. Conventional Wheelchair
- 10.2.2. Custom Wheelchair
- 10.2.3. Electric Wheelchair
- 10.1. Market Analysis, Insights and Forecast - by Application
- 11. Competitive Analysis
- 11.1. Global Market Share Analysis 2025
- 11.2. Company Profiles
- 11.2.1 DID
- 11.2.1.1. Overview
- 11.2.1.2. Products
- 11.2.1.3. SWOT Analysis
- 11.2.1.4. Recent Developments
- 11.2.1.5. Financials (Based on Availability)
- 11.2.2 Focaccia
- 11.2.2.1. Overview
- 11.2.2.2. Products
- 11.2.2.3. SWOT Analysis
- 11.2.2.4. Recent Developments
- 11.2.2.5. Financials (Based on Availability)
- 11.2.3 KSP Italia
- 11.2.3.1. Overview
- 11.2.3.2. Products
- 11.2.3.3. SWOT Analysis
- 11.2.3.4. Recent Developments
- 11.2.3.5. Financials (Based on Availability)
- 11.2.4 EZ-Access
- 11.2.4.1. Overview
- 11.2.4.2. Products
- 11.2.4.3. SWOT Analysis
- 11.2.4.4. Recent Developments
- 11.2.4.5. Financials (Based on Availability)
- 11.2.5 Högg
- 11.2.5.1. Overview
- 11.2.5.2. Products
- 11.2.5.3. SWOT Analysis
- 11.2.5.4. Recent Developments
- 11.2.5.5. Financials (Based on Availability)
- 11.2.6 SANO
- 11.2.6.1. Overview
- 11.2.6.2. Products
- 11.2.6.3. SWOT Analysis
- 11.2.6.4. Recent Developments
- 11.2.6.5. Financials (Based on Availability)
- 11.2.7 Baronmead
- 11.2.7.1. Overview
- 11.2.7.2. Products
- 11.2.7.3. SWOT Analysis
- 11.2.7.4. Recent Developments
- 11.2.7.5. Financials (Based on Availability)
- 11.2.8 Antano
- 11.2.8.1. Overview
- 11.2.8.2. Products
- 11.2.8.3. SWOT Analysis
- 11.2.8.4. Recent Developments
- 11.2.8.5. Financials (Based on Availability)
- 11.2.9 AAT
- 11.2.9.1. Overview
- 11.2.9.2. Products
- 11.2.9.3. SWOT Analysis
- 11.2.9.4. Recent Developments
- 11.2.9.5. Financials (Based on Availability)
- 11.2.10 Kumalift
- 11.2.10.1. Overview
- 11.2.10.2. Products
- 11.2.10.3. SWOT Analysis
- 11.2.10.4. Recent Developments
- 11.2.10.5. Financials (Based on Availability)
- 11.2.11 Sugiyasu
- 11.2.11.1. Overview
- 11.2.11.2. Products
- 11.2.11.3. SWOT Analysis
- 11.2.11.4. Recent Developments
- 11.2.11.5. Financials (Based on Availability)
- 11.2.12 Savaria
- 11.2.12.1. Overview
- 11.2.12.2. Products
- 11.2.12.3. SWOT Analysis
- 11.2.12.4. Recent Developments
- 11.2.12.5. Financials (Based on Availability)
- 11.2.13 Harmar
- 11.2.13.1. Overview
- 11.2.13.2. Products
- 11.2.13.3. SWOT Analysis
- 11.2.13.4. Recent Developments
- 11.2.13.5. Financials (Based on Availability)
- 11.2.14 ThyssenKrupp
- 11.2.14.1. Overview
- 11.2.14.2. Products
- 11.2.14.3. SWOT Analysis
- 11.2.14.4. Recent Developments
- 11.2.14.5. Financials (Based on Availability)
- 11.2.1 DID
List of Figures
- Figure 1: Global Wheel Chair Revenue Breakdown (billion, %) by Region 2025 & 2033
- Figure 2: Global Wheel Chair Volume Breakdown (K, %) by Region 2025 & 2033
- Figure 3: North America Wheel Chair Revenue (billion), by Application 2025 & 2033
- Figure 4: North America Wheel Chair Volume (K), by Application 2025 & 2033
- Figure 5: North America Wheel Chair Revenue Share (%), by Application 2025 & 2033
- Figure 6: North America Wheel Chair Volume Share (%), by Application 2025 & 2033
- Figure 7: North America Wheel Chair Revenue (billion), by Type 2025 & 2033
- Figure 8: North America Wheel Chair Volume (K), by Type 2025 & 2033
- Figure 9: North America Wheel Chair Revenue Share (%), by Type 2025 & 2033
- Figure 10: North America Wheel Chair Volume Share (%), by Type 2025 & 2033
- Figure 11: North America Wheel Chair Revenue (billion), by Country 2025 & 2033
- Figure 12: North America Wheel Chair Volume (K), by Country 2025 & 2033
- Figure 13: North America Wheel Chair Revenue Share (%), by Country 2025 & 2033
- Figure 14: North America Wheel Chair Volume Share (%), by Country 2025 & 2033
- Figure 15: South America Wheel Chair Revenue (billion), by Application 2025 & 2033
- Figure 16: South America Wheel Chair Volume (K), by Application 2025 & 2033
- Figure 17: South America Wheel Chair Revenue Share (%), by Application 2025 & 2033
- Figure 18: South America Wheel Chair Volume Share (%), by Application 2025 & 2033
- Figure 19: South America Wheel Chair Revenue (billion), by Type 2025 & 2033
- Figure 20: South America Wheel Chair Volume (K), by Type 2025 & 2033
- Figure 21: South America Wheel Chair Revenue Share (%), by Type 2025 & 2033
- Figure 22: South America Wheel Chair Volume Share (%), by Type 2025 & 2033
- Figure 23: South America Wheel Chair Revenue (billion), by Country 2025 & 2033
- Figure 24: South America Wheel Chair Volume (K), by Country 2025 & 2033
- Figure 25: South America Wheel Chair Revenue Share (%), by Country 2025 & 2033
- Figure 26: South America Wheel Chair Volume Share (%), by Country 2025 & 2033
- Figure 27: Europe Wheel Chair Revenue (billion), by Application 2025 & 2033
- Figure 28: Europe Wheel Chair Volume (K), by Application 2025 & 2033
- Figure 29: Europe Wheel Chair Revenue Share (%), by Application 2025 & 2033
- Figure 30: Europe Wheel Chair Volume Share (%), by Application 2025 & 2033
- Figure 31: Europe Wheel Chair Revenue (billion), by Type 2025 & 2033
- Figure 32: Europe Wheel Chair Volume (K), by Type 2025 & 2033
- Figure 33: Europe Wheel Chair Revenue Share (%), by Type 2025 & 2033
- Figure 34: Europe Wheel Chair Volume Share (%), by Type 2025 & 2033
- Figure 35: Europe Wheel Chair Revenue (billion), by Country 2025 & 2033
- Figure 36: Europe Wheel Chair Volume (K), by Country 2025 & 2033
- Figure 37: Europe Wheel Chair Revenue Share (%), by Country 2025 & 2033
- Figure 38: Europe Wheel Chair Volume Share (%), by Country 2025 & 2033
- Figure 39: Middle East & Africa Wheel Chair Revenue (billion), by Application 2025 & 2033
- Figure 40: Middle East & Africa Wheel Chair Volume (K), by Application 2025 & 2033
- Figure 41: Middle East & Africa Wheel Chair Revenue Share (%), by Application 2025 & 2033
- Figure 42: Middle East & Africa Wheel Chair Volume Share (%), by Application 2025 & 2033
- Figure 43: Middle East & Africa Wheel Chair Revenue (billion), by Type 2025 & 2033
- Figure 44: Middle East & Africa Wheel Chair Volume (K), by Type 2025 & 2033
- Figure 45: Middle East & Africa Wheel Chair Revenue Share (%), by Type 2025 & 2033
- Figure 46: Middle East & Africa Wheel Chair Volume Share (%), by Type 2025 & 2033
- Figure 47: Middle East & Africa Wheel Chair Revenue (billion), by Country 2025 & 2033
- Figure 48: Middle East & Africa Wheel Chair Volume (K), by Country 2025 & 2033
- Figure 49: Middle East & Africa Wheel Chair Revenue Share (%), by Country 2025 & 2033
- Figure 50: Middle East & Africa Wheel Chair Volume Share (%), by Country 2025 & 2033
- Figure 51: Asia Pacific Wheel Chair Revenue (billion), by Application 2025 & 2033
- Figure 52: Asia Pacific Wheel Chair Volume (K), by Application 2025 & 2033
- Figure 53: Asia Pacific Wheel Chair Revenue Share (%), by Application 2025 & 2033
- Figure 54: Asia Pacific Wheel Chair Volume Share (%), by Application 2025 & 2033
- Figure 55: Asia Pacific Wheel Chair Revenue (billion), by Type 2025 & 2033
- Figure 56: Asia Pacific Wheel Chair Volume (K), by Type 2025 & 2033
- Figure 57: Asia Pacific Wheel Chair Revenue Share (%), by Type 2025 & 2033
- Figure 58: Asia Pacific Wheel Chair Volume Share (%), by Type 2025 & 2033
- Figure 59: Asia Pacific Wheel Chair Revenue (billion), by Country 2025 & 2033
- Figure 60: Asia Pacific Wheel Chair Volume (K), by Country 2025 & 2033
- Figure 61: Asia Pacific Wheel Chair Revenue Share (%), by Country 2025 & 2033
- Figure 62: Asia Pacific Wheel Chair Volume Share (%), by Country 2025 & 2033
List of Tables
- Table 1: Global Wheel Chair Revenue billion Forecast, by Application 2020 & 2033
- Table 2: Global Wheel Chair Volume K Forecast, by Application 2020 & 2033
- Table 3: Global Wheel Chair Revenue billion Forecast, by Type 2020 & 2033
- Table 4: Global Wheel Chair Volume K Forecast, by Type 2020 & 2033
- Table 5: Global Wheel Chair Revenue billion Forecast, by Region 2020 & 2033
- Table 6: Global Wheel Chair Volume K Forecast, by Region 2020 & 2033
- Table 7: Global Wheel Chair Revenue billion Forecast, by Application 2020 & 2033
- Table 8: Global Wheel Chair Volume K Forecast, by Application 2020 & 2033
- Table 9: Global Wheel Chair Revenue billion Forecast, by Type 2020 & 2033
- Table 10: Global Wheel Chair Volume K Forecast, by Type 2020 & 2033
- Table 11: Global Wheel Chair Revenue billion Forecast, by Country 2020 & 2033
- Table 12: Global Wheel Chair Volume K Forecast, by Country 2020 & 2033
- Table 13: United States Wheel Chair Revenue (billion) Forecast, by Application 2020 & 2033
- Table 14: United States Wheel Chair Volume (K) Forecast, by Application 2020 & 2033
- Table 15: Canada Wheel Chair Revenue (billion) Forecast, by Application 2020 & 2033
- Table 16: Canada Wheel Chair Volume (K) Forecast, by Application 2020 & 2033
- Table 17: Mexico Wheel Chair Revenue (billion) Forecast, by Application 2020 & 2033
- Table 18: Mexico Wheel Chair Volume (K) Forecast, by Application 2020 & 2033
- Table 19: Global Wheel Chair Revenue billion Forecast, by Application 2020 & 2033
- Table 20: Global Wheel Chair Volume K Forecast, by Application 2020 & 2033
- Table 21: Global Wheel Chair Revenue billion Forecast, by Type 2020 & 2033
- Table 22: Global Wheel Chair Volume K Forecast, by Type 2020 & 2033
- Table 23: Global Wheel Chair Revenue billion Forecast, by Country 2020 & 2033
- Table 24: Global Wheel Chair Volume K Forecast, by Country 2020 & 2033
- Table 25: Brazil Wheel Chair Revenue (billion) Forecast, by Application 2020 & 2033
- Table 26: Brazil Wheel Chair Volume (K) Forecast, by Application 2020 & 2033
- Table 27: Argentina Wheel Chair Revenue (billion) Forecast, by Application 2020 & 2033
- Table 28: Argentina Wheel Chair Volume (K) Forecast, by Application 2020 & 2033
- Table 29: Rest of South America Wheel Chair Revenue (billion) Forecast, by Application 2020 & 2033
- Table 30: Rest of South America Wheel Chair Volume (K) Forecast, by Application 2020 & 2033
- Table 31: Global Wheel Chair Revenue billion Forecast, by Application 2020 & 2033
- Table 32: Global Wheel Chair Volume K Forecast, by Application 2020 & 2033
- Table 33: Global Wheel Chair Revenue billion Forecast, by Type 2020 & 2033
- Table 34: Global Wheel Chair Volume K Forecast, by Type 2020 & 2033
- Table 35: Global Wheel Chair Revenue billion Forecast, by Country 2020 & 2033
- Table 36: Global Wheel Chair Volume K Forecast, by Country 2020 & 2033
- Table 37: United Kingdom Wheel Chair Revenue (billion) Forecast, by Application 2020 & 2033
- Table 38: United Kingdom Wheel Chair Volume (K) Forecast, by Application 2020 & 2033
- Table 39: Germany Wheel Chair Revenue (billion) Forecast, by Application 2020 & 2033
- Table 40: Germany Wheel Chair Volume (K) Forecast, by Application 2020 & 2033
- Table 41: France Wheel Chair Revenue (billion) Forecast, by Application 2020 & 2033
- Table 42: France Wheel Chair Volume (K) Forecast, by Application 2020 & 2033
- Table 43: Italy Wheel Chair Revenue (billion) Forecast, by Application 2020 & 2033
- Table 44: Italy Wheel Chair Volume (K) Forecast, by Application 2020 & 2033
- Table 45: Spain Wheel Chair Revenue (billion) Forecast, by Application 2020 & 2033
- Table 46: Spain Wheel Chair Volume (K) Forecast, by Application 2020 & 2033
- Table 47: Russia Wheel Chair Revenue (billion) Forecast, by Application 2020 & 2033
- Table 48: Russia Wheel Chair Volume (K) Forecast, by Application 2020 & 2033
- Table 49: Benelux Wheel Chair Revenue (billion) Forecast, by Application 2020 & 2033
- Table 50: Benelux Wheel Chair Volume (K) Forecast, by Application 2020 & 2033
- Table 51: Nordics Wheel Chair Revenue (billion) Forecast, by Application 2020 & 2033
- Table 52: Nordics Wheel Chair Volume (K) Forecast, by Application 2020 & 2033
- Table 53: Rest of Europe Wheel Chair Revenue (billion) Forecast, by Application 2020 & 2033
- Table 54: Rest of Europe Wheel Chair Volume (K) Forecast, by Application 2020 & 2033
- Table 55: Global Wheel Chair Revenue billion Forecast, by Application 2020 & 2033
- Table 56: Global Wheel Chair Volume K Forecast, by Application 2020 & 2033
- Table 57: Global Wheel Chair Revenue billion Forecast, by Type 2020 & 2033
- Table 58: Global Wheel Chair Volume K Forecast, by Type 2020 & 2033
- Table 59: Global Wheel Chair Revenue billion Forecast, by Country 2020 & 2033
- Table 60: Global Wheel Chair Volume K Forecast, by Country 2020 & 2033
- Table 61: Turkey Wheel Chair Revenue (billion) Forecast, by Application 2020 & 2033
- Table 62: Turkey Wheel Chair Volume (K) Forecast, by Application 2020 & 2033
- Table 63: Israel Wheel Chair Revenue (billion) Forecast, by Application 2020 & 2033
- Table 64: Israel Wheel Chair Volume (K) Forecast, by Application 2020 & 2033
- Table 65: GCC Wheel Chair Revenue (billion) Forecast, by Application 2020 & 2033
- Table 66: GCC Wheel Chair Volume (K) Forecast, by Application 2020 & 2033
- Table 67: North Africa Wheel Chair Revenue (billion) Forecast, by Application 2020 & 2033
- Table 68: North Africa Wheel Chair Volume (K) Forecast, by Application 2020 & 2033
- Table 69: South Africa Wheel Chair Revenue (billion) Forecast, by Application 2020 & 2033
- Table 70: South Africa Wheel Chair Volume (K) Forecast, by Application 2020 & 2033
- Table 71: Rest of Middle East & Africa Wheel Chair Revenue (billion) Forecast, by Application 2020 & 2033
- Table 72: Rest of Middle East & Africa Wheel Chair Volume (K) Forecast, by Application 2020 & 2033
- Table 73: Global Wheel Chair Revenue billion Forecast, by Application 2020 & 2033
- Table 74: Global Wheel Chair Volume K Forecast, by Application 2020 & 2033
- Table 75: Global Wheel Chair Revenue billion Forecast, by Type 2020 & 2033
- Table 76: Global Wheel Chair Volume K Forecast, by Type 2020 & 2033
- Table 77: Global Wheel Chair Revenue billion Forecast, by Country 2020 & 2033
- Table 78: Global Wheel Chair Volume K Forecast, by Country 2020 & 2033
- Table 79: China Wheel Chair Revenue (billion) Forecast, by Application 2020 & 2033
- Table 80: China Wheel Chair Volume (K) Forecast, by Application 2020 & 2033
- Table 81: India Wheel Chair Revenue (billion) Forecast, by Application 2020 & 2033
- Table 82: India Wheel Chair Volume (K) Forecast, by Application 2020 & 2033
- Table 83: Japan Wheel Chair Revenue (billion) Forecast, by Application 2020 & 2033
- Table 84: Japan Wheel Chair Volume (K) Forecast, by Application 2020 & 2033
- Table 85: South Korea Wheel Chair Revenue (billion) Forecast, by Application 2020 & 2033
- Table 86: South Korea Wheel Chair Volume (K) Forecast, by Application 2020 & 2033
- Table 87: ASEAN Wheel Chair Revenue (billion) Forecast, by Application 2020 & 2033
- Table 88: ASEAN Wheel Chair Volume (K) Forecast, by Application 2020 & 2033
- Table 89: Oceania Wheel Chair Revenue (billion) Forecast, by Application 2020 & 2033
- Table 90: Oceania Wheel Chair Volume (K) Forecast, by Application 2020 & 2033
- Table 91: Rest of Asia Pacific Wheel Chair Revenue (billion) Forecast, by Application 2020 & 2033
- Table 92: Rest of Asia Pacific Wheel Chair Volume (K) Forecast, by Application 2020 & 2033
Frequently Asked Questions
1. What is the projected Compound Annual Growth Rate (CAGR) of the Wheel Chair?
The projected CAGR is approximately 7.3%.
2. Which companies are prominent players in the Wheel Chair?
Key companies in the market include DID, Focaccia, KSP Italia, EZ-Access, Högg, SANO, Baronmead, Antano, AAT, Kumalift, Sugiyasu, Savaria, Harmar, ThyssenKrupp.
3. What are the main segments of the Wheel Chair?
The market segments include Application, Type.
4. Can you provide details about the market size?
The market size is estimated to be USD 7.42 billion as of 2022.
5. What are some drivers contributing to market growth?
N/A
6. What are the notable trends driving market growth?
N/A
7. Are there any restraints impacting market growth?
N/A
8. Can you provide examples of recent developments in the market?
N/A
9. What pricing options are available for accessing the report?
Pricing options include single-user, multi-user, and enterprise licenses priced at USD 3950.00, USD 5925.00, and USD 7900.00 respectively.
10. Is the market size provided in terms of value or volume?
The market size is provided in terms of value, measured in billion and volume, measured in K.
11. Are there any specific market keywords associated with the report?
Yes, the market keyword associated with the report is "Wheel Chair," which aids in identifying and referencing the specific market segment covered.
12. How do I determine which pricing option suits my needs best?
The pricing options vary based on user requirements and access needs. Individual users may opt for single-user licenses, while businesses requiring broader access may choose multi-user or enterprise licenses for cost-effective access to the report.
13. Are there any additional resources or data provided in the Wheel Chair report?
While the report offers comprehensive insights, it's advisable to review the specific contents or supplementary materials provided to ascertain if additional resources or data are available.
14. How can I stay updated on further developments or reports in the Wheel Chair?
To stay informed about further developments, trends, and reports in the Wheel Chair, consider subscribing to industry newsletters, following relevant companies and organizations, or regularly checking reputable industry news sources and publications.
Methodology
Step 1 - Identification of Relevant Samples Size from Population Database


Step 2 - Approaches for Defining Global Market Size (Value, Volume* & Price*)

Note*: In applicable scenarios
Step 3 - Data Sources
Primary Research
- Web Analytics
- Survey Reports
- Research Institute
- Latest Research Reports
- Opinion Leaders
Secondary Research
- Annual Reports
- White Paper
- Latest Press Release
- Industry Association
- Paid Database
- Investor Presentations

Step 4 - Data Triangulation
Involves using different sources of information in order to increase the validity of a study
These sources are likely to be stakeholders in a program - participants, other researchers, program staff, other community members, and so on.
Then we put all data in single framework & apply various statistical tools to find out the dynamic on the market.
During the analysis stage, feedback from the stakeholder groups would be compared to determine areas of agreement as well as areas of divergence