


Key Insights
The global wearable sleep tracker market is poised for significant expansion, projected to reach an estimated market size of $12,500 million by 2025, with a robust Compound Annual Growth Rate (CAGR) of 18.5% anticipated throughout the forecast period of 2025-2033. This impressive growth is fueled by a confluence of escalating consumer awareness regarding the importance of sleep health and the increasing sophistication of wearable technology. As individuals become more proactive in managing their well-being, the demand for devices that offer insightful data on sleep patterns, duration, and quality continues to surge. The integration of advanced sensors, artificial intelligence, and machine learning algorithms within smart bands and smartwatches is enabling these devices to provide personalized sleep coaching and actionable recommendations, further driving adoption. Key market drivers include the rising prevalence of sleep disorders, a growing aging population that is more susceptible to sleep disturbances, and the expanding disposable incomes that allow for investment in health-monitoring gadgets. The integration of these trackers into broader health and wellness ecosystems, including fitness apps and telehealth platforms, is also a significant growth catalyst.
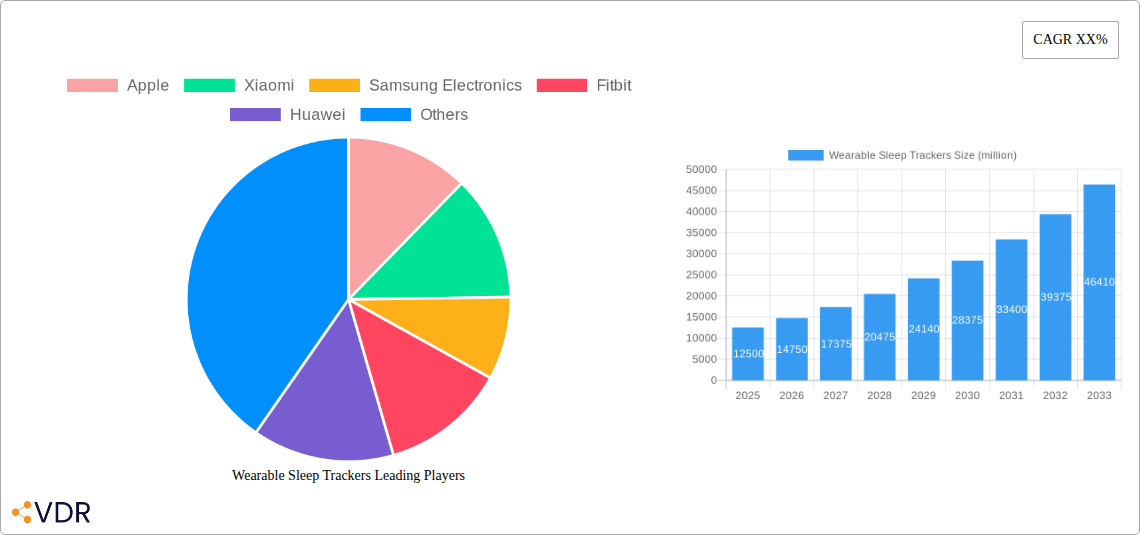
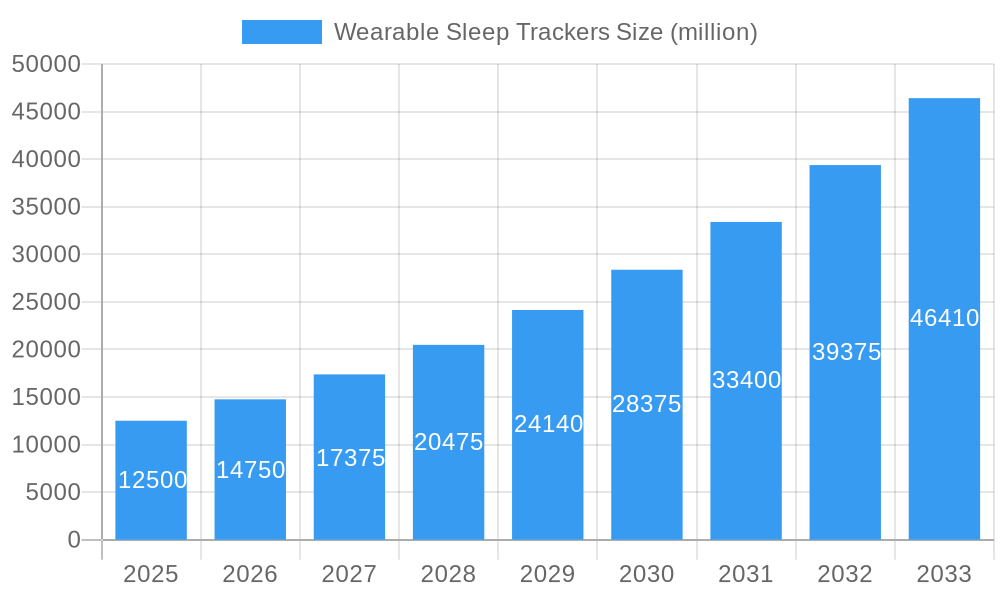
Wearable Sleep Trackers Market Size (In Billion)

The market segmentation reveals a strong preference for smartwatches over smart bands, with smartwatches accounting for approximately 65% of the market share in 2025, driven by their multi-functionality and premium appeal. Online sales channels are dominating the distribution landscape, expected to capture around 70% of the market share in 2025 due to their convenience, wider product selection, and competitive pricing. Geographically, the Asia Pacific region is emerging as a high-growth market, projected to witness a CAGR of over 20% during the forecast period, propelled by a burgeoning middle class, increasing health consciousness, and rapid technological adoption in countries like China and India. North America and Europe remain established markets with significant penetration rates, driven by early adoption and a mature wellness culture. However, the market faces certain restraints, including data privacy concerns, the accuracy limitations of some lower-end devices, and the relatively high cost of advanced models, which could impede widespread adoption in price-sensitive regions.
Wearable Sleep Trackers Company Market Share
Wearable Sleep Trackers Market Dynamics & Structure
The global wearable sleep trackers market is characterized by a moderately concentrated competitive landscape, with leading players like Apple, Xiaomi, Samsung Electronics, and Fitbit holding significant market shares. Technological innovation serves as a primary driver, with continuous advancements in sensor accuracy, battery life, and data analysis capabilities fueling adoption. Regulatory frameworks are evolving to address data privacy and security concerns associated with health-related information collected by these devices, impacting product development and market entry strategies. Competitive product substitutes, including advanced smartphone apps and dedicated sleep monitoring devices, present a growing challenge, forcing manufacturers to differentiate through enhanced features and integrated ecosystem solutions.
- Market Concentration: Top 5 players account for approximately 65% of the global market share in 2025.
- Technological Innovation Drivers: Enhanced biometric sensors (e.g., PPG, accelerometers), AI-powered sleep analysis algorithms, and improved user interface design.
- Regulatory Frameworks: Growing emphasis on data privacy regulations (e.g., GDPR, CCPA) and medical device certifications for advanced sleep tracking features.
- Competitive Product Substitutes: Advanced sleep tracking apps, bedside sleep monitors, and smart home devices with sleep monitoring capabilities.
- End-User Demographics: Increasing demand from health-conscious consumers, athletes, individuals with sleep disorders, and the aging population.
- M&A Trends: Strategic acquisitions aimed at acquiring advanced technology or expanding market reach, with an estimated xx M&A deals in the historical period.
Wearable Sleep Trackers Growth Trends & Insights
The global wearable sleep trackers market is poised for robust expansion, driven by escalating health consciousness and a deeper understanding of sleep's critical role in overall well-being. Market size is projected to witness a Compound Annual Growth Rate (CAGR) of approximately 18.5% from 2025 to 2033, a significant upward trajectory fueled by increasing disposable incomes and a growing prevalence of sleep-related health issues. Adoption rates are rapidly accelerating, moving beyond niche early adopters to mainstream consumers actively seeking to monitor and improve their sleep patterns. This surge is underpinned by widespread smartphone penetration and the integration of sleep tracking functionalities into a broader range of wearable devices, making them more accessible and appealing.
Technological disruptions are continuously reshaping the market. Beyond basic sleep stage detection, newer devices are incorporating advanced features such as blood oxygen monitoring, heart rate variability (HRV) analysis, and even rudimentary electrocardiogram (ECG) capabilities, offering a more holistic view of sleep health. Artificial intelligence (AI) and machine learning (ML) are playing a pivotal role in refining sleep scoring accuracy and providing personalized insights and recommendations, transforming raw data into actionable advice for users. Consumer behavior shifts are equally instrumental; individuals are increasingly proactive about their health, viewing wearable sleep trackers not just as gadgets but as essential tools for self-improvement and preventative healthcare. This evolving perception translates into higher demand for devices that offer not only data but also meaningful guidance, fostering a more engaged user base. The market penetration for wearable sleep trackers is expected to climb from an estimated 25% in 2025 to over 50% by 2033 in developed economies, reflecting this growing acceptance and integration into daily life.
Dominant Regions, Countries, or Segments in Wearable Sleep Trackers
North America currently stands as the dominant region in the global wearable sleep trackers market, driven by a confluence of high disposable incomes, a deeply ingrained culture of health and wellness, and early adoption of technological innovations. The United States, in particular, represents a significant portion of this regional dominance, fueled by robust healthcare infrastructure, a high prevalence of chronic diseases where sleep quality is a concern, and substantial investment in R&D by major technology companies. The robust online sales infrastructure in the US and Canada, coupled with a strong preference for smartwatches and smart bands, further solidifies North America's leadership position.
- Leading Region: North America, with an estimated market share of 35% in 2025.
- Key Country: United States, accounting for approximately 70% of the North American market.
- Dominant Application Segment: Online Sales, representing over 60% of the market in 2025, due to convenient purchasing, wider product selection, and competitive pricing.
- Emerging Application Segment: Offline Sales are expected to grow at a faster CAGR of 19.2% from 2025-2033, driven by increased retail presence and experiential marketing.
- Dominant Type Segment: Smart Bands, holding approximately 55% of the market in 2025, are favored for their affordability and focused sleep tracking features.
- Growing Type Segment: Smart Watches are projected to witness a CAGR of 20.5% during the forecast period, driven by their multi-functional capabilities and integration into existing smart ecosystems.
- Growth Drivers in North America: High consumer spending on health tech, advanced digital infrastructure, and a strong awareness of sleep's impact on productivity and health.
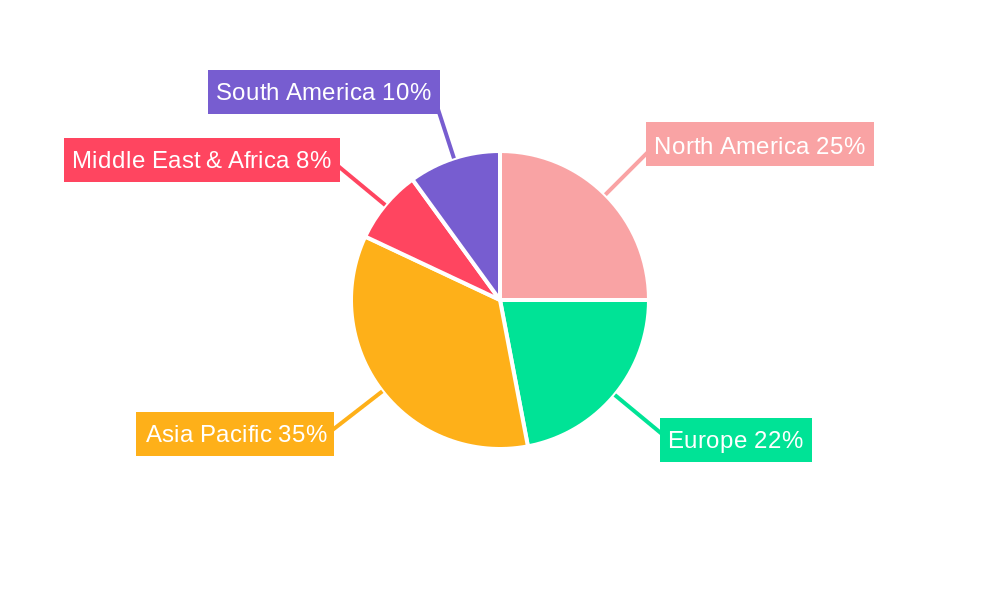
- Market Share in 2025: North America (35%), Europe (28%), Asia Pacific (25%), Rest of the World (12%).
Wearable Sleep Trackers Product Landscape
The wearable sleep trackers product landscape is defined by a relentless pursuit of accuracy, comfort, and actionable insights. Innovations are centered around miniaturization of advanced sensors, enabling devices like smart bands and smartwatches to unobtrusively monitor heart rate, respiration, blood oxygen levels (SpO2), and body temperature. Advanced algorithms powered by artificial intelligence analyze these metrics alongside movement data to provide detailed sleep stage breakdowns (light, deep, REM) and detect potential sleep disturbances like apnea. Companies are differentiating through unique selling propositions such as long-duration battery life (up to 14 days on some models), water resistance for uninterrupted tracking, and seamless integration with comprehensive health and fitness ecosystems. The focus is shifting from mere data presentation to personalized coaching and predictive health insights.
Key Drivers, Barriers & Challenges in Wearable Sleep Trackers
Key Drivers:
- Rising Health and Wellness Awareness: Consumers are increasingly prioritizing sleep as a critical component of overall health, driving demand for monitoring solutions.
- Technological Advancements: Improved sensor accuracy, AI-driven analytics, and enhanced user interfaces make sleep trackers more appealing and effective.
- Growing Prevalence of Sleep Disorders: Increasing diagnoses of insomnia, sleep apnea, and other sleep-related conditions spur interest in diagnostic and monitoring tools.
- Smartphone Integration & Ecosystem Growth: Seamless integration with smartphones and broader health platforms enhances user convenience and data accessibility.
Barriers & Challenges:
- Data Accuracy and Reliability Concerns: Consumer skepticism regarding the precision of consumer-grade trackers compared to clinical sleep studies.
- Privacy and Data Security Issues: Concerns over the sensitive health data collected by wearables and its potential misuse.
- High Cost of Advanced Devices: Premium features and cutting-edge technology can lead to higher price points, limiting affordability for some segments.
- Competition from Free and Low-Cost Alternatives: The availability of free smartphone apps and basic fitness trackers offers a substitute for some users.
- Supply Chain Disruptions: Global chip shortages and logistical challenges can impact production and availability. The estimated impact of supply chain issues on market growth is around 3% annually.
Emerging Opportunities in Wearable Sleep Trackers
Emerging opportunities in the wearable sleep trackers market lie in the untapped potential of personalized sleep coaching powered by AI, moving beyond mere data collection to proactive intervention. The integration of sleep tracking with mental wellness applications presents a significant avenue, addressing the bidirectional relationship between sleep and psychological health. Furthermore, the expansion into emerging economies with a growing middle class and increasing health awareness offers substantial market penetration potential. Developing specialized sleep tracking solutions for specific demographic groups, such as athletes seeking performance optimization or individuals managing chronic conditions like diabetes, also represents a promising niche.
Growth Accelerators in the Wearable Sleep Trackers Industry
The wearable sleep trackers industry is experiencing accelerated growth due to several key catalysts. Technological breakthroughs in non-invasive biosensing, including advanced optical sensors and miniaturized accelerometers, are continually enhancing device capabilities. Strategic partnerships between wearable manufacturers and healthcare providers, or insurance companies, are fostering the development of integrated health solutions and promoting preventative care. Market expansion strategies, including the penetration of new geographical markets and the introduction of more affordable product tiers, are broadening the consumer base. The increasing focus by major tech giants on health and wellness as a core competency further fuels innovation and marketing efforts, driving widespread adoption.
Key Players Shaping the Wearable Sleep Trackers Market
- Apple
- Xiaomi
- Samsung Electronics
- Fitbit
- Huawei
- Garmin
- Philips
- Polar
- Lifesense
- Huami (Amazfit)
- Oppo
- Dido
Notable Milestones in Wearable Sleep Trackers Sector
- 2019: Fitbit launches Charge 3 Special Edition, enhancing sleep tracking with SpO2 monitoring, a step towards advanced sleep health analysis.
- 2020: Apple introduces Apple Watch Series 6, integrating Blood Oxygen sensing capabilities, expanding its health suite to include sleep-related metrics.
- 2021: Samsung unveils Galaxy Watch 4, featuring advanced sleep tracking and snoring detection, emphasizing comprehensive sleep health management.
- 2022: Xiaomi launches the Mi Smart Band 7 Pro, offering improved battery life and a wider array of health tracking features, including sleep monitoring.
- 2023: Garmin introduces Vivosmart 5, focusing on user-friendly interface and advanced sleep insights for a broader audience.
- 2024: Huami (Amazfit) releases new models with enhanced AI-driven sleep analysis and personalized coaching features, pushing the boundaries of actionable sleep insights.
In-Depth Wearable Sleep Trackers Market Outlook
The future of the wearable sleep trackers market is exceptionally promising, driven by an intensifying global focus on preventative healthcare and personal wellness. Continued advancements in sensor technology and artificial intelligence will unlock deeper insights into sleep health, enabling predictive diagnostics and personalized sleep interventions. Strategic collaborations between technology firms and healthcare organizations will further legitimize these devices as essential health monitoring tools. The expansion of connected health ecosystems, where sleep data seamlessly integrates with other health and fitness metrics, will enhance user engagement and value proposition. This convergence of technology, healthcare, and consumer demand is set to create a sustained growth trajectory, with market potential estimated to reach xx billion units by 2033.
Wearable Sleep Trackers Segmentation
-
1. Application
- 1.1. Online Sales
- 1.2. Offline Sales
-
2. Types
- 2.1. Smart Band
- 2.2. Smart Watch
Wearable Sleep Trackers Segmentation By Geography
-
1. North America
- 1.1. United States
- 1.2. Canada
- 1.3. Mexico
-
2. South America
- 2.1. Brazil
- 2.2. Argentina
- 2.3. Rest of South America
-
3. Europe
- 3.1. United Kingdom
- 3.2. Germany
- 3.3. France
- 3.4. Italy
- 3.5. Spain
- 3.6. Russia
- 3.7. Benelux
- 3.8. Nordics
- 3.9. Rest of Europe
-
4. Middle East & Africa
- 4.1. Turkey
- 4.2. Israel
- 4.3. GCC
- 4.4. North Africa
- 4.5. South Africa
- 4.6. Rest of Middle East & Africa
-
5. Asia Pacific
- 5.1. China
- 5.2. India
- 5.3. Japan
- 5.4. South Korea
- 5.5. ASEAN
- 5.6. Oceania
- 5.7. Rest of Asia Pacific
Wearable Sleep Trackers Regional Market Share
Geographic Coverage of Wearable Sleep Trackers
Wearable Sleep Trackers REPORT HIGHLIGHTS
| Aspects | Details |
|---|---|
| Study Period | 2020-2034 |
| Base Year | 2025 |
| Estimated Year | 2026 |
| Forecast Period | 2026-2034 |
| Historical Period | 2020-2025 |
| Growth Rate | CAGR of 4.5% from 2020-2034 |
| Segmentation |
|
Table of Contents
- 1. Introduction
- 1.1. Research Scope
- 1.2. Market Segmentation
- 1.3. Research Methodology
- 1.4. Definitions and Assumptions
- 2. Executive Summary
- 2.1. Introduction
- 3. Market Dynamics
- 3.1. Introduction
- 3.2. Market Drivers
- 3.3. Market Restrains
- 3.4. Market Trends
- 4. Market Factor Analysis
- 4.1. Porters Five Forces
- 4.2. Supply/Value Chain
- 4.3. PESTEL analysis
- 4.4. Market Entropy
- 4.5. Patent/Trademark Analysis
- 5. Global Wearable Sleep Trackers Analysis, Insights and Forecast, 2020-2032
- 5.1. Market Analysis, Insights and Forecast - by Application
- 5.1.1. Online Sales
- 5.1.2. Offline Sales
- 5.2. Market Analysis, Insights and Forecast - by Types
- 5.2.1. Smart Band
- 5.2.2. Smart Watch
- 5.3. Market Analysis, Insights and Forecast - by Region
- 5.3.1. North America
- 5.3.2. South America
- 5.3.3. Europe
- 5.3.4. Middle East & Africa
- 5.3.5. Asia Pacific
- 5.1. Market Analysis, Insights and Forecast - by Application
- 6. North America Wearable Sleep Trackers Analysis, Insights and Forecast, 2020-2032
- 6.1. Market Analysis, Insights and Forecast - by Application
- 6.1.1. Online Sales
- 6.1.2. Offline Sales
- 6.2. Market Analysis, Insights and Forecast - by Types
- 6.2.1. Smart Band
- 6.2.2. Smart Watch
- 6.1. Market Analysis, Insights and Forecast - by Application
- 7. South America Wearable Sleep Trackers Analysis, Insights and Forecast, 2020-2032
- 7.1. Market Analysis, Insights and Forecast - by Application
- 7.1.1. Online Sales
- 7.1.2. Offline Sales
- 7.2. Market Analysis, Insights and Forecast - by Types
- 7.2.1. Smart Band
- 7.2.2. Smart Watch
- 7.1. Market Analysis, Insights and Forecast - by Application
- 8. Europe Wearable Sleep Trackers Analysis, Insights and Forecast, 2020-2032
- 8.1. Market Analysis, Insights and Forecast - by Application
- 8.1.1. Online Sales
- 8.1.2. Offline Sales
- 8.2. Market Analysis, Insights and Forecast - by Types
- 8.2.1. Smart Band
- 8.2.2. Smart Watch
- 8.1. Market Analysis, Insights and Forecast - by Application
- 9. Middle East & Africa Wearable Sleep Trackers Analysis, Insights and Forecast, 2020-2032
- 9.1. Market Analysis, Insights and Forecast - by Application
- 9.1.1. Online Sales
- 9.1.2. Offline Sales
- 9.2. Market Analysis, Insights and Forecast - by Types
- 9.2.1. Smart Band
- 9.2.2. Smart Watch
- 9.1. Market Analysis, Insights and Forecast - by Application
- 10. Asia Pacific Wearable Sleep Trackers Analysis, Insights and Forecast, 2020-2032
- 10.1. Market Analysis, Insights and Forecast - by Application
- 10.1.1. Online Sales
- 10.1.2. Offline Sales
- 10.2. Market Analysis, Insights and Forecast - by Types
- 10.2.1. Smart Band
- 10.2.2. Smart Watch
- 10.1. Market Analysis, Insights and Forecast - by Application
- 11. Competitive Analysis
- 11.1. Global Market Share Analysis 2025
- 11.2. Company Profiles
- 11.2.1 Apple
- 11.2.1.1. Overview
- 11.2.1.2. Products
- 11.2.1.3. SWOT Analysis
- 11.2.1.4. Recent Developments
- 11.2.1.5. Financials (Based on Availability)
- 11.2.2 Xiaomi
- 11.2.2.1. Overview
- 11.2.2.2. Products
- 11.2.2.3. SWOT Analysis
- 11.2.2.4. Recent Developments
- 11.2.2.5. Financials (Based on Availability)
- 11.2.3 Samsung Electronics
- 11.2.3.1. Overview
- 11.2.3.2. Products
- 11.2.3.3. SWOT Analysis
- 11.2.3.4. Recent Developments
- 11.2.3.5. Financials (Based on Availability)
- 11.2.4 Fitbit
- 11.2.4.1. Overview
- 11.2.4.2. Products
- 11.2.4.3. SWOT Analysis
- 11.2.4.4. Recent Developments
- 11.2.4.5. Financials (Based on Availability)
- 11.2.5 Huawei
- 11.2.5.1. Overview
- 11.2.5.2. Products
- 11.2.5.3. SWOT Analysis
- 11.2.5.4. Recent Developments
- 11.2.5.5. Financials (Based on Availability)
- 11.2.6 Garmin
- 11.2.6.1. Overview
- 11.2.6.2. Products
- 11.2.6.3. SWOT Analysis
- 11.2.6.4. Recent Developments
- 11.2.6.5. Financials (Based on Availability)
- 11.2.7 Phillips
- 11.2.7.1. Overview
- 11.2.7.2. Products
- 11.2.7.3. SWOT Analysis
- 11.2.7.4. Recent Developments
- 11.2.7.5. Financials (Based on Availability)
- 11.2.8 Polar
- 11.2.8.1. Overview
- 11.2.8.2. Products
- 11.2.8.3. SWOT Analysis
- 11.2.8.4. Recent Developments
- 11.2.8.5. Financials (Based on Availability)
- 11.2.9 Lifesense
- 11.2.9.1. Overview
- 11.2.9.2. Products
- 11.2.9.3. SWOT Analysis
- 11.2.9.4. Recent Developments
- 11.2.9.5. Financials (Based on Availability)
- 11.2.10 Huami (Amazfit)
- 11.2.10.1. Overview
- 11.2.10.2. Products
- 11.2.10.3. SWOT Analysis
- 11.2.10.4. Recent Developments
- 11.2.10.5. Financials (Based on Availability)
- 11.2.11 Oppo
- 11.2.11.1. Overview
- 11.2.11.2. Products
- 11.2.11.3. SWOT Analysis
- 11.2.11.4. Recent Developments
- 11.2.11.5. Financials (Based on Availability)
- 11.2.12 Dido
- 11.2.12.1. Overview
- 11.2.12.2. Products
- 11.2.12.3. SWOT Analysis
- 11.2.12.4. Recent Developments
- 11.2.12.5. Financials (Based on Availability)
- 11.2.1 Apple
List of Figures
- Figure 1: Global Wearable Sleep Trackers Revenue Breakdown (undefined, %) by Region 2025 & 2033
- Figure 2: North America Wearable Sleep Trackers Revenue (undefined), by Application 2025 & 2033
- Figure 3: North America Wearable Sleep Trackers Revenue Share (%), by Application 2025 & 2033
- Figure 4: North America Wearable Sleep Trackers Revenue (undefined), by Types 2025 & 2033
- Figure 5: North America Wearable Sleep Trackers Revenue Share (%), by Types 2025 & 2033
- Figure 6: North America Wearable Sleep Trackers Revenue (undefined), by Country 2025 & 2033
- Figure 7: North America Wearable Sleep Trackers Revenue Share (%), by Country 2025 & 2033
- Figure 8: South America Wearable Sleep Trackers Revenue (undefined), by Application 2025 & 2033
- Figure 9: South America Wearable Sleep Trackers Revenue Share (%), by Application 2025 & 2033
- Figure 10: South America Wearable Sleep Trackers Revenue (undefined), by Types 2025 & 2033
- Figure 11: South America Wearable Sleep Trackers Revenue Share (%), by Types 2025 & 2033
- Figure 12: South America Wearable Sleep Trackers Revenue (undefined), by Country 2025 & 2033
- Figure 13: South America Wearable Sleep Trackers Revenue Share (%), by Country 2025 & 2033
- Figure 14: Europe Wearable Sleep Trackers Revenue (undefined), by Application 2025 & 2033
- Figure 15: Europe Wearable Sleep Trackers Revenue Share (%), by Application 2025 & 2033
- Figure 16: Europe Wearable Sleep Trackers Revenue (undefined), by Types 2025 & 2033
- Figure 17: Europe Wearable Sleep Trackers Revenue Share (%), by Types 2025 & 2033
- Figure 18: Europe Wearable Sleep Trackers Revenue (undefined), by Country 2025 & 2033
- Figure 19: Europe Wearable Sleep Trackers Revenue Share (%), by Country 2025 & 2033
- Figure 20: Middle East & Africa Wearable Sleep Trackers Revenue (undefined), by Application 2025 & 2033
- Figure 21: Middle East & Africa Wearable Sleep Trackers Revenue Share (%), by Application 2025 & 2033
- Figure 22: Middle East & Africa Wearable Sleep Trackers Revenue (undefined), by Types 2025 & 2033
- Figure 23: Middle East & Africa Wearable Sleep Trackers Revenue Share (%), by Types 2025 & 2033
- Figure 24: Middle East & Africa Wearable Sleep Trackers Revenue (undefined), by Country 2025 & 2033
- Figure 25: Middle East & Africa Wearable Sleep Trackers Revenue Share (%), by Country 2025 & 2033
- Figure 26: Asia Pacific Wearable Sleep Trackers Revenue (undefined), by Application 2025 & 2033
- Figure 27: Asia Pacific Wearable Sleep Trackers Revenue Share (%), by Application 2025 & 2033
- Figure 28: Asia Pacific Wearable Sleep Trackers Revenue (undefined), by Types 2025 & 2033
- Figure 29: Asia Pacific Wearable Sleep Trackers Revenue Share (%), by Types 2025 & 2033
- Figure 30: Asia Pacific Wearable Sleep Trackers Revenue (undefined), by Country 2025 & 2033
- Figure 31: Asia Pacific Wearable Sleep Trackers Revenue Share (%), by Country 2025 & 2033
List of Tables
- Table 1: Global Wearable Sleep Trackers Revenue undefined Forecast, by Application 2020 & 2033
- Table 2: Global Wearable Sleep Trackers Revenue undefined Forecast, by Types 2020 & 2033
- Table 3: Global Wearable Sleep Trackers Revenue undefined Forecast, by Region 2020 & 2033
- Table 4: Global Wearable Sleep Trackers Revenue undefined Forecast, by Application 2020 & 2033
- Table 5: Global Wearable Sleep Trackers Revenue undefined Forecast, by Types 2020 & 2033
- Table 6: Global Wearable Sleep Trackers Revenue undefined Forecast, by Country 2020 & 2033
- Table 7: United States Wearable Sleep Trackers Revenue (undefined) Forecast, by Application 2020 & 2033
- Table 8: Canada Wearable Sleep Trackers Revenue (undefined) Forecast, by Application 2020 & 2033
- Table 9: Mexico Wearable Sleep Trackers Revenue (undefined) Forecast, by Application 2020 & 2033
- Table 10: Global Wearable Sleep Trackers Revenue undefined Forecast, by Application 2020 & 2033
- Table 11: Global Wearable Sleep Trackers Revenue undefined Forecast, by Types 2020 & 2033
- Table 12: Global Wearable Sleep Trackers Revenue undefined Forecast, by Country 2020 & 2033
- Table 13: Brazil Wearable Sleep Trackers Revenue (undefined) Forecast, by Application 2020 & 2033
- Table 14: Argentina Wearable Sleep Trackers Revenue (undefined) Forecast, by Application 2020 & 2033
- Table 15: Rest of South America Wearable Sleep Trackers Revenue (undefined) Forecast, by Application 2020 & 2033
- Table 16: Global Wearable Sleep Trackers Revenue undefined Forecast, by Application 2020 & 2033
- Table 17: Global Wearable Sleep Trackers Revenue undefined Forecast, by Types 2020 & 2033
- Table 18: Global Wearable Sleep Trackers Revenue undefined Forecast, by Country 2020 & 2033
- Table 19: United Kingdom Wearable Sleep Trackers Revenue (undefined) Forecast, by Application 2020 & 2033
- Table 20: Germany Wearable Sleep Trackers Revenue (undefined) Forecast, by Application 2020 & 2033
- Table 21: France Wearable Sleep Trackers Revenue (undefined) Forecast, by Application 2020 & 2033
- Table 22: Italy Wearable Sleep Trackers Revenue (undefined) Forecast, by Application 2020 & 2033
- Table 23: Spain Wearable Sleep Trackers Revenue (undefined) Forecast, by Application 2020 & 2033
- Table 24: Russia Wearable Sleep Trackers Revenue (undefined) Forecast, by Application 2020 & 2033
- Table 25: Benelux Wearable Sleep Trackers Revenue (undefined) Forecast, by Application 2020 & 2033
- Table 26: Nordics Wearable Sleep Trackers Revenue (undefined) Forecast, by Application 2020 & 2033
- Table 27: Rest of Europe Wearable Sleep Trackers Revenue (undefined) Forecast, by Application 2020 & 2033
- Table 28: Global Wearable Sleep Trackers Revenue undefined Forecast, by Application 2020 & 2033
- Table 29: Global Wearable Sleep Trackers Revenue undefined Forecast, by Types 2020 & 2033
- Table 30: Global Wearable Sleep Trackers Revenue undefined Forecast, by Country 2020 & 2033
- Table 31: Turkey Wearable Sleep Trackers Revenue (undefined) Forecast, by Application 2020 & 2033
- Table 32: Israel Wearable Sleep Trackers Revenue (undefined) Forecast, by Application 2020 & 2033
- Table 33: GCC Wearable Sleep Trackers Revenue (undefined) Forecast, by Application 2020 & 2033
- Table 34: North Africa Wearable Sleep Trackers Revenue (undefined) Forecast, by Application 2020 & 2033
- Table 35: South Africa Wearable Sleep Trackers Revenue (undefined) Forecast, by Application 2020 & 2033
- Table 36: Rest of Middle East & Africa Wearable Sleep Trackers Revenue (undefined) Forecast, by Application 2020 & 2033
- Table 37: Global Wearable Sleep Trackers Revenue undefined Forecast, by Application 2020 & 2033
- Table 38: Global Wearable Sleep Trackers Revenue undefined Forecast, by Types 2020 & 2033
- Table 39: Global Wearable Sleep Trackers Revenue undefined Forecast, by Country 2020 & 2033
- Table 40: China Wearable Sleep Trackers Revenue (undefined) Forecast, by Application 2020 & 2033
- Table 41: India Wearable Sleep Trackers Revenue (undefined) Forecast, by Application 2020 & 2033
- Table 42: Japan Wearable Sleep Trackers Revenue (undefined) Forecast, by Application 2020 & 2033
- Table 43: South Korea Wearable Sleep Trackers Revenue (undefined) Forecast, by Application 2020 & 2033
- Table 44: ASEAN Wearable Sleep Trackers Revenue (undefined) Forecast, by Application 2020 & 2033
- Table 45: Oceania Wearable Sleep Trackers Revenue (undefined) Forecast, by Application 2020 & 2033
- Table 46: Rest of Asia Pacific Wearable Sleep Trackers Revenue (undefined) Forecast, by Application 2020 & 2033
Frequently Asked Questions
1. What is the projected Compound Annual Growth Rate (CAGR) of the Wearable Sleep Trackers?
The projected CAGR is approximately 4.5%.
2. Which companies are prominent players in the Wearable Sleep Trackers?
Key companies in the market include Apple, Xiaomi, Samsung Electronics, Fitbit, Huawei, Garmin, Phillips, Polar, Lifesense, Huami (Amazfit), Oppo, Dido.
3. What are the main segments of the Wearable Sleep Trackers?
The market segments include Application, Types.
4. Can you provide details about the market size?
The market size is estimated to be USD XXX N/A as of 2022.
5. What are some drivers contributing to market growth?
N/A
6. What are the notable trends driving market growth?
N/A
7. Are there any restraints impacting market growth?
N/A
8. Can you provide examples of recent developments in the market?
N/A
9. What pricing options are available for accessing the report?
Pricing options include single-user, multi-user, and enterprise licenses priced at USD 4900.00, USD 7350.00, and USD 9800.00 respectively.
10. Is the market size provided in terms of value or volume?
The market size is provided in terms of value, measured in N/A.
11. Are there any specific market keywords associated with the report?
Yes, the market keyword associated with the report is "Wearable Sleep Trackers," which aids in identifying and referencing the specific market segment covered.
12. How do I determine which pricing option suits my needs best?
The pricing options vary based on user requirements and access needs. Individual users may opt for single-user licenses, while businesses requiring broader access may choose multi-user or enterprise licenses for cost-effective access to the report.
13. Are there any additional resources or data provided in the Wearable Sleep Trackers report?
While the report offers comprehensive insights, it's advisable to review the specific contents or supplementary materials provided to ascertain if additional resources or data are available.
14. How can I stay updated on further developments or reports in the Wearable Sleep Trackers?
To stay informed about further developments, trends, and reports in the Wearable Sleep Trackers, consider subscribing to industry newsletters, following relevant companies and organizations, or regularly checking reputable industry news sources and publications.
Methodology
Step 1 - Identification of Relevant Samples Size from Population Database


Step 2 - Approaches for Defining Global Market Size (Value, Volume* & Price*)

Note*: In applicable scenarios
Step 3 - Data Sources
Primary Research
- Web Analytics
- Survey Reports
- Research Institute
- Latest Research Reports
- Opinion Leaders
Secondary Research
- Annual Reports
- White Paper
- Latest Press Release
- Industry Association
- Paid Database
- Investor Presentations

Step 4 - Data Triangulation
Involves using different sources of information in order to increase the validity of a study
These sources are likely to be stakeholders in a program - participants, other researchers, program staff, other community members, and so on.
Then we put all data in single framework & apply various statistical tools to find out the dynamic on the market.
During the analysis stage, feedback from the stakeholder groups would be compared to determine areas of agreement as well as areas of divergence