Key Insights
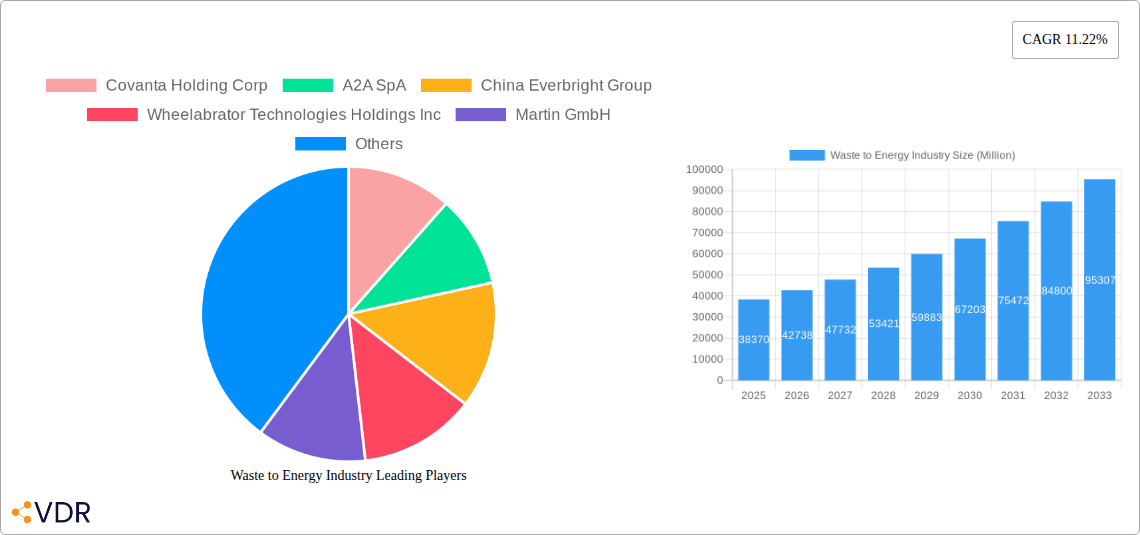
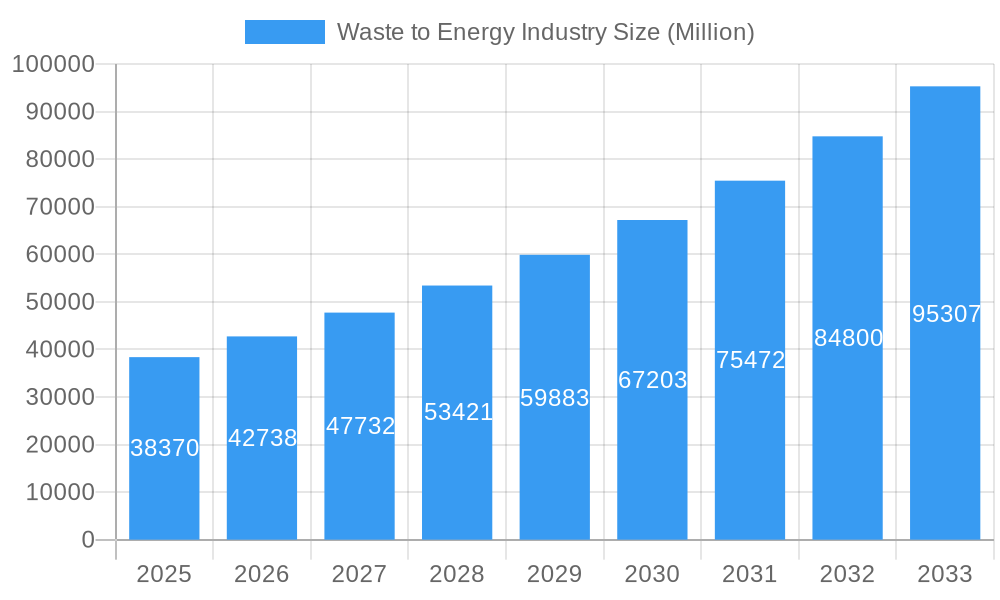
The global waste-to-energy (WtE) market, valued at $38.37 billion in 2025, is projected to experience robust growth, driven by increasing waste generation, stringent environmental regulations, and the rising demand for renewable energy sources. A compound annual growth rate (CAGR) of 11.22% from 2025 to 2033 indicates a significant expansion, reaching an estimated market value exceeding $100 billion by 2033. Key drivers include government incentives promoting renewable energy adoption, escalating landfill costs, and advancements in WtE technologies, particularly in thermal and biological treatment methods. Technological advancements are enabling more efficient energy recovery from diverse waste streams, including challenging materials like plastics and biomass. However, the market faces some restraints, including high capital investment costs for WtE facilities, public perception concerns regarding potential environmental impacts (e.g., air emissions), and the need for robust waste management infrastructure in developing regions. The market is segmented by technology (physical, thermal, biological), with thermal technologies currently dominating, but biological methods gaining traction due to their potential for resource recovery. Geographically, North America and Europe represent substantial market shares, driven by established infrastructure and stringent environmental policies. However, the Asia-Pacific region is poised for significant growth, fueled by rapid urbanization and increasing industrial activity. Leading players, including Covanta Holding Corp, A2A SpA, and Waste Management Inc., are actively investing in expansion and technological innovation to capitalize on this burgeoning market.
Waste to Energy Industry Market Size (In Billion)
The market's growth trajectory is influenced by several factors. Stronger environmental regulations globally are compelling countries to transition from landfilling to more sustainable waste management strategies. Furthermore, advancements in waste sorting and pretreatment technologies are improving the efficiency of WtE processes, making them more economically viable. The increasing scarcity and cost of fossil fuels further strengthen the case for WtE as a reliable and sustainable alternative energy source. While high upfront costs remain a barrier, the long-term economic and environmental benefits of WtE are increasingly attractive to investors and policymakers. The successful integration of WtE into broader circular economy initiatives will be crucial for accelerating market growth and ensuring sustainable waste management practices worldwide. The focus is shifting towards optimizing energy efficiency, reducing greenhouse gas emissions, and maximizing resource recovery from waste, leading to a more environmentally friendly and economically viable future for the WtE industry.
Waste to Energy Industry Company Market Share
Waste to Energy Industry Market Report: 2019-2033
This comprehensive report provides an in-depth analysis of the Waste to Energy industry, encompassing market dynamics, growth trends, regional performance, and key players. The study period covers 2019-2033, with a base year of 2025 and a forecast period of 2025-2033. This report is crucial for investors, industry professionals, and policymakers seeking to understand and capitalize on the opportunities within this rapidly evolving sector. The market is segmented by technology (Physical, Thermal, Biological) and further analyzed by key parent and child markets, providing a granular view of this complex industry. The total market size is estimated at xx Million in 2025, with projected growth to xx Million by 2033.
Waste to Energy Industry Market Dynamics & Structure
The global waste-to-energy market is characterized by a moderately concentrated landscape, with key players like Covanta Holding Corp, A2A SpA, and Veolia Environnement SA holding significant market share. However, the market exhibits considerable dynamism due to technological advancements, evolving regulatory frameworks, and a growing awareness of sustainable waste management practices. The market value was estimated at xx Million in 2024 and is expected to reach xx Million by 2025.
- Market Concentration: The top 10 players account for approximately xx% of the global market share in 2025.
- Technological Innovation: Continuous improvements in incineration, gasification, and anaerobic digestion technologies are driving efficiency gains and reducing environmental impact.
- Regulatory Landscape: Stringent environmental regulations and government incentives are propelling market growth, particularly in regions with aggressive renewable energy targets.
- Competitive Substitutes: Landfilling and recycling remain primary alternatives, but their limitations are increasingly driving demand for waste-to-energy solutions.
- End-User Demographics: Municipal governments, industrial sectors, and energy companies constitute the primary end-users, with demand influenced by waste generation patterns and energy needs.
- M&A Activity: The industry has witnessed a considerable number of mergers and acquisitions (M&A) in recent years (xx deals in 2024), reflecting industry consolidation and strategic expansion efforts. Deal value totalled approximately xx Million in 2024.
Waste to Energy Industry Growth Trends & Insights
The waste-to-energy market has witnessed significant growth over the past five years, fueled by increasing urbanization, rising waste generation, and stringent environmental regulations. This trend is projected to continue during the forecast period, with a Compound Annual Growth Rate (CAGR) of xx% from 2025 to 2033. Market penetration in developed economies is relatively high, while emerging economies present substantial growth potential. Technological innovations, including advanced gasification and pyrolysis technologies, are driving efficiency improvements and expanding the range of waste materials that can be processed. Shifting consumer attitudes towards sustainability and resource management further contribute to market expansion. The market value is expected to grow from xx Million in 2025 to xx Million by 2033.
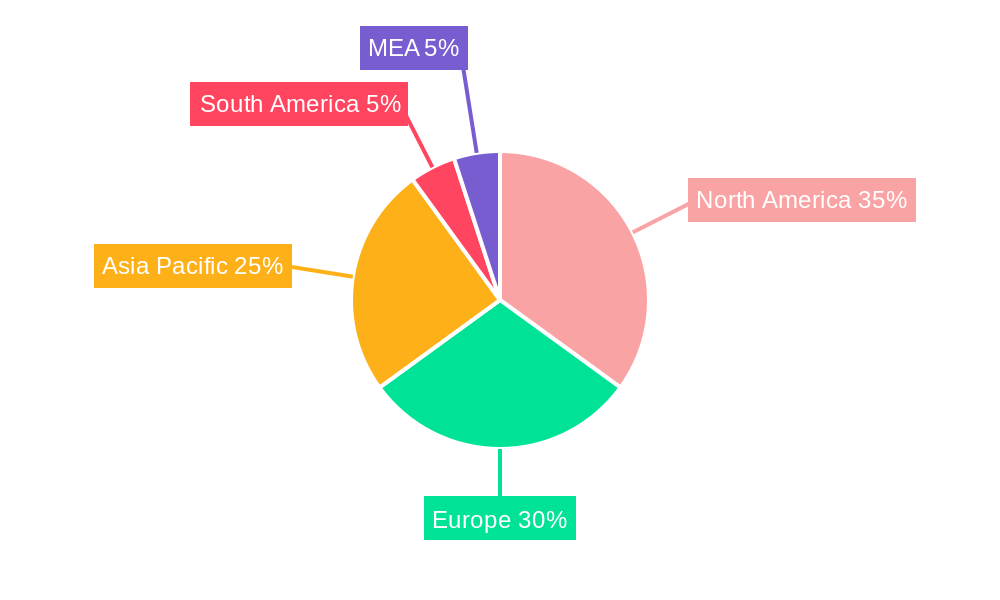
Dominant Regions, Countries, or Segments in Waste to Energy Industry
The European Union and North America currently dominate the global waste-to-energy market, driven by mature regulatory frameworks, advanced infrastructure, and significant investments in renewable energy technologies. However, Asia-Pacific is expected to experience the fastest growth in the forecast period, propelled by rapid industrialization and increasing urbanization in countries like China and India. Within the technology segments, thermal technologies (incineration and gasification) currently hold the largest market share due to their maturity and established infrastructure. However, biological technologies (anaerobic digestion) are gaining traction due to their environmental advantages and potential for biogas production.
- Key Drivers in Europe: Stringent environmental regulations, government subsidies, and a strong focus on renewable energy targets.
- Key Drivers in North America: Increasing waste generation, robust energy demand, and technological advancements in waste-to-energy solutions.
- Key Drivers in Asia-Pacific: Rapid urbanization, rising waste generation, and government support for renewable energy infrastructure development.
- Technology Segmentation: Thermal technologies currently dominate, followed by Physical and then Biological. Biological technologies are expected to gain significant market share due to increased focus on sustainability and circular economy principles.
Waste to Energy Industry Product Landscape
The waste-to-energy sector offers a diverse range of technologies, including incineration, gasification, pyrolysis, and anaerobic digestion. Recent product innovations focus on enhancing energy efficiency, reducing emissions, and recovering valuable materials from waste streams. Advanced waste-to-energy systems now integrate energy recovery with material recycling, creating a more circular and sustainable approach to waste management. The sector is witnessing a shift towards modular and decentralized systems, enabling adaptation to diverse waste streams and localized energy needs.
Key Drivers, Barriers & Challenges in Waste to Energy Industry
Key Drivers: Growing environmental concerns, stricter waste management regulations, increasing energy demand, advancements in waste-to-energy technologies, and government incentives for renewable energy sources. For example, the recent USD 120 Million contract in Egypt demonstrates government commitment to this sector.
Key Barriers and Challenges: High capital costs associated with setting up waste-to-energy plants, public perception regarding potential environmental impacts, complex permitting processes, securing consistent waste feedstock, and competition from other waste management solutions. Supply chain disruptions can also significantly impact project timelines and costs. The average cost of setting up a plant is currently estimated at xx Million.
Emerging Opportunities in Waste to Energy Industry
The waste-to-energy market presents numerous emerging opportunities. The growing interest in plastic waste-to-energy solutions is creating a substantial market segment. Advanced waste-to-energy systems capable of processing various waste streams offer potential for revenue diversification. The development of small-scale, decentralized waste-to-energy plants is an area of significant opportunity, particularly in underserved communities and regions with limited infrastructure.
Growth Accelerators in the Waste to Energy Industry Industry
Technological innovations in gasification, pyrolysis, and advanced waste sorting techniques are accelerating market growth. Public-private partnerships are playing a crucial role in financing and implementing large-scale waste-to-energy projects. Increasing government support, including tax incentives and regulatory frameworks that favor renewable energy sources, is another vital growth catalyst.
Key Players Shaping the Waste to Energy Industry Market
- Covanta Holding Corp
- A2A SpA
- China Everbright Group
- Wheelabrator Technologies Holdings Inc
- Martin GmbH
- Hitachi Zosen Corp
- Suez Group
- China Jinjiang Environment Holding Co Ltd
- Veolia Environnement SA
- Waste Management Inc
- Babcock & Wilcox Enterprises Inc
- Xcel Energy Inc
- MVV Energie AG
- Mitsubishi Heavy Industries Ltd
Notable Milestones in Waste to Energy Industry Sector
- January 2023: Lostock Sustainable Energy Plant awarded Babcock & Wilcox a USD 65 million contract for a waste-to-energy plant near Manchester, UK, showcasing significant investment in the sector.
- April 2023: Egypt signed a USD 120 million contract for its first solid waste-to-electricity facility, demonstrating growing adoption in emerging markets.
In-Depth Waste to Energy Industry Market Outlook
The waste-to-energy industry is poised for robust growth, driven by a confluence of factors including technological innovation, stringent environmental regulations, and the imperative to transition towards a circular economy. Strategic partnerships, focused R&D efforts, and expansion into emerging markets will define the sector's future trajectory. The market presents significant opportunities for companies capable of innovating and adapting to the evolving landscape of waste management and renewable energy.
Waste to Energy Industry Segmentation
-
1. Technology
- 1.1. Physical
- 1.2. Thermal
- 1.3. Biological
Waste to Energy Industry Segmentation By Geography
-
1. North America
- 1.1. United States
- 1.2. Canada
- 1.3. Rest of North America
-
2. Asia Pacific
- 2.1. China
- 2.2. India
- 2.3. Japan
- 2.4. Malaysia
- 2.5. Thailand
- 2.6. Indonesia
- 2.7. Vietnam
- 2.8. Rest of Asia Pacific
-
3. Europe
- 3.1. Spain
- 3.2. Nordic
- 3.3. United Kingdom
- 3.4. Russia
- 3.5. Turkey
- 3.6. Germany
- 3.7. Italy
- 3.8. Rest of Europe
-
4. Middle East and Africa
- 4.1. United Arab Emirates
- 4.2. Saudi Arabia
- 4.3. South Africa
- 4.4. Nigeria
- 4.5. Qatar
- 4.6. Egypt
- 4.7. Rest of Middle East and Africa
-
5. South America
- 5.1. Brazil
- 5.2. Argentina
- 5.3. Colombia
- 5.4. Rest of South America
Waste to Energy Industry Regional Market Share
Geographic Coverage of Waste to Energy Industry
Waste to Energy Industry REPORT HIGHLIGHTS
| Aspects | Details |
|---|---|
| Study Period | 2020-2034 |
| Base Year | 2025 |
| Estimated Year | 2026 |
| Forecast Period | 2026-2034 |
| Historical Period | 2020-2025 |
| Growth Rate | CAGR of 11.22% from 2020-2034 |
| Segmentation |
|
Table of Contents
- 1. Introduction
- 1.1. Research Scope
- 1.2. Market Segmentation
- 1.3. Research Objective
- 1.4. Definitions and Assumptions
- 2. Executive Summary
- 2.1. Market Snapshot
- 3. Market Dynamics
- 3.1. Market Drivers
- 3.2. Market Restrains
- 3.3. Market Trends
- 3.4. Market Opportunities
- 4. Market Factor Analysis
- 4.1. Porters Five Forces
- 4.1.1. Bargaining Power of Suppliers
- 4.1.2. Bargaining Power of Buyers
- 4.1.3. Threat of New Entrants
- 4.1.4. Threat of Substitutes
- 4.1.5. Competitive Rivalry
- 4.2. PESTEL analysis
- 4.3. BCG Analysis
- 4.3.1. Stars (High Growth, High Market Share)
- 4.3.2. Cash Cows (Low Growth, High Market Share)
- 4.3.3. Question Mark (High Growth, Low Market Share)
- 4.3.4. Dogs (Low Growth, Low Market Share)
- 4.4. Ansoff Matrix Analysis
- 4.5. Supply Chain Analysis
- 4.6. Regulatory Landscape
- 4.7. Current Market Potential and Opportunity Assessment (TAM–SAM–SOM Framework)
- 4.8. VDR Analyst Note
- 4.1. Porters Five Forces
- 5. Market Analysis, Insights and Forecast 2021-2033
- 5.1. Market Analysis, Insights and Forecast - by Technology
- 5.1.1. Physical
- 5.1.2. Thermal
- 5.1.3. Biological
- 5.2. Market Analysis, Insights and Forecast - by Region
- 5.2.1. North America
- 5.2.2. Asia Pacific
- 5.2.3. Europe
- 5.2.4. Middle East and Africa
- 5.2.5. South America
- 5.1. Market Analysis, Insights and Forecast - by Technology
- 6. Global Waste to Energy Industry Analysis, Insights and Forecast, 2021-2033
- 6.1. Market Analysis, Insights and Forecast - by Technology
- 6.1.1. Physical
- 6.1.2. Thermal
- 6.1.3. Biological
- 6.1. Market Analysis, Insights and Forecast - by Technology
- 7. North America Waste to Energy Industry Analysis, Insights and Forecast, 2021-2033
- 7.1. Market Analysis, Insights and Forecast - by Technology
- 7.1.1. Physical
- 7.1.2. Thermal
- 7.1.3. Biological
- 7.1. Market Analysis, Insights and Forecast - by Technology
- 8. Asia Pacific Waste to Energy Industry Analysis, Insights and Forecast, 2021-2033
- 8.1. Market Analysis, Insights and Forecast - by Technology
- 8.1.1. Physical
- 8.1.2. Thermal
- 8.1.3. Biological
- 8.1. Market Analysis, Insights and Forecast - by Technology
- 9. Europe Waste to Energy Industry Analysis, Insights and Forecast, 2021-2033
- 9.1. Market Analysis, Insights and Forecast - by Technology
- 9.1.1. Physical
- 9.1.2. Thermal
- 9.1.3. Biological
- 9.1. Market Analysis, Insights and Forecast - by Technology
- 10. Middle East and Africa Waste to Energy Industry Analysis, Insights and Forecast, 2021-2033
- 10.1. Market Analysis, Insights and Forecast - by Technology
- 10.1.1. Physical
- 10.1.2. Thermal
- 10.1.3. Biological
- 10.1. Market Analysis, Insights and Forecast - by Technology
- 11. South America Waste to Energy Industry Analysis, Insights and Forecast, 2021-2033
- 11.1. Market Analysis, Insights and Forecast - by Technology
- 11.1.1. Physical
- 11.1.2. Thermal
- 11.1.3. Biological
- 11.1. Market Analysis, Insights and Forecast - by Technology
- 12. Competitive Analysis
- 12.1. Company Profiles
- 12.1.1 Covanta Holding Corp
- 12.1.1.1. Company Overview
- 12.1.1.2. Products
- 12.1.1.3. Company Financials
- 12.1.1.4. SWOT Analysis
- 12.1.2 A2A SpA
- 12.1.2.1. Company Overview
- 12.1.2.2. Products
- 12.1.2.3. Company Financials
- 12.1.2.4. SWOT Analysis
- 12.1.3 China Everbright Group
- 12.1.3.1. Company Overview
- 12.1.3.2. Products
- 12.1.3.3. Company Financials
- 12.1.3.4. SWOT Analysis
- 12.1.4 Wheelabrator Technologies Holdings Inc
- 12.1.4.1. Company Overview
- 12.1.4.2. Products
- 12.1.4.3. Company Financials
- 12.1.4.4. SWOT Analysis
- 12.1.5 Martin GmbH
- 12.1.5.1. Company Overview
- 12.1.5.2. Products
- 12.1.5.3. Company Financials
- 12.1.5.4. SWOT Analysis
- 12.1.6 Hitachi Zosen Corp
- 12.1.6.1. Company Overview
- 12.1.6.2. Products
- 12.1.6.3. Company Financials
- 12.1.6.4. SWOT Analysis
- 12.1.7 Suez Group
- 12.1.7.1. Company Overview
- 12.1.7.2. Products
- 12.1.7.3. Company Financials
- 12.1.7.4. SWOT Analysis
- 12.1.8 China Jinjiang Environment Holding Co Ltd
- 12.1.8.1. Company Overview
- 12.1.8.2. Products
- 12.1.8.3. Company Financials
- 12.1.8.4. SWOT Analysis
- 12.1.9 Veolia Environnement SA
- 12.1.9.1. Company Overview
- 12.1.9.2. Products
- 12.1.9.3. Company Financials
- 12.1.9.4. SWOT Analysis
- 12.1.10 Waste Management Inc
- 12.1.10.1. Company Overview
- 12.1.10.2. Products
- 12.1.10.3. Company Financials
- 12.1.10.4. SWOT Analysis
- 12.1.11 Babcock & Wilcox Enterprises Inc
- 12.1.11.1. Company Overview
- 12.1.11.2. Products
- 12.1.11.3. Company Financials
- 12.1.11.4. SWOT Analysis
- 12.1.12 Xcel Energy Inc
- 12.1.12.1. Company Overview
- 12.1.12.2. Products
- 12.1.12.3. Company Financials
- 12.1.12.4. SWOT Analysis
- 12.1.13 MVV Energie AG
- 12.1.13.1. Company Overview
- 12.1.13.2. Products
- 12.1.13.3. Company Financials
- 12.1.13.4. SWOT Analysis
- 12.1.14 Mitsubishi Heavy Industries Ltd
- 12.1.14.1. Company Overview
- 12.1.14.2. Products
- 12.1.14.3. Company Financials
- 12.1.14.4. SWOT Analysis
- 12.1.1 Covanta Holding Corp
- 12.2. Market Entropy
- 12.2.1 Company's Key Areas Served
- 12.2.2 Recent Developments
- 12.3. Company Market Share Analysis 2025
- 12.3.1 Top 5 Companies Market Share Analysis
- 12.3.2 Top 3 Companies Market Share Analysis
- 12.4. List of Potential Customers
- 13. Research Methodology
List of Figures
- Figure 1: Global Waste to Energy Industry Revenue Breakdown (Million, %) by Region 2025 & 2033
- Figure 2: Global Waste to Energy Industry Volume Breakdown (Gigawatt, %) by Region 2025 & 2033
- Figure 3: North America Waste to Energy Industry Revenue (Million), by Technology 2025 & 2033
- Figure 4: North America Waste to Energy Industry Volume (Gigawatt), by Technology 2025 & 2033
- Figure 5: North America Waste to Energy Industry Revenue Share (%), by Technology 2025 & 2033
- Figure 6: North America Waste to Energy Industry Volume Share (%), by Technology 2025 & 2033
- Figure 7: North America Waste to Energy Industry Revenue (Million), by Country 2025 & 2033
- Figure 8: North America Waste to Energy Industry Volume (Gigawatt), by Country 2025 & 2033
- Figure 9: North America Waste to Energy Industry Revenue Share (%), by Country 2025 & 2033
- Figure 10: North America Waste to Energy Industry Volume Share (%), by Country 2025 & 2033
- Figure 11: Asia Pacific Waste to Energy Industry Revenue (Million), by Technology 2025 & 2033
- Figure 12: Asia Pacific Waste to Energy Industry Volume (Gigawatt), by Technology 2025 & 2033
- Figure 13: Asia Pacific Waste to Energy Industry Revenue Share (%), by Technology 2025 & 2033
- Figure 14: Asia Pacific Waste to Energy Industry Volume Share (%), by Technology 2025 & 2033
- Figure 15: Asia Pacific Waste to Energy Industry Revenue (Million), by Country 2025 & 2033
- Figure 16: Asia Pacific Waste to Energy Industry Volume (Gigawatt), by Country 2025 & 2033
- Figure 17: Asia Pacific Waste to Energy Industry Revenue Share (%), by Country 2025 & 2033
- Figure 18: Asia Pacific Waste to Energy Industry Volume Share (%), by Country 2025 & 2033
- Figure 19: Europe Waste to Energy Industry Revenue (Million), by Technology 2025 & 2033
- Figure 20: Europe Waste to Energy Industry Volume (Gigawatt), by Technology 2025 & 2033
- Figure 21: Europe Waste to Energy Industry Revenue Share (%), by Technology 2025 & 2033
- Figure 22: Europe Waste to Energy Industry Volume Share (%), by Technology 2025 & 2033
- Figure 23: Europe Waste to Energy Industry Revenue (Million), by Country 2025 & 2033
- Figure 24: Europe Waste to Energy Industry Volume (Gigawatt), by Country 2025 & 2033
- Figure 25: Europe Waste to Energy Industry Revenue Share (%), by Country 2025 & 2033
- Figure 26: Europe Waste to Energy Industry Volume Share (%), by Country 2025 & 2033
- Figure 27: Middle East and Africa Waste to Energy Industry Revenue (Million), by Technology 2025 & 2033
- Figure 28: Middle East and Africa Waste to Energy Industry Volume (Gigawatt), by Technology 2025 & 2033
- Figure 29: Middle East and Africa Waste to Energy Industry Revenue Share (%), by Technology 2025 & 2033
- Figure 30: Middle East and Africa Waste to Energy Industry Volume Share (%), by Technology 2025 & 2033
- Figure 31: Middle East and Africa Waste to Energy Industry Revenue (Million), by Country 2025 & 2033
- Figure 32: Middle East and Africa Waste to Energy Industry Volume (Gigawatt), by Country 2025 & 2033
- Figure 33: Middle East and Africa Waste to Energy Industry Revenue Share (%), by Country 2025 & 2033
- Figure 34: Middle East and Africa Waste to Energy Industry Volume Share (%), by Country 2025 & 2033
- Figure 35: South America Waste to Energy Industry Revenue (Million), by Technology 2025 & 2033
- Figure 36: South America Waste to Energy Industry Volume (Gigawatt), by Technology 2025 & 2033
- Figure 37: South America Waste to Energy Industry Revenue Share (%), by Technology 2025 & 2033
- Figure 38: South America Waste to Energy Industry Volume Share (%), by Technology 2025 & 2033
- Figure 39: South America Waste to Energy Industry Revenue (Million), by Country 2025 & 2033
- Figure 40: South America Waste to Energy Industry Volume (Gigawatt), by Country 2025 & 2033
- Figure 41: South America Waste to Energy Industry Revenue Share (%), by Country 2025 & 2033
- Figure 42: South America Waste to Energy Industry Volume Share (%), by Country 2025 & 2033
List of Tables
- Table 1: Global Waste to Energy Industry Revenue Million Forecast, by Technology 2020 & 2033
- Table 2: Global Waste to Energy Industry Volume Gigawatt Forecast, by Technology 2020 & 2033
- Table 3: Global Waste to Energy Industry Revenue Million Forecast, by Region 2020 & 2033
- Table 4: Global Waste to Energy Industry Volume Gigawatt Forecast, by Region 2020 & 2033
- Table 5: Global Waste to Energy Industry Revenue Million Forecast, by Technology 2020 & 2033
- Table 6: Global Waste to Energy Industry Volume Gigawatt Forecast, by Technology 2020 & 2033
- Table 7: Global Waste to Energy Industry Revenue Million Forecast, by Country 2020 & 2033
- Table 8: Global Waste to Energy Industry Volume Gigawatt Forecast, by Country 2020 & 2033
- Table 9: United States Waste to Energy Industry Revenue (Million) Forecast, by Application 2020 & 2033
- Table 10: United States Waste to Energy Industry Volume (Gigawatt) Forecast, by Application 2020 & 2033
- Table 11: Canada Waste to Energy Industry Revenue (Million) Forecast, by Application 2020 & 2033
- Table 12: Canada Waste to Energy Industry Volume (Gigawatt) Forecast, by Application 2020 & 2033
- Table 13: Rest of North America Waste to Energy Industry Revenue (Million) Forecast, by Application 2020 & 2033
- Table 14: Rest of North America Waste to Energy Industry Volume (Gigawatt) Forecast, by Application 2020 & 2033
- Table 15: Global Waste to Energy Industry Revenue Million Forecast, by Technology 2020 & 2033
- Table 16: Global Waste to Energy Industry Volume Gigawatt Forecast, by Technology 2020 & 2033
- Table 17: Global Waste to Energy Industry Revenue Million Forecast, by Country 2020 & 2033
- Table 18: Global Waste to Energy Industry Volume Gigawatt Forecast, by Country 2020 & 2033
- Table 19: China Waste to Energy Industry Revenue (Million) Forecast, by Application 2020 & 2033
- Table 20: China Waste to Energy Industry Volume (Gigawatt) Forecast, by Application 2020 & 2033
- Table 21: India Waste to Energy Industry Revenue (Million) Forecast, by Application 2020 & 2033
- Table 22: India Waste to Energy Industry Volume (Gigawatt) Forecast, by Application 2020 & 2033
- Table 23: Japan Waste to Energy Industry Revenue (Million) Forecast, by Application 2020 & 2033
- Table 24: Japan Waste to Energy Industry Volume (Gigawatt) Forecast, by Application 2020 & 2033
- Table 25: Malaysia Waste to Energy Industry Revenue (Million) Forecast, by Application 2020 & 2033
- Table 26: Malaysia Waste to Energy Industry Volume (Gigawatt) Forecast, by Application 2020 & 2033
- Table 27: Thailand Waste to Energy Industry Revenue (Million) Forecast, by Application 2020 & 2033
- Table 28: Thailand Waste to Energy Industry Volume (Gigawatt) Forecast, by Application 2020 & 2033
- Table 29: Indonesia Waste to Energy Industry Revenue (Million) Forecast, by Application 2020 & 2033
- Table 30: Indonesia Waste to Energy Industry Volume (Gigawatt) Forecast, by Application 2020 & 2033
- Table 31: Vietnam Waste to Energy Industry Revenue (Million) Forecast, by Application 2020 & 2033
- Table 32: Vietnam Waste to Energy Industry Volume (Gigawatt) Forecast, by Application 2020 & 2033
- Table 33: Rest of Asia Pacific Waste to Energy Industry Revenue (Million) Forecast, by Application 2020 & 2033
- Table 34: Rest of Asia Pacific Waste to Energy Industry Volume (Gigawatt) Forecast, by Application 2020 & 2033
- Table 35: Global Waste to Energy Industry Revenue Million Forecast, by Technology 2020 & 2033
- Table 36: Global Waste to Energy Industry Volume Gigawatt Forecast, by Technology 2020 & 2033
- Table 37: Global Waste to Energy Industry Revenue Million Forecast, by Country 2020 & 2033
- Table 38: Global Waste to Energy Industry Volume Gigawatt Forecast, by Country 2020 & 2033
- Table 39: Spain Waste to Energy Industry Revenue (Million) Forecast, by Application 2020 & 2033
- Table 40: Spain Waste to Energy Industry Volume (Gigawatt) Forecast, by Application 2020 & 2033
- Table 41: Nordic Waste to Energy Industry Revenue (Million) Forecast, by Application 2020 & 2033
- Table 42: Nordic Waste to Energy Industry Volume (Gigawatt) Forecast, by Application 2020 & 2033
- Table 43: United Kingdom Waste to Energy Industry Revenue (Million) Forecast, by Application 2020 & 2033
- Table 44: United Kingdom Waste to Energy Industry Volume (Gigawatt) Forecast, by Application 2020 & 2033
- Table 45: Russia Waste to Energy Industry Revenue (Million) Forecast, by Application 2020 & 2033
- Table 46: Russia Waste to Energy Industry Volume (Gigawatt) Forecast, by Application 2020 & 2033
- Table 47: Turkey Waste to Energy Industry Revenue (Million) Forecast, by Application 2020 & 2033
- Table 48: Turkey Waste to Energy Industry Volume (Gigawatt) Forecast, by Application 2020 & 2033
- Table 49: Germany Waste to Energy Industry Revenue (Million) Forecast, by Application 2020 & 2033
- Table 50: Germany Waste to Energy Industry Volume (Gigawatt) Forecast, by Application 2020 & 2033
- Table 51: Italy Waste to Energy Industry Revenue (Million) Forecast, by Application 2020 & 2033
- Table 52: Italy Waste to Energy Industry Volume (Gigawatt) Forecast, by Application 2020 & 2033
- Table 53: Rest of Europe Waste to Energy Industry Revenue (Million) Forecast, by Application 2020 & 2033
- Table 54: Rest of Europe Waste to Energy Industry Volume (Gigawatt) Forecast, by Application 2020 & 2033
- Table 55: Global Waste to Energy Industry Revenue Million Forecast, by Technology 2020 & 2033
- Table 56: Global Waste to Energy Industry Volume Gigawatt Forecast, by Technology 2020 & 2033
- Table 57: Global Waste to Energy Industry Revenue Million Forecast, by Country 2020 & 2033
- Table 58: Global Waste to Energy Industry Volume Gigawatt Forecast, by Country 2020 & 2033
- Table 59: United Arab Emirates Waste to Energy Industry Revenue (Million) Forecast, by Application 2020 & 2033
- Table 60: United Arab Emirates Waste to Energy Industry Volume (Gigawatt) Forecast, by Application 2020 & 2033
- Table 61: Saudi Arabia Waste to Energy Industry Revenue (Million) Forecast, by Application 2020 & 2033
- Table 62: Saudi Arabia Waste to Energy Industry Volume (Gigawatt) Forecast, by Application 2020 & 2033
- Table 63: South Africa Waste to Energy Industry Revenue (Million) Forecast, by Application 2020 & 2033
- Table 64: South Africa Waste to Energy Industry Volume (Gigawatt) Forecast, by Application 2020 & 2033
- Table 65: Nigeria Waste to Energy Industry Revenue (Million) Forecast, by Application 2020 & 2033
- Table 66: Nigeria Waste to Energy Industry Volume (Gigawatt) Forecast, by Application 2020 & 2033
- Table 67: Qatar Waste to Energy Industry Revenue (Million) Forecast, by Application 2020 & 2033
- Table 68: Qatar Waste to Energy Industry Volume (Gigawatt) Forecast, by Application 2020 & 2033
- Table 69: Egypt Waste to Energy Industry Revenue (Million) Forecast, by Application 2020 & 2033
- Table 70: Egypt Waste to Energy Industry Volume (Gigawatt) Forecast, by Application 2020 & 2033
- Table 71: Rest of Middle East and Africa Waste to Energy Industry Revenue (Million) Forecast, by Application 2020 & 2033
- Table 72: Rest of Middle East and Africa Waste to Energy Industry Volume (Gigawatt) Forecast, by Application 2020 & 2033
- Table 73: Global Waste to Energy Industry Revenue Million Forecast, by Technology 2020 & 2033
- Table 74: Global Waste to Energy Industry Volume Gigawatt Forecast, by Technology 2020 & 2033
- Table 75: Global Waste to Energy Industry Revenue Million Forecast, by Country 2020 & 2033
- Table 76: Global Waste to Energy Industry Volume Gigawatt Forecast, by Country 2020 & 2033
- Table 77: Brazil Waste to Energy Industry Revenue (Million) Forecast, by Application 2020 & 2033
- Table 78: Brazil Waste to Energy Industry Volume (Gigawatt) Forecast, by Application 2020 & 2033
- Table 79: Argentina Waste to Energy Industry Revenue (Million) Forecast, by Application 2020 & 2033
- Table 80: Argentina Waste to Energy Industry Volume (Gigawatt) Forecast, by Application 2020 & 2033
- Table 81: Colombia Waste to Energy Industry Revenue (Million) Forecast, by Application 2020 & 2033
- Table 82: Colombia Waste to Energy Industry Volume (Gigawatt) Forecast, by Application 2020 & 2033
- Table 83: Rest of South America Waste to Energy Industry Revenue (Million) Forecast, by Application 2020 & 2033
- Table 84: Rest of South America Waste to Energy Industry Volume (Gigawatt) Forecast, by Application 2020 & 2033
Frequently Asked Questions
1. What is the projected Compound Annual Growth Rate (CAGR) of the Waste to Energy Industry?
The projected CAGR is approximately 11.22%.
2. Which companies are prominent players in the Waste to Energy Industry?
Key companies in the market include Covanta Holding Corp, A2A SpA, China Everbright Group, Wheelabrator Technologies Holdings Inc, Martin GmbH, Hitachi Zosen Corp, Suez Group, China Jinjiang Environment Holding Co Ltd, Veolia Environnement SA, Waste Management Inc, Babcock & Wilcox Enterprises Inc, Xcel Energy Inc, MVV Energie AG, Mitsubishi Heavy Industries Ltd.
3. What are the main segments of the Waste to Energy Industry?
The market segments include Technology.
4. Can you provide details about the market size?
The market size is estimated to be USD 38.37 Million as of 2022.
5. What are some drivers contributing to market growth?
4.; Increasing Amount of Waste Generation. Growing Concern for Waste Management to Meet the Needs for Sustainable Urban Living4.; Increasing Focus on Non-fossil Fuel Sources of Energy.
6. What are the notable trends driving market growth?
Thermal-based Waste-to-Energy Segment to Dominate the Market.
7. Are there any restraints impacting market growth?
4.; Expensive Nature of Incinerators.
8. Can you provide examples of recent developments in the market?
April 2023: Egypt signed a USD 120 million contract to design, develop, own, and manage the country's first solid waste-to-electricity facility. The contract was signed by the Giza governorate and a partnership consisting of Renergy Egypt and the National Authority for Military Production. As part of Egypt Vision 2030, the Abou Rawash, Giza plant would convert 1,200 metric tons of household solid waste per day to power.
9. What pricing options are available for accessing the report?
Pricing options include single-user, multi-user, and enterprise licenses priced at USD 4750, USD 5250, and USD 8750 respectively.
10. Is the market size provided in terms of value or volume?
The market size is provided in terms of value, measured in Million and volume, measured in Gigawatt.
11. Are there any specific market keywords associated with the report?
Yes, the market keyword associated with the report is "Waste to Energy Industry," which aids in identifying and referencing the specific market segment covered.
12. How do I determine which pricing option suits my needs best?
The pricing options vary based on user requirements and access needs. Individual users may opt for single-user licenses, while businesses requiring broader access may choose multi-user or enterprise licenses for cost-effective access to the report.
13. Are there any additional resources or data provided in the Waste to Energy Industry report?
While the report offers comprehensive insights, it's advisable to review the specific contents or supplementary materials provided to ascertain if additional resources or data are available.
14. How can I stay updated on further developments or reports in the Waste to Energy Industry?
To stay informed about further developments, trends, and reports in the Waste to Energy Industry, consider subscribing to industry newsletters, following relevant companies and organizations, or regularly checking reputable industry news sources and publications.
Methodology
Step 1 - Identification of Relevant Samples Size from Population Database


Step 2 - Approaches for Defining Global Market Size (Value, Volume* & Price*)

Note*: In applicable scenarios
Step 3 - Data Sources
Primary Research
- Web Analytics
- Survey Reports
- Research Institute
- Latest Research Reports
- Opinion Leaders
Secondary Research
- Annual Reports
- White Paper
- Latest Press Release
- Industry Association
- Paid Database
- Investor Presentations

Step 4 - Data Triangulation
Involves using different sources of information in order to increase the validity of a study
These sources are likely to be stakeholders in a program - participants, other researchers, program staff, other community members, and so on.
Then we put all data in single framework & apply various statistical tools to find out the dynamic on the market.
During the analysis stage, feedback from the stakeholder groups would be compared to determine areas of agreement as well as areas of divergence

