
Key Insights
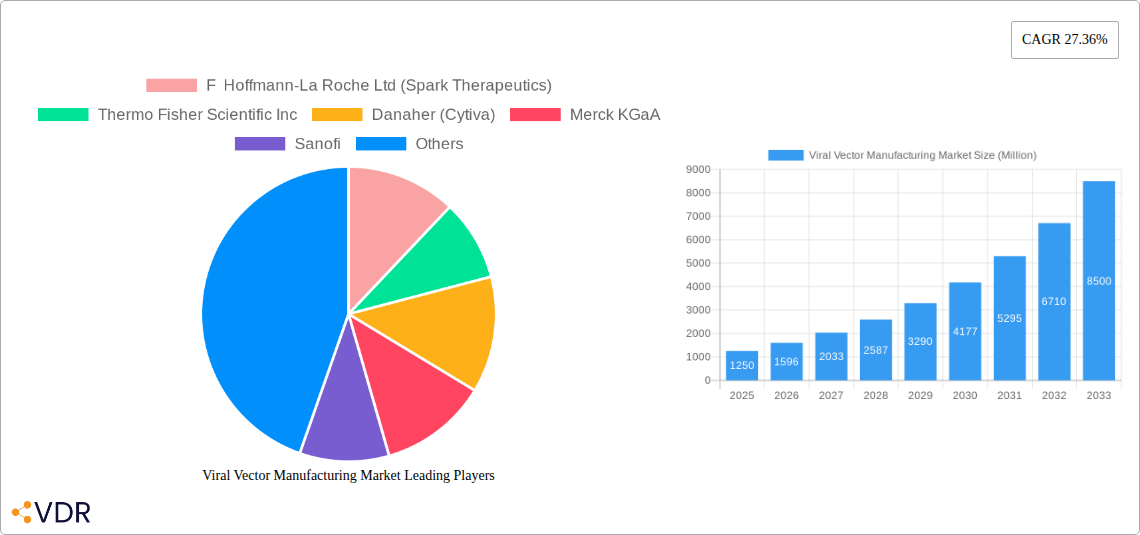
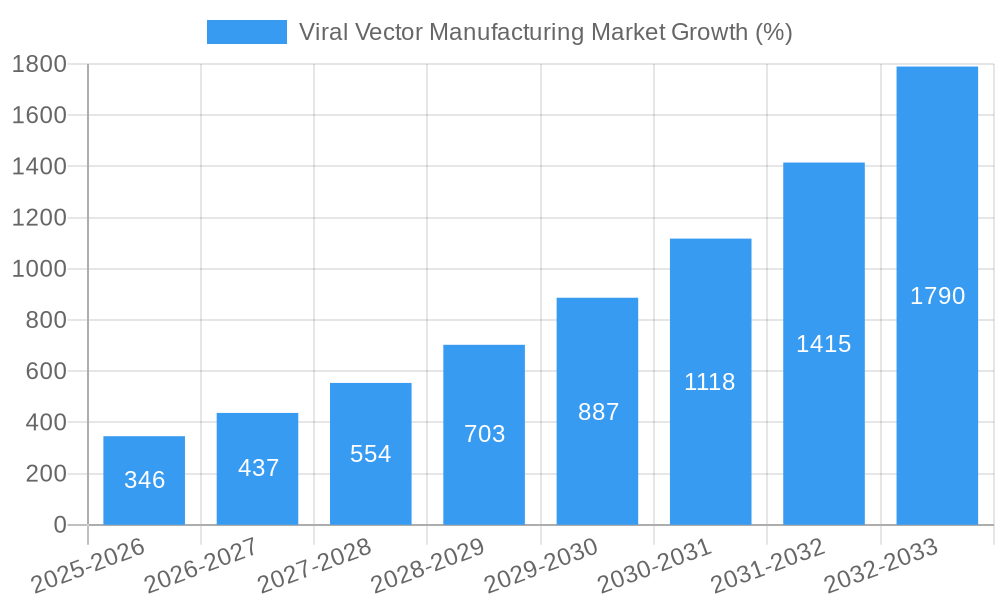
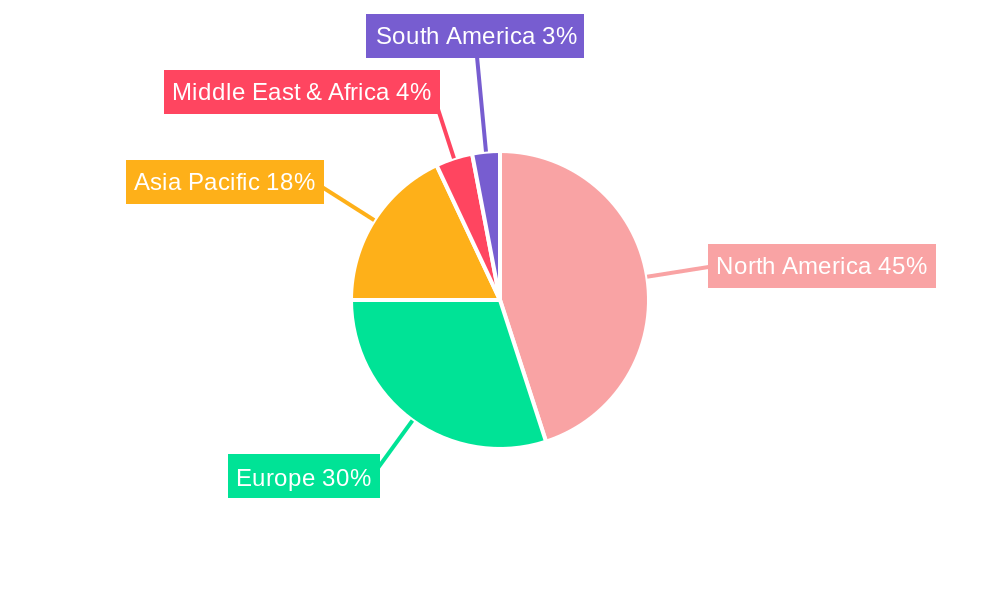
The viral vector manufacturing market is experiencing robust growth, projected to reach a substantial size driven by the increasing demand for gene therapy and advanced vaccine development. The market's Compound Annual Growth Rate (CAGR) of 27.36% from 2019 to 2024 indicates significant momentum, and this growth is expected to continue throughout the forecast period (2025-2033). Key drivers include the rising prevalence of chronic diseases like cancer and genetic disorders, along with substantial investments in research and development across the globe. The market is segmented by vector type (adenoviral, adeno-associated viral, lentiviral, retroviral, and others), disease application (cancer, genetic disorders, infectious diseases, and others), and therapeutic application (gene therapy and vaccinology). The diverse application areas fuel market expansion, as viral vectors are increasingly leveraged in novel therapeutic modalities. North America currently holds a significant market share, attributed to strong regulatory frameworks, substantial funding for research and development, and the presence of leading pharmaceutical and biotechnology companies. However, the Asia-Pacific region is emerging as a rapidly growing market, propelled by increasing healthcare spending and rising prevalence of target diseases. Competition is intense, with major players like Roche, Thermo Fisher Scientific, and Merck KGaA dominating the landscape. Nevertheless, smaller specialized companies continue to innovate and contribute to the overall market growth through strategic partnerships and acquisitions.
The market's expansion is anticipated to be influenced by several factors. Continued technological advancements in vector design and manufacturing processes are likely to enhance efficacy and safety profiles, further stimulating demand. Furthermore, supportive regulatory policies from various governmental bodies are streamlining approvals for new therapies, accelerating market entry. However, challenges such as high manufacturing costs, stringent regulatory hurdles, and potential safety concerns associated with viral vectors remain as potential restraints. Despite these, the overall market outlook remains positive, owing to the escalating need for effective treatments for numerous life-threatening diseases and the ongoing pursuit of innovative solutions. The consistent technological advancements and continuous investments in the sector suggest a robust and expanding market future.
Viral Vector Manufacturing Market: A Comprehensive Report (2019-2033)
This comprehensive report provides a detailed analysis of the Viral Vector Manufacturing Market, encompassing market dynamics, growth trends, regional dominance, product landscape, key players, and future outlook. The report covers the parent market of Biopharmaceutical Manufacturing and the child market of Gene Therapy Manufacturing, providing a granular understanding of this rapidly evolving sector. The study period spans from 2019 to 2033, with 2025 serving as the base and estimated year. The market size is presented in million units.
Viral Vector Manufacturing Market Dynamics & Structure
The viral vector manufacturing market is characterized by a moderately concentrated landscape with a few dominant players and numerous smaller specialized companies. Technological innovation, particularly in vector design and manufacturing processes, is a key driver, pushing towards increased efficiency, scalability, and reduced costs. Stringent regulatory frameworks governing the production of viral vectors for therapeutic applications significantly impact market growth. Competitive product substitutes, such as mRNA-based therapies, present challenges, while the increasing prevalence of various diseases requiring gene therapy and vaccine development fuels market expansion. Mergers and acquisitions (M&A) activity remains robust, with larger companies acquiring smaller innovative firms to expand their product portfolios and manufacturing capabilities.
- Market Concentration: Moderately concentrated, with top 5 players holding approximately xx% market share in 2024.
- Technological Innovation: Focus on improving vector design, production efficiency (e.g., suspension cultures), and automation.
- Regulatory Framework: Stringent GMP (Good Manufacturing Practice) guidelines and regulatory approvals impact timelines and costs.
- Competitive Substitutes: mRNA therapies and other emerging gene-editing technologies pose competition.
- M&A Activity: Significant activity observed in the past five years, with xx major deals completed. Average deal value is estimated at xx million units.
- Innovation Barriers: High R&D costs, complex regulatory pathways, and challenges in scaling-up production.
Viral Vector Manufacturing Market Growth Trends & Insights
The viral vector manufacturing market has witnessed robust growth during the historical period (2019-2024) driven by the rising prevalence of target diseases, technological advancements in gene therapy, and increasing investments in R&D. The market is projected to continue its growth trajectory during the forecast period (2025-2033), exhibiting a CAGR of xx% and reaching a market size of xx million units by 2033. This expansion is fueled by factors such as the increasing approval of gene therapies, the expansion of clinical trials, and growing adoption of viral vectors across various therapeutic areas. Technological disruptions, including improvements in vector design, manufacturing processes, and automation, further contribute to market growth. Consumer behavior, primarily driven by increasing awareness and acceptance of gene therapy, is a significant positive influence. Market penetration for viral vectors in gene therapy is expected to reach xx% by 2033.
Dominant Regions, Countries, or Segments in Viral Vector Manufacturing Market
North America currently holds the largest market share, driven by robust regulatory support, substantial R&D investments, and a strong presence of key market players. Europe follows closely, owing to a well-established healthcare infrastructure and expanding gene therapy sector. The Asia-Pacific region is witnessing rapid growth fueled by increasing healthcare expenditure, a burgeoning pharmaceutical industry, and growing awareness of gene therapy among clinicians.
By Type: Adeno-associated viral vectors (AAV) dominate the market owing to their safety profile and efficient transduction capabilities. Lentiviral vectors also hold a substantial share due to their ability to integrate into the host genome.
By Disease: Cancer treatment currently leads the market, owing to the high prevalence of cancer and the expanding use of viral vectors in oncolytic virotherapy and immunotherapy. Gene therapy applications for genetic disorders are also rapidly gaining traction.
- North America: Strong presence of key players, robust regulatory support, and high healthcare expenditure.
- Europe: Well-established healthcare infrastructure and growing adoption of gene therapies.
- Asia-Pacific: Rapid growth due to increasing healthcare spending, growing pharmaceutical industry, and supportive government initiatives.
- Adeno-associated Viral Vectors (AAV): Dominant segment due to safety and efficient gene delivery.
- Cancer: Largest disease segment, driven by increasing prevalence and diverse application in cancer treatment.
Viral Vector Manufacturing Market Product Landscape
The viral vector manufacturing market showcases continuous product innovation, encompassing advancements in vector design, production processes, and analytical tools. These improvements focus on enhancing the safety, efficacy, and scalability of viral vectors. Unique selling propositions often revolve around superior vector purity, higher transduction efficiency, and customized vector design to target specific cell types and tissues. Technological advancements are focused on improving the efficiency and scalability of manufacturing through automation, single-use technologies, and continuous processing.
Key Drivers, Barriers & Challenges in Viral Vector Manufacturing Market
Key Drivers:
- Growing demand for gene therapies and vaccines.
- Technological advancements in viral vector engineering and manufacturing.
- Increasing investments in R&D from both public and private sectors.
- Favorable regulatory policies in key markets.
Challenges:
- High manufacturing costs and complexity.
- Stringent regulatory requirements and lengthy approval processes.
- Potential for immunogenicity and safety concerns.
- Supply chain disruptions impacting raw material availability and cost.
- Competition from other gene therapy modalities.
Emerging Opportunities in Viral Vector Manufacturing Market
- Expanding application of viral vectors in novel therapeutic areas (e.g., regenerative medicine, infectious diseases beyond vaccines).
- Development of novel vector platforms with improved safety and efficacy profiles.
- Growth in personalized medicine approaches utilizing viral vectors for targeted therapies.
- Expansion into emerging markets with unmet medical needs.
Growth Accelerators in the Viral Vector Manufacturing Market Industry
Technological breakthroughs in viral vector engineering and manufacturing processes, such as the development of high-throughput manufacturing platforms and automated systems, are major growth drivers. Strategic partnerships between pharmaceutical companies, biotechnology firms, and contract manufacturing organizations (CMOs) facilitate market expansion and access to advanced technologies. Expanding into new therapeutic areas and emerging markets further accelerates growth.
Key Players Shaping the Viral Vector Manufacturing Market Market
- F Hoffmann-La Roche Ltd (Spark Therapeutics)
- Thermo Fisher Scientific Inc
- Danaher (Cytiva)
- Merck KGaA
- Sanofi
- Finvector
- Charles River Laboratories (Cobra Biologics)
- AstraZeneca
- Vibalogics
- Fujifilm Holdings Corporation (Fujifilm Diosynth Biotechnologies)
- uniQure NV
- Lonza
- Oxford Biomedica PLC
- Kaneka Eurogentec SA
- Johnson & Johnson (Janssen Global Services LLC)
Notable Milestones in Viral Vector Manufacturing Market Sector
- June 2022: Avid Bioservices, Inc. opened analytical and process development suites in its new viral vector manufacturing facility. CGMP manufacturing suites are expected online mid-2023.
- May 2022: AGC Biologics announced expansion of viral vector suspension technology and capacity at its Colorado campus.
In-Depth Viral Vector Manufacturing Market Market Outlook
The viral vector manufacturing market is poised for sustained growth, driven by technological advancements, increasing demand for gene therapies, and expansion into new therapeutic areas. Strategic partnerships, investments in manufacturing capacity, and the development of novel vector platforms will further enhance market potential. Significant opportunities exist in personalized medicine and the treatment of rare diseases, positioning the viral vector manufacturing sector for substantial long-term expansion.
Viral Vector Manufacturing Market Segmentation
-
1. Type
- 1.1. Adenoviral Vectors
- 1.2. Adeno-associated Viral Vectors
- 1.3. Lentiviral Vectors
- 1.4. Retroviral Vectors
- 1.5. Other Types
-
2. Disease
- 2.1. Cancer
- 2.2. Genetic Disorders
- 2.3. Infectious Diseases
- 2.4. Other Diseases
-
3. Application
- 3.1. Gene Therapy
- 3.2. Vaccinology
Viral Vector Manufacturing Market Segmentation By Geography
-
1. North America
- 1.1. United States
- 1.2. Canada
- 1.3. Mexico
-
2. Europe
- 2.1. Germany
- 2.2. United Kingdom
- 2.3. France
- 2.4. Italy
- 2.5. Spain
- 2.6. Rest of Europe
-
3. Asia Pacific
- 3.1. China
- 3.2. Japan
- 3.3. India
- 3.4. Australia
- 3.5. South Korea
- 3.6. Rest of Asia Pacific
- 4. Middle East
-
5. GCC
- 5.1. South Africa
- 5.2. Rest of Middle East
-
6. South America
- 6.1. Brazil
- 6.2. Argentina
- 6.3. Rest of South America
Viral Vector Manufacturing Market REPORT HIGHLIGHTS
| Aspects | Details |
|---|---|
| Study Period | 2019-2033 |
| Base Year | 2024 |
| Estimated Year | 2025 |
| Forecast Period | 2025-2033 |
| Historical Period | 2019-2024 |
| Growth Rate | CAGR of 27.36% from 2019-2033 |
| Segmentation |
|
Table of Contents
- 1. Introduction
- 1.1. Research Scope
- 1.2. Market Segmentation
- 1.3. Research Methodology
- 1.4. Definitions and Assumptions
- 2. Executive Summary
- 2.1. Introduction
- 3. Market Dynamics
- 3.1. Introduction
- 3.2. Market Drivers
- 3.2.1 Rising Prevalence of Genetic Disorders
- 3.2.2 Cancer
- 3.2.3 and Infectious Diseases; Increasing Number of Clinical Studies and Availability of Funding for Gene Therapy Development; Potential Applications in Novel Drug Delivery Approaches
- 3.3. Market Restrains
- 3.3.1. High Cost of Gene Therapies; Challenges in Viral Vector Manufacturing Capacity
- 3.4. Market Trends
- 3.4.1. Cancer Sub-segment is Expected to Grow Faster in the Disease Segment
- 4. Market Factor Analysis
- 4.1. Porters Five Forces
- 4.2. Supply/Value Chain
- 4.3. PESTEL analysis
- 4.4. Market Entropy
- 4.5. Patent/Trademark Analysis
- 5. Global Viral Vector Manufacturing Market Analysis, Insights and Forecast, 2019-2031
- 5.1. Market Analysis, Insights and Forecast - by Type
- 5.1.1. Adenoviral Vectors
- 5.1.2. Adeno-associated Viral Vectors
- 5.1.3. Lentiviral Vectors
- 5.1.4. Retroviral Vectors
- 5.1.5. Other Types
- 5.2. Market Analysis, Insights and Forecast - by Disease
- 5.2.1. Cancer
- 5.2.2. Genetic Disorders
- 5.2.3. Infectious Diseases
- 5.2.4. Other Diseases
- 5.3. Market Analysis, Insights and Forecast - by Application
- 5.3.1. Gene Therapy
- 5.3.2. Vaccinology
- 5.4. Market Analysis, Insights and Forecast - by Region
- 5.4.1. North America
- 5.4.2. Europe
- 5.4.3. Asia Pacific
- 5.4.4. Middle East
- 5.4.5. GCC
- 5.4.6. South America
- 5.1. Market Analysis, Insights and Forecast - by Type
- 6. North America Viral Vector Manufacturing Market Analysis, Insights and Forecast, 2019-2031
- 6.1. Market Analysis, Insights and Forecast - by Type
- 6.1.1. Adenoviral Vectors
- 6.1.2. Adeno-associated Viral Vectors
- 6.1.3. Lentiviral Vectors
- 6.1.4. Retroviral Vectors
- 6.1.5. Other Types
- 6.2. Market Analysis, Insights and Forecast - by Disease
- 6.2.1. Cancer
- 6.2.2. Genetic Disorders
- 6.2.3. Infectious Diseases
- 6.2.4. Other Diseases
- 6.3. Market Analysis, Insights and Forecast - by Application
- 6.3.1. Gene Therapy
- 6.3.2. Vaccinology
- 6.1. Market Analysis, Insights and Forecast - by Type
- 7. Europe Viral Vector Manufacturing Market Analysis, Insights and Forecast, 2019-2031
- 7.1. Market Analysis, Insights and Forecast - by Type
- 7.1.1. Adenoviral Vectors
- 7.1.2. Adeno-associated Viral Vectors
- 7.1.3. Lentiviral Vectors
- 7.1.4. Retroviral Vectors
- 7.1.5. Other Types
- 7.2. Market Analysis, Insights and Forecast - by Disease
- 7.2.1. Cancer
- 7.2.2. Genetic Disorders
- 7.2.3. Infectious Diseases
- 7.2.4. Other Diseases
- 7.3. Market Analysis, Insights and Forecast - by Application
- 7.3.1. Gene Therapy
- 7.3.2. Vaccinology
- 7.1. Market Analysis, Insights and Forecast - by Type
- 8. Asia Pacific Viral Vector Manufacturing Market Analysis, Insights and Forecast, 2019-2031
- 8.1. Market Analysis, Insights and Forecast - by Type
- 8.1.1. Adenoviral Vectors
- 8.1.2. Adeno-associated Viral Vectors
- 8.1.3. Lentiviral Vectors
- 8.1.4. Retroviral Vectors
- 8.1.5. Other Types
- 8.2. Market Analysis, Insights and Forecast - by Disease
- 8.2.1. Cancer
- 8.2.2. Genetic Disorders
- 8.2.3. Infectious Diseases
- 8.2.4. Other Diseases
- 8.3. Market Analysis, Insights and Forecast - by Application
- 8.3.1. Gene Therapy
- 8.3.2. Vaccinology
- 8.1. Market Analysis, Insights and Forecast - by Type
- 9. Middle East Viral Vector Manufacturing Market Analysis, Insights and Forecast, 2019-2031
- 9.1. Market Analysis, Insights and Forecast - by Type
- 9.1.1. Adenoviral Vectors
- 9.1.2. Adeno-associated Viral Vectors
- 9.1.3. Lentiviral Vectors
- 9.1.4. Retroviral Vectors
- 9.1.5. Other Types
- 9.2. Market Analysis, Insights and Forecast - by Disease
- 9.2.1. Cancer
- 9.2.2. Genetic Disorders
- 9.2.3. Infectious Diseases
- 9.2.4. Other Diseases
- 9.3. Market Analysis, Insights and Forecast - by Application
- 9.3.1. Gene Therapy
- 9.3.2. Vaccinology
- 9.1. Market Analysis, Insights and Forecast - by Type
- 10. GCC Viral Vector Manufacturing Market Analysis, Insights and Forecast, 2019-2031
- 10.1. Market Analysis, Insights and Forecast - by Type
- 10.1.1. Adenoviral Vectors
- 10.1.2. Adeno-associated Viral Vectors
- 10.1.3. Lentiviral Vectors
- 10.1.4. Retroviral Vectors
- 10.1.5. Other Types
- 10.2. Market Analysis, Insights and Forecast - by Disease
- 10.2.1. Cancer
- 10.2.2. Genetic Disorders
- 10.2.3. Infectious Diseases
- 10.2.4. Other Diseases
- 10.3. Market Analysis, Insights and Forecast - by Application
- 10.3.1. Gene Therapy
- 10.3.2. Vaccinology
- 10.1. Market Analysis, Insights and Forecast - by Type
- 11. South America Viral Vector Manufacturing Market Analysis, Insights and Forecast, 2019-2031
- 11.1. Market Analysis, Insights and Forecast - by Type
- 11.1.1. Adenoviral Vectors
- 11.1.2. Adeno-associated Viral Vectors
- 11.1.3. Lentiviral Vectors
- 11.1.4. Retroviral Vectors
- 11.1.5. Other Types
- 11.2. Market Analysis, Insights and Forecast - by Disease
- 11.2.1. Cancer
- 11.2.2. Genetic Disorders
- 11.2.3. Infectious Diseases
- 11.2.4. Other Diseases
- 11.3. Market Analysis, Insights and Forecast - by Application
- 11.3.1. Gene Therapy
- 11.3.2. Vaccinology
- 11.1. Market Analysis, Insights and Forecast - by Type
- 12. North America Viral Vector Manufacturing Market Analysis, Insights and Forecast, 2019-2031
- 12.1. Market Analysis, Insights and Forecast - By Country/Sub-region
- 12.1.1 United States
- 12.1.2 Canada
- 12.1.3 Mexico
- 13. Europe Viral Vector Manufacturing Market Analysis, Insights and Forecast, 2019-2031
- 13.1. Market Analysis, Insights and Forecast - By Country/Sub-region
- 13.1.1 Germany
- 13.1.2 United Kingdom
- 13.1.3 France
- 13.1.4 Italy
- 13.1.5 Spain
- 13.1.6 Rest of Europe
- 14. Asia Pacific Viral Vector Manufacturing Market Analysis, Insights and Forecast, 2019-2031
- 14.1. Market Analysis, Insights and Forecast - By Country/Sub-region
- 14.1.1 China
- 14.1.2 Japan
- 14.1.3 India
- 14.1.4 Australia
- 14.1.5 South Korea
- 14.1.6 Rest of Asia Pacific
- 15. Middle East Viral Vector Manufacturing Market Analysis, Insights and Forecast, 2019-2031
- 15.1. Market Analysis, Insights and Forecast - By Country/Sub-region
- 15.1.1 United Arab Emirates
- 15.1.2 Saudi Arabia
- 15.1.3 Qatar
- 15.1.4 Israel
- 15.1.5 Egypt
- 15.1.6 Oman
- 15.1.7 Rest of Middle East
- 16. GCC Viral Vector Manufacturing Market Analysis, Insights and Forecast, 2019-2031
- 16.1. Market Analysis, Insights and Forecast - By Country/Sub-region
- 16.1.1 South Africa
- 16.1.2 Rest of Middle East
- 17. South America Viral Vector Manufacturing Market Analysis, Insights and Forecast, 2019-2031
- 17.1. Market Analysis, Insights and Forecast - By Country/Sub-region
- 17.1.1 Brazil
- 17.1.2 Argentina
- 17.1.3 Rest of South America
- 18. Competitive Analysis
- 18.1. Global Market Share Analysis 2024
- 18.2. Company Profiles
- 18.2.1 F Hoffmann-La Roche Ltd (Spark Therapeutics)
- 18.2.1.1. Overview
- 18.2.1.2. Products
- 18.2.1.3. SWOT Analysis
- 18.2.1.4. Recent Developments
- 18.2.1.5. Financials (Based on Availability)
- 18.2.2 Thermo Fisher Scientific Inc
- 18.2.2.1. Overview
- 18.2.2.2. Products
- 18.2.2.3. SWOT Analysis
- 18.2.2.4. Recent Developments
- 18.2.2.5. Financials (Based on Availability)
- 18.2.3 Danaher (Cytiva)
- 18.2.3.1. Overview
- 18.2.3.2. Products
- 18.2.3.3. SWOT Analysis
- 18.2.3.4. Recent Developments
- 18.2.3.5. Financials (Based on Availability)
- 18.2.4 Merck KGaA
- 18.2.4.1. Overview
- 18.2.4.2. Products
- 18.2.4.3. SWOT Analysis
- 18.2.4.4. Recent Developments
- 18.2.4.5. Financials (Based on Availability)
- 18.2.5 Sanofi
- 18.2.5.1. Overview
- 18.2.5.2. Products
- 18.2.5.3. SWOT Analysis
- 18.2.5.4. Recent Developments
- 18.2.5.5. Financials (Based on Availability)
- 18.2.6 Finvector
- 18.2.6.1. Overview
- 18.2.6.2. Products
- 18.2.6.3. SWOT Analysis
- 18.2.6.4. Recent Developments
- 18.2.6.5. Financials (Based on Availability)
- 18.2.7 Charles River Laboratories (Cobra Biologics)
- 18.2.7.1. Overview
- 18.2.7.2. Products
- 18.2.7.3. SWOT Analysis
- 18.2.7.4. Recent Developments
- 18.2.7.5. Financials (Based on Availability)
- 18.2.8 AstraZeneca
- 18.2.8.1. Overview
- 18.2.8.2. Products
- 18.2.8.3. SWOT Analysis
- 18.2.8.4. Recent Developments
- 18.2.8.5. Financials (Based on Availability)
- 18.2.9 Vibalogics
- 18.2.9.1. Overview
- 18.2.9.2. Products
- 18.2.9.3. SWOT Analysis
- 18.2.9.4. Recent Developments
- 18.2.9.5. Financials (Based on Availability)
- 18.2.10 Fujifilm Holdings Corporation (Fujifilm Diosynth Biotechnologies)
- 18.2.10.1. Overview
- 18.2.10.2. Products
- 18.2.10.3. SWOT Analysis
- 18.2.10.4. Recent Developments
- 18.2.10.5. Financials (Based on Availability)
- 18.2.11 uniQure NV
- 18.2.11.1. Overview
- 18.2.11.2. Products
- 18.2.11.3. SWOT Analysis
- 18.2.11.4. Recent Developments
- 18.2.11.5. Financials (Based on Availability)
- 18.2.12 Lonza
- 18.2.12.1. Overview
- 18.2.12.2. Products
- 18.2.12.3. SWOT Analysis
- 18.2.12.4. Recent Developments
- 18.2.12.5. Financials (Based on Availability)
- 18.2.13 Oxford Biomedica PLC
- 18.2.13.1. Overview
- 18.2.13.2. Products
- 18.2.13.3. SWOT Analysis
- 18.2.13.4. Recent Developments
- 18.2.13.5. Financials (Based on Availability)
- 18.2.14 Kaneka Eurogentec SA
- 18.2.14.1. Overview
- 18.2.14.2. Products
- 18.2.14.3. SWOT Analysis
- 18.2.14.4. Recent Developments
- 18.2.14.5. Financials (Based on Availability)
- 18.2.15 Johnson & Johnson (Janssen Global Services LLC)
- 18.2.15.1. Overview
- 18.2.15.2. Products
- 18.2.15.3. SWOT Analysis
- 18.2.15.4. Recent Developments
- 18.2.15.5. Financials (Based on Availability)
- 18.2.1 F Hoffmann-La Roche Ltd (Spark Therapeutics)
List of Figures
- Figure 1: Global Viral Vector Manufacturing Market Revenue Breakdown (Million, %) by Region 2024 & 2032
- Figure 2: North America Viral Vector Manufacturing Market Revenue (Million), by Country 2024 & 2032
- Figure 3: North America Viral Vector Manufacturing Market Revenue Share (%), by Country 2024 & 2032
- Figure 4: Europe Viral Vector Manufacturing Market Revenue (Million), by Country 2024 & 2032
- Figure 5: Europe Viral Vector Manufacturing Market Revenue Share (%), by Country 2024 & 2032
- Figure 6: Asia Pacific Viral Vector Manufacturing Market Revenue (Million), by Country 2024 & 2032
- Figure 7: Asia Pacific Viral Vector Manufacturing Market Revenue Share (%), by Country 2024 & 2032
- Figure 8: Middle East Viral Vector Manufacturing Market Revenue (Million), by Country 2024 & 2032
- Figure 9: Middle East Viral Vector Manufacturing Market Revenue Share (%), by Country 2024 & 2032
- Figure 10: GCC Viral Vector Manufacturing Market Revenue (Million), by Country 2024 & 2032
- Figure 11: GCC Viral Vector Manufacturing Market Revenue Share (%), by Country 2024 & 2032
- Figure 12: South America Viral Vector Manufacturing Market Revenue (Million), by Country 2024 & 2032
- Figure 13: South America Viral Vector Manufacturing Market Revenue Share (%), by Country 2024 & 2032
- Figure 14: North America Viral Vector Manufacturing Market Revenue (Million), by Type 2024 & 2032
- Figure 15: North America Viral Vector Manufacturing Market Revenue Share (%), by Type 2024 & 2032
- Figure 16: North America Viral Vector Manufacturing Market Revenue (Million), by Disease 2024 & 2032
- Figure 17: North America Viral Vector Manufacturing Market Revenue Share (%), by Disease 2024 & 2032
- Figure 18: North America Viral Vector Manufacturing Market Revenue (Million), by Application 2024 & 2032
- Figure 19: North America Viral Vector Manufacturing Market Revenue Share (%), by Application 2024 & 2032
- Figure 20: North America Viral Vector Manufacturing Market Revenue (Million), by Country 2024 & 2032
- Figure 21: North America Viral Vector Manufacturing Market Revenue Share (%), by Country 2024 & 2032
- Figure 22: Europe Viral Vector Manufacturing Market Revenue (Million), by Type 2024 & 2032
- Figure 23: Europe Viral Vector Manufacturing Market Revenue Share (%), by Type 2024 & 2032
- Figure 24: Europe Viral Vector Manufacturing Market Revenue (Million), by Disease 2024 & 2032
- Figure 25: Europe Viral Vector Manufacturing Market Revenue Share (%), by Disease 2024 & 2032
- Figure 26: Europe Viral Vector Manufacturing Market Revenue (Million), by Application 2024 & 2032
- Figure 27: Europe Viral Vector Manufacturing Market Revenue Share (%), by Application 2024 & 2032
- Figure 28: Europe Viral Vector Manufacturing Market Revenue (Million), by Country 2024 & 2032
- Figure 29: Europe Viral Vector Manufacturing Market Revenue Share (%), by Country 2024 & 2032
- Figure 30: Asia Pacific Viral Vector Manufacturing Market Revenue (Million), by Type 2024 & 2032
- Figure 31: Asia Pacific Viral Vector Manufacturing Market Revenue Share (%), by Type 2024 & 2032
- Figure 32: Asia Pacific Viral Vector Manufacturing Market Revenue (Million), by Disease 2024 & 2032
- Figure 33: Asia Pacific Viral Vector Manufacturing Market Revenue Share (%), by Disease 2024 & 2032
- Figure 34: Asia Pacific Viral Vector Manufacturing Market Revenue (Million), by Application 2024 & 2032
- Figure 35: Asia Pacific Viral Vector Manufacturing Market Revenue Share (%), by Application 2024 & 2032
- Figure 36: Asia Pacific Viral Vector Manufacturing Market Revenue (Million), by Country 2024 & 2032
- Figure 37: Asia Pacific Viral Vector Manufacturing Market Revenue Share (%), by Country 2024 & 2032
- Figure 38: Middle East Viral Vector Manufacturing Market Revenue (Million), by Type 2024 & 2032
- Figure 39: Middle East Viral Vector Manufacturing Market Revenue Share (%), by Type 2024 & 2032
- Figure 40: Middle East Viral Vector Manufacturing Market Revenue (Million), by Disease 2024 & 2032
- Figure 41: Middle East Viral Vector Manufacturing Market Revenue Share (%), by Disease 2024 & 2032
- Figure 42: Middle East Viral Vector Manufacturing Market Revenue (Million), by Application 2024 & 2032
- Figure 43: Middle East Viral Vector Manufacturing Market Revenue Share (%), by Application 2024 & 2032
- Figure 44: Middle East Viral Vector Manufacturing Market Revenue (Million), by Country 2024 & 2032
- Figure 45: Middle East Viral Vector Manufacturing Market Revenue Share (%), by Country 2024 & 2032
- Figure 46: GCC Viral Vector Manufacturing Market Revenue (Million), by Type 2024 & 2032
- Figure 47: GCC Viral Vector Manufacturing Market Revenue Share (%), by Type 2024 & 2032
- Figure 48: GCC Viral Vector Manufacturing Market Revenue (Million), by Disease 2024 & 2032
- Figure 49: GCC Viral Vector Manufacturing Market Revenue Share (%), by Disease 2024 & 2032
- Figure 50: GCC Viral Vector Manufacturing Market Revenue (Million), by Application 2024 & 2032
- Figure 51: GCC Viral Vector Manufacturing Market Revenue Share (%), by Application 2024 & 2032
- Figure 52: GCC Viral Vector Manufacturing Market Revenue (Million), by Country 2024 & 2032
- Figure 53: GCC Viral Vector Manufacturing Market Revenue Share (%), by Country 2024 & 2032
- Figure 54: South America Viral Vector Manufacturing Market Revenue (Million), by Type 2024 & 2032
- Figure 55: South America Viral Vector Manufacturing Market Revenue Share (%), by Type 2024 & 2032
- Figure 56: South America Viral Vector Manufacturing Market Revenue (Million), by Disease 2024 & 2032
- Figure 57: South America Viral Vector Manufacturing Market Revenue Share (%), by Disease 2024 & 2032
- Figure 58: South America Viral Vector Manufacturing Market Revenue (Million), by Application 2024 & 2032
- Figure 59: South America Viral Vector Manufacturing Market Revenue Share (%), by Application 2024 & 2032
- Figure 60: South America Viral Vector Manufacturing Market Revenue (Million), by Country 2024 & 2032
- Figure 61: South America Viral Vector Manufacturing Market Revenue Share (%), by Country 2024 & 2032
List of Tables
- Table 1: Global Viral Vector Manufacturing Market Revenue Million Forecast, by Region 2019 & 2032
- Table 2: Global Viral Vector Manufacturing Market Revenue Million Forecast, by Type 2019 & 2032
- Table 3: Global Viral Vector Manufacturing Market Revenue Million Forecast, by Disease 2019 & 2032
- Table 4: Global Viral Vector Manufacturing Market Revenue Million Forecast, by Application 2019 & 2032
- Table 5: Global Viral Vector Manufacturing Market Revenue Million Forecast, by Region 2019 & 2032
- Table 6: Global Viral Vector Manufacturing Market Revenue Million Forecast, by Country 2019 & 2032
- Table 7: United States Viral Vector Manufacturing Market Revenue (Million) Forecast, by Application 2019 & 2032
- Table 8: Canada Viral Vector Manufacturing Market Revenue (Million) Forecast, by Application 2019 & 2032
- Table 9: Mexico Viral Vector Manufacturing Market Revenue (Million) Forecast, by Application 2019 & 2032
- Table 10: Global Viral Vector Manufacturing Market Revenue Million Forecast, by Country 2019 & 2032
- Table 11: Germany Viral Vector Manufacturing Market Revenue (Million) Forecast, by Application 2019 & 2032
- Table 12: United Kingdom Viral Vector Manufacturing Market Revenue (Million) Forecast, by Application 2019 & 2032
- Table 13: France Viral Vector Manufacturing Market Revenue (Million) Forecast, by Application 2019 & 2032
- Table 14: Italy Viral Vector Manufacturing Market Revenue (Million) Forecast, by Application 2019 & 2032
- Table 15: Spain Viral Vector Manufacturing Market Revenue (Million) Forecast, by Application 2019 & 2032
- Table 16: Rest of Europe Viral Vector Manufacturing Market Revenue (Million) Forecast, by Application 2019 & 2032
- Table 17: Global Viral Vector Manufacturing Market Revenue Million Forecast, by Country 2019 & 2032
- Table 18: China Viral Vector Manufacturing Market Revenue (Million) Forecast, by Application 2019 & 2032
- Table 19: Japan Viral Vector Manufacturing Market Revenue (Million) Forecast, by Application 2019 & 2032
- Table 20: India Viral Vector Manufacturing Market Revenue (Million) Forecast, by Application 2019 & 2032
- Table 21: Australia Viral Vector Manufacturing Market Revenue (Million) Forecast, by Application 2019 & 2032
- Table 22: South Korea Viral Vector Manufacturing Market Revenue (Million) Forecast, by Application 2019 & 2032
- Table 23: Rest of Asia Pacific Viral Vector Manufacturing Market Revenue (Million) Forecast, by Application 2019 & 2032
- Table 24: Global Viral Vector Manufacturing Market Revenue Million Forecast, by Country 2019 & 2032
- Table 25: United Arab Emirates Viral Vector Manufacturing Market Revenue (Million) Forecast, by Application 2019 & 2032
- Table 26: Saudi Arabia Viral Vector Manufacturing Market Revenue (Million) Forecast, by Application 2019 & 2032
- Table 27: Qatar Viral Vector Manufacturing Market Revenue (Million) Forecast, by Application 2019 & 2032
- Table 28: Israel Viral Vector Manufacturing Market Revenue (Million) Forecast, by Application 2019 & 2032
- Table 29: Egypt Viral Vector Manufacturing Market Revenue (Million) Forecast, by Application 2019 & 2032
- Table 30: Oman Viral Vector Manufacturing Market Revenue (Million) Forecast, by Application 2019 & 2032
- Table 31: Rest of Middle East Viral Vector Manufacturing Market Revenue (Million) Forecast, by Application 2019 & 2032
- Table 32: Global Viral Vector Manufacturing Market Revenue Million Forecast, by Country 2019 & 2032
- Table 33: South Africa Viral Vector Manufacturing Market Revenue (Million) Forecast, by Application 2019 & 2032
- Table 34: Rest of Middle East Viral Vector Manufacturing Market Revenue (Million) Forecast, by Application 2019 & 2032
- Table 35: Global Viral Vector Manufacturing Market Revenue Million Forecast, by Country 2019 & 2032
- Table 36: Brazil Viral Vector Manufacturing Market Revenue (Million) Forecast, by Application 2019 & 2032
- Table 37: Argentina Viral Vector Manufacturing Market Revenue (Million) Forecast, by Application 2019 & 2032
- Table 38: Rest of South America Viral Vector Manufacturing Market Revenue (Million) Forecast, by Application 2019 & 2032
- Table 39: Global Viral Vector Manufacturing Market Revenue Million Forecast, by Type 2019 & 2032
- Table 40: Global Viral Vector Manufacturing Market Revenue Million Forecast, by Disease 2019 & 2032
- Table 41: Global Viral Vector Manufacturing Market Revenue Million Forecast, by Application 2019 & 2032
- Table 42: Global Viral Vector Manufacturing Market Revenue Million Forecast, by Country 2019 & 2032
- Table 43: United States Viral Vector Manufacturing Market Revenue (Million) Forecast, by Application 2019 & 2032
- Table 44: Canada Viral Vector Manufacturing Market Revenue (Million) Forecast, by Application 2019 & 2032
- Table 45: Mexico Viral Vector Manufacturing Market Revenue (Million) Forecast, by Application 2019 & 2032
- Table 46: Global Viral Vector Manufacturing Market Revenue Million Forecast, by Type 2019 & 2032
- Table 47: Global Viral Vector Manufacturing Market Revenue Million Forecast, by Disease 2019 & 2032
- Table 48: Global Viral Vector Manufacturing Market Revenue Million Forecast, by Application 2019 & 2032
- Table 49: Global Viral Vector Manufacturing Market Revenue Million Forecast, by Country 2019 & 2032
- Table 50: Germany Viral Vector Manufacturing Market Revenue (Million) Forecast, by Application 2019 & 2032
- Table 51: United Kingdom Viral Vector Manufacturing Market Revenue (Million) Forecast, by Application 2019 & 2032
- Table 52: France Viral Vector Manufacturing Market Revenue (Million) Forecast, by Application 2019 & 2032
- Table 53: Italy Viral Vector Manufacturing Market Revenue (Million) Forecast, by Application 2019 & 2032
- Table 54: Spain Viral Vector Manufacturing Market Revenue (Million) Forecast, by Application 2019 & 2032
- Table 55: Rest of Europe Viral Vector Manufacturing Market Revenue (Million) Forecast, by Application 2019 & 2032
- Table 56: Global Viral Vector Manufacturing Market Revenue Million Forecast, by Type 2019 & 2032
- Table 57: Global Viral Vector Manufacturing Market Revenue Million Forecast, by Disease 2019 & 2032
- Table 58: Global Viral Vector Manufacturing Market Revenue Million Forecast, by Application 2019 & 2032
- Table 59: Global Viral Vector Manufacturing Market Revenue Million Forecast, by Country 2019 & 2032
- Table 60: China Viral Vector Manufacturing Market Revenue (Million) Forecast, by Application 2019 & 2032
- Table 61: Japan Viral Vector Manufacturing Market Revenue (Million) Forecast, by Application 2019 & 2032
- Table 62: India Viral Vector Manufacturing Market Revenue (Million) Forecast, by Application 2019 & 2032
- Table 63: Australia Viral Vector Manufacturing Market Revenue (Million) Forecast, by Application 2019 & 2032
- Table 64: South Korea Viral Vector Manufacturing Market Revenue (Million) Forecast, by Application 2019 & 2032
- Table 65: Rest of Asia Pacific Viral Vector Manufacturing Market Revenue (Million) Forecast, by Application 2019 & 2032
- Table 66: Global Viral Vector Manufacturing Market Revenue Million Forecast, by Type 2019 & 2032
- Table 67: Global Viral Vector Manufacturing Market Revenue Million Forecast, by Disease 2019 & 2032
- Table 68: Global Viral Vector Manufacturing Market Revenue Million Forecast, by Application 2019 & 2032
- Table 69: Global Viral Vector Manufacturing Market Revenue Million Forecast, by Country 2019 & 2032
- Table 70: Global Viral Vector Manufacturing Market Revenue Million Forecast, by Type 2019 & 2032
- Table 71: Global Viral Vector Manufacturing Market Revenue Million Forecast, by Disease 2019 & 2032
- Table 72: Global Viral Vector Manufacturing Market Revenue Million Forecast, by Application 2019 & 2032
- Table 73: Global Viral Vector Manufacturing Market Revenue Million Forecast, by Country 2019 & 2032
- Table 74: South Africa Viral Vector Manufacturing Market Revenue (Million) Forecast, by Application 2019 & 2032
- Table 75: Rest of Middle East Viral Vector Manufacturing Market Revenue (Million) Forecast, by Application 2019 & 2032
- Table 76: Global Viral Vector Manufacturing Market Revenue Million Forecast, by Type 2019 & 2032
- Table 77: Global Viral Vector Manufacturing Market Revenue Million Forecast, by Disease 2019 & 2032
- Table 78: Global Viral Vector Manufacturing Market Revenue Million Forecast, by Application 2019 & 2032
- Table 79: Global Viral Vector Manufacturing Market Revenue Million Forecast, by Country 2019 & 2032
- Table 80: Brazil Viral Vector Manufacturing Market Revenue (Million) Forecast, by Application 2019 & 2032
- Table 81: Argentina Viral Vector Manufacturing Market Revenue (Million) Forecast, by Application 2019 & 2032
- Table 82: Rest of South America Viral Vector Manufacturing Market Revenue (Million) Forecast, by Application 2019 & 2032
Frequently Asked Questions
1. What is the projected Compound Annual Growth Rate (CAGR) of the Viral Vector Manufacturing Market?
The projected CAGR is approximately 27.36%.
2. Which companies are prominent players in the Viral Vector Manufacturing Market?
Key companies in the market include F Hoffmann-La Roche Ltd (Spark Therapeutics), Thermo Fisher Scientific Inc, Danaher (Cytiva), Merck KGaA, Sanofi, Finvector, Charles River Laboratories (Cobra Biologics), AstraZeneca, Vibalogics, Fujifilm Holdings Corporation (Fujifilm Diosynth Biotechnologies), uniQure NV, Lonza, Oxford Biomedica PLC, Kaneka Eurogentec SA, Johnson & Johnson (Janssen Global Services LLC).
3. What are the main segments of the Viral Vector Manufacturing Market?
The market segments include Type, Disease, Application.
4. Can you provide details about the market size?
The market size is estimated to be USD 1.25 Million as of 2022.
5. What are some drivers contributing to market growth?
Rising Prevalence of Genetic Disorders. Cancer. and Infectious Diseases; Increasing Number of Clinical Studies and Availability of Funding for Gene Therapy Development; Potential Applications in Novel Drug Delivery Approaches.
6. What are the notable trends driving market growth?
Cancer Sub-segment is Expected to Grow Faster in the Disease Segment.
7. Are there any restraints impacting market growth?
High Cost of Gene Therapies; Challenges in Viral Vector Manufacturing Capacity.
8. Can you provide examples of recent developments in the market?
In June 2022, Avid Bioservices, Inc. opened the analytical and process development (AD/PD) suites within the company's new, world-class viral vector development and Current Good manufacturing Plant (CGMP) manufacturing facility. Build-out of the viral vector facility's CGMP manufacturing suites is ongoing, with those capabilities expected to come online in mid-calendar 2023.
9. What pricing options are available for accessing the report?
Pricing options include single-user, multi-user, and enterprise licenses priced at USD 4750, USD 5250, and USD 8750 respectively.
10. Is the market size provided in terms of value or volume?
The market size is provided in terms of value, measured in Million.
11. Are there any specific market keywords associated with the report?
Yes, the market keyword associated with the report is "Viral Vector Manufacturing Market," which aids in identifying and referencing the specific market segment covered.
12. How do I determine which pricing option suits my needs best?
The pricing options vary based on user requirements and access needs. Individual users may opt for single-user licenses, while businesses requiring broader access may choose multi-user or enterprise licenses for cost-effective access to the report.
13. Are there any additional resources or data provided in the Viral Vector Manufacturing Market report?
While the report offers comprehensive insights, it's advisable to review the specific contents or supplementary materials provided to ascertain if additional resources or data are available.
14. How can I stay updated on further developments or reports in the Viral Vector Manufacturing Market?
To stay informed about further developments, trends, and reports in the Viral Vector Manufacturing Market, consider subscribing to industry newsletters, following relevant companies and organizations, or regularly checking reputable industry news sources and publications.
Methodology
Step 1 - Identification of Relevant Samples Size from Population Database


Step 2 - Approaches for Defining Global Market Size (Value, Volume* & Price*)

Note*: In applicable scenarios
Step 3 - Data Sources
Primary Research
- Web Analytics
- Survey Reports
- Research Institute
- Latest Research Reports
- Opinion Leaders
Secondary Research
- Annual Reports
- White Paper
- Latest Press Release
- Industry Association
- Paid Database
- Investor Presentations

Step 4 - Data Triangulation
Involves using different sources of information in order to increase the validity of a study
These sources are likely to be stakeholders in a program - participants, other researchers, program staff, other community members, and so on.
Then we put all data in single framework & apply various statistical tools to find out the dynamic on the market.
During the analysis stage, feedback from the stakeholder groups would be compared to determine areas of agreement as well as areas of divergence


