

Key Insights
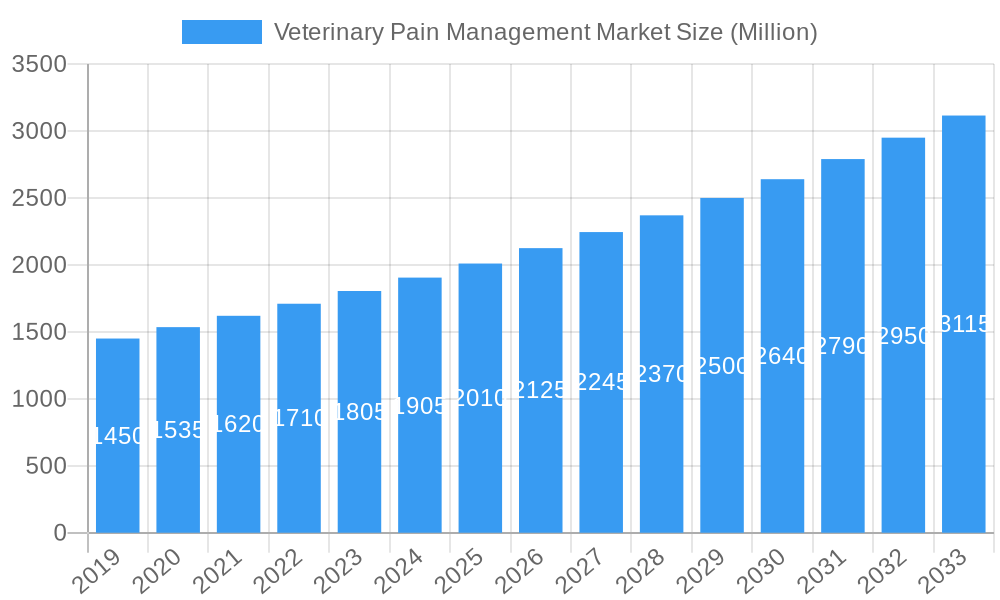
The global veterinary pain management market is poised for robust growth, projected to reach an estimated $1.98 billion by 2025, expanding at a healthy Compound Annual Growth Rate (CAGR) of 5.91% through 2033. This expansion is fueled by an increasing pet population, a growing humanization of pets trend that leads to greater investment in animal healthcare, and advancements in veterinary medicine that offer more effective pain relief solutions. The market's trajectory is significantly influenced by rising disposable incomes in developed and emerging economies, enabling pet owners to afford comprehensive care, including pain management for chronic conditions and post-operative recovery. Furthermore, a growing awareness among veterinarians and pet owners regarding the importance of proactive pain management for animal welfare and quality of life is a key driver. Innovations in drug formulations, delivery systems, and the development of targeted therapies are also contributing to market dynamism.
Veterinary Pain Management Market Market Size (In Billion)
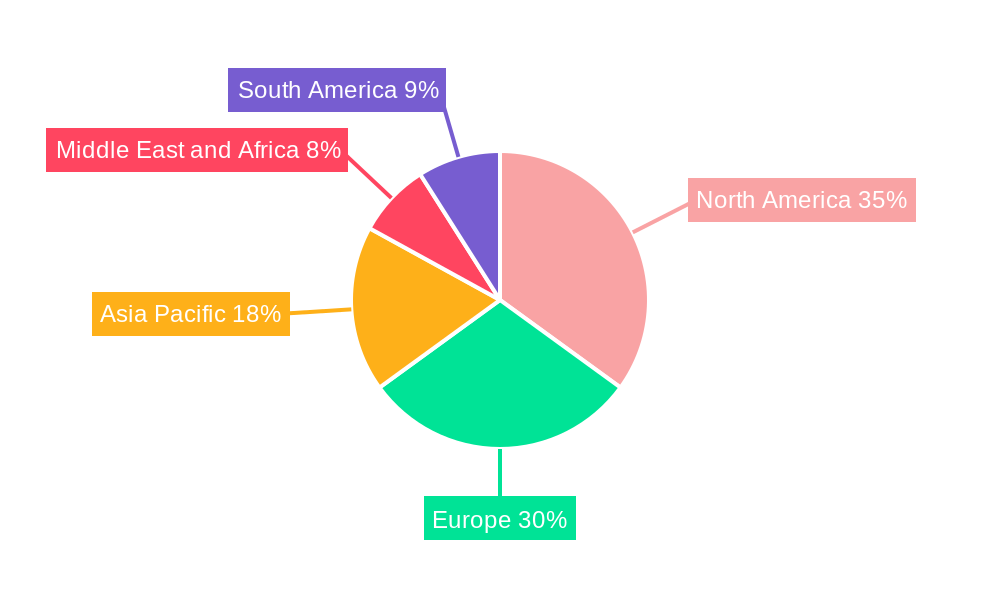
The veterinary pain management market is segmented into various product types, including drugs (NSAIDs, anesthetics, opioids, and other pain relief medications) and devices such as laser therapy and electromagnetic therapy. The application spectrum is broad, encompassing osteoarthritis and joint pain, postoperative pain, cancer pain, and other pain-related conditions. Companion animals represent a significant segment, driven by the rising trend of pet ownership and the increasing willingness of owners to spend on their pets' well-being. Hospitals and clinics are the primary end-users, followed by retail outlets. Geographically, North America and Europe currently dominate the market due to advanced healthcare infrastructure and high pet expenditure. However, the Asia Pacific region is expected to witness substantial growth due to increasing pet ownership and a burgeoning veterinary care sector. While the market exhibits strong growth potential, challenges such as the cost of advanced treatments and the need for greater awareness regarding specific pain management protocols in certain regions may present hurdles.
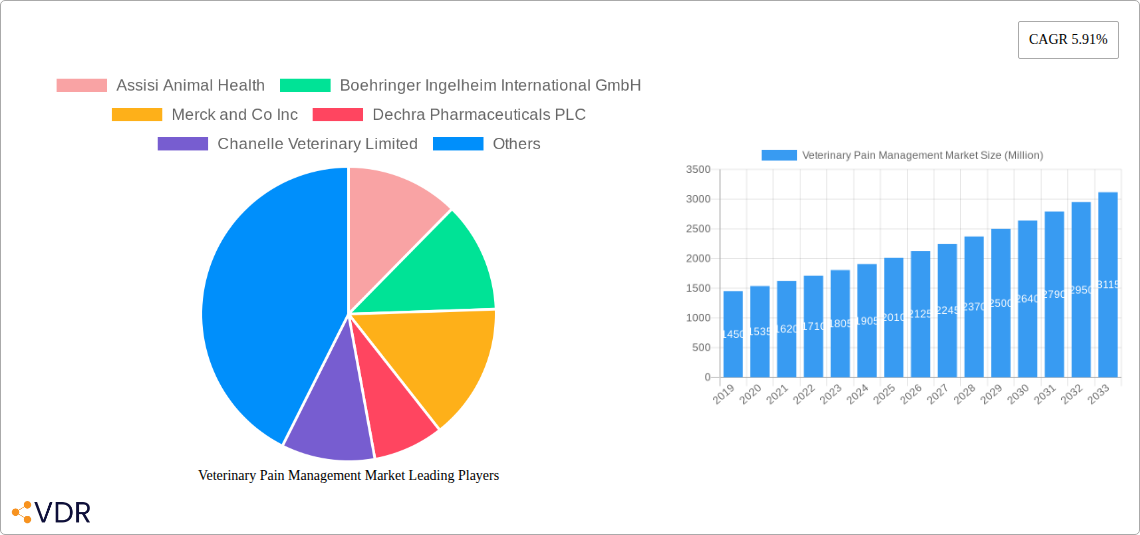
Veterinary Pain Management Market Company Market Share
Veterinary Pain Management Market: Comprehensive Market Analysis and Growth Projections (2019-2033)
This in-depth report provides a detailed analysis of the global Veterinary Pain Management Market, offering critical insights into market dynamics, growth trends, regional dominance, product landscape, key drivers, emerging opportunities, growth accelerators, and competitive intelligence. Covering the period from 2019 to 2033, with a base year of 2025 and a forecast period extending to 2033, this research is indispensable for stakeholders seeking to understand and capitalize on the evolving landscape of animal pain relief. The report analyzes the market in millions of units, providing quantitative data alongside qualitative insights to guide strategic decision-making.
Veterinary Pain Management Market Market Dynamics & Structure
The Veterinary Pain Management Market is characterized by a moderately fragmented structure, with established global players and emerging regional specialists vying for market share. Technological innovation is a primary driver, fueled by a growing understanding of animal physiology and the development of novel analgesic compounds and advanced therapeutic devices. Regulatory frameworks, such as those governed by the FDA and EMA, play a crucial role in ensuring product safety and efficacy, impacting market entry and product approvals. Competitive product substitutes are readily available, particularly within the drug segment, necessitating continuous innovation and differentiation. End-user demographics are shifting, with increasing pet ownership and a greater willingness among owners to invest in advanced veterinary care, driving demand for specialized pain management solutions. Mergers and acquisitions (M&A) trends are evident as larger companies seek to expand their portfolios and market reach, consolidating market power. For instance, the acquisition of smaller biotech firms by major animal health corporations has been observed, aiming to integrate novel technologies. Innovation barriers include the lengthy and expensive process of drug discovery and clinical trials, as well as the need for specialized veterinary expertise in administering certain therapies.
Veterinary Pain Management Market Growth Trends & Insights
The Veterinary Pain Management Market is poised for significant expansion, projected to grow at a robust Compound Annual Growth Rate (CAGR) of XX% from 2025 to 2033. This growth is propelled by a confluence of factors, including the escalating prevalence of chronic conditions such as osteoarthritis in companion animals, a growing humanization of pets trend leading to increased spending on animal healthcare, and advancements in veterinary surgical procedures requiring effective postoperative pain management. The adoption rate of both pharmaceutical and technological pain management solutions is accelerating as veterinarians and pet owners become more aware of the benefits of proactive pain control. Technological disruptions are reshaping the market, with the development of less invasive and more targeted pain relief methods gaining traction. Consumer behavior shifts are evident, with owners increasingly seeking holistic and long-term pain management strategies rather than solely focusing on acute symptom relief. The market penetration of advanced pain management products is expected to deepen, particularly in developed economies, while emerging markets present substantial untapped potential. For example, the market size for veterinary analgesics is estimated to reach USD XXXX million by 2033, up from USD XXXX million in 2025.
Dominant Regions, Countries, or Segments in Veterinary Pain Management Market
North America currently holds a dominant position in the Veterinary Pain Management Market, driven by high pet ownership rates, advanced veterinary infrastructure, and a strong emphasis on animal welfare. The United States, in particular, leads the market due to substantial investments in veterinary research and development, a well-established regulatory framework, and a financially capable pet owner demographic willing to spend on premium veterinary services. The Companion animal segment is the primary growth engine, fueled by the increasing incidence of age-related ailments like osteoarthritis and joint pain, necessitating continuous pain management interventions.
Within the Product segment, Drugs are expected to maintain their leading share, with NSAIDs (Non-Steroidal Anti-Inflammatory Drugs) remaining a cornerstone of pain management due to their efficacy and widespread availability. However, Opioids are gaining traction for severe pain management, while Anesthetics are crucial for surgical procedures. The Devices segment, particularly Laser Therapy, is experiencing rapid growth due to its non-invasive nature and ability to accelerate healing and reduce inflammation.
In terms of Application, Osteoarthritis and Joint Pain represent the largest and fastest-growing application, directly correlating with the aging companion animal population. Postoperative Pain management also contributes significantly, driven by the increasing number of elective surgeries performed on pets. The Hospitals and Clinics end-user segment accounts for the largest market share, as these facilities are equipped to diagnose, treat, and administer complex pain management therapies. The Retail Outlet segment is also growing, with over-the-counter pain relief products and complementary therapies becoming more accessible to pet owners.
Veterinary Pain Management Market Product Landscape
The veterinary pain management product landscape is characterized by continuous innovation and diversification. In the Drugs segment, advancements are focused on developing drugs with improved efficacy, reduced side effects, and novel mechanisms of action, including targeted analgesics and combination therapies. For Devices, the emphasis is on non-invasive technologies like advanced laser therapy systems offering enhanced therapeutic outcomes, faster recovery times, and greater owner compliance. Electromagnetic therapy is also emerging as a valuable adjunctive treatment for chronic pain conditions. These innovations are crucial in addressing the growing demand for advanced and patient-friendly pain management solutions in veterinary medicine.
Key Drivers, Barriers & Challenges in Veterinary Pain Management Market
Key Drivers:
- Rising Pet Ownership and Humanization of Pets: Increased emotional attachment leads to greater spending on pet healthcare, including pain management.
- Growing Prevalence of Chronic Diseases: Conditions like osteoarthritis and cancer in animals necessitate long-term pain relief solutions.
- Technological Advancements: Development of novel drugs and less invasive therapeutic devices enhances treatment efficacy and patient comfort.
- Increasing Veterinarian Awareness and Training: Enhanced knowledge of pain assessment and management techniques promotes proactive treatment.
- Favorable Regulatory Environment for Animal Health Products: Streamlined approval processes can accelerate market entry for innovative solutions.
Key Barriers & Challenges:
- High Cost of Advanced Treatments: Sophisticated drugs and devices can be prohibitively expensive for some pet owners, limiting adoption.
- Limited Awareness of Pain in Animals: Under-diagnosis and under-treatment of pain remain significant challenges, particularly in non-companion animals.
- Stringent Regulatory Hurdles and Long Approval Times: Developing and gaining approval for new veterinary pharmaceuticals can be a lengthy and costly process.
- Availability of Counterfeit Products: The presence of fake or substandard pain relief products can undermine trust and impact patient safety.
- Veterinary Professional Shortages: A lack of specialized veterinary professionals skilled in pain management can hinder effective treatment delivery in some regions.
Emerging Opportunities in Veterinary Pain Management Market
Emerging opportunities lie in the development of novel regenerative medicine approaches for chronic pain, such as stem cell therapy and platelet-rich plasma (PRP) injections, offering potential for long-term pain reduction and tissue repair. The expansion of tele-veterinary services presents an opportunity to provide remote pain assessment and management guidance, particularly in underserved areas. Furthermore, the growing demand for natural and holistic pain management options, including nutraceuticals and acupuncture, creates a niche market for alternative therapies. The increasing focus on pain management in exotic and small mammals also represents an untapped market segment with specialized product development potential.
Growth Accelerators in the Veterinary Pain Management Market Industry
Growth in the Veterinary Pain Management Market is being significantly accelerated by breakthroughs in pharmacogenomics to develop personalized pain relief strategies tailored to individual animal genetics, thereby optimizing efficacy and minimizing adverse reactions. Strategic partnerships between pharmaceutical companies and technology providers are fostering the development of smart devices that enable continuous pain monitoring and data-driven treatment adjustments. Market expansion strategies are also focusing on increasing accessibility to advanced pain management solutions in emerging economies through education initiatives and more affordable product offerings.
Key Players Shaping the Veterinary Pain Management Market Market
- Assisi Animal Health
- Boehringer Ingelheim International GmbH
- Merck and Co Inc
- Dechra Pharmaceuticals PLC
- Chanelle Veterinary Limited
- Vetoquinol SA
- Norbrook
- Eltech K-Laser SRL
- Ceva Sante Animale
- Elanco Animal Health Incorporated
- Zoetis Inc
Notable Milestones in Veterinary Pain Management Market Sector
- September 2022: Zoetis launched Solensia to manage feline osteoarthritis pain in the United States, marking a significant advancement in targeted pain relief for cats.
- April 2022: FDA-approved medetomidine and vatinoxan hydrochlorides injection for use as a sedative and analgesic in dogs while undergoing certain clinical examinations and procedures and minor surgical procedures, enhancing procedural safety and animal comfort.
In-Depth Veterinary Pain Management Market Market Outlook
The future outlook for the Veterinary Pain Management Market is exceptionally positive, driven by an unprecedented convergence of factors. The increasing emphasis on companion animal well-being and the growing economic capacity of pet owners to invest in comprehensive healthcare will continue to fuel demand for advanced pain relief solutions. Technological innovations, including the exploration of novel drug delivery systems and the integration of artificial intelligence in pain assessment, will unlock new therapeutic possibilities. Strategic collaborations between industry leaders and academic research institutions are expected to accelerate the translation of scientific discoveries into practical, market-ready products. The market is anticipated to witness substantial growth in personalized pain management, contributing to improved quality of life for millions of animals worldwide.
Veterinary Pain Management Market Segmentation
-
1. Product
-
1.1. Drugs
- 1.1.1. NSAIDs
- 1.1.2. Anesthetics
- 1.1.3. Opioids
- 1.1.4. Other Drugs
-
1.2. Devices
- 1.2.1. Laser Therapy
- 1.2.2. Electromagnetic Therapy
-
1.1. Drugs
-
2. Application
- 2.1. Osteoarthritis and Joint Pain
- 2.2. Postoperative Pain
- 2.3. Cancer
- 2.4. Other Applications
-
3. Animal Type
- 3.1. Companion
- 3.2. Livestock
-
4. End User
- 4.1. Hospitals and Clinics
- 4.2. Retail Outlet and Others
Veterinary Pain Management Market Segmentation By Geography
-
1. North America
- 1.1. United States
- 1.2. Canada
- 1.3. Mexico
-
2. Europe
- 2.1. Germany
- 2.2. United Kingdom
- 2.3. France
- 2.4. Italy
- 2.5. Spain
- 2.6. Rest of Europe
-
3. Asia Pacific
- 3.1. China
- 3.2. Japan
- 3.3. India
- 3.4. Australia
- 3.5. South Korea
- 3.6. Rest of Asia Pacific
-
4. Middle East and Africa
- 4.1. GCC
- 4.2. South Africa
- 4.3. Rest of Middle East and Africa
-
5. South America
- 5.1. Brazil
- 5.2. Argentina
- 5.3. Rest of South America
Veterinary Pain Management Market Regional Market Share
Geographic Coverage of Veterinary Pain Management Market
Veterinary Pain Management Market REPORT HIGHLIGHTS
| Aspects | Details |
|---|---|
| Study Period | 2020-2034 |
| Base Year | 2025 |
| Estimated Year | 2026 |
| Forecast Period | 2026-2034 |
| Historical Period | 2020-2025 |
| Growth Rate | CAGR of 5.91% from 2020-2034 |
| Segmentation |
|
Table of Contents
- 1. Introduction
- 1.1. Research Scope
- 1.2. Market Segmentation
- 1.3. Research Objective
- 1.4. Definitions and Assumptions
- 2. Executive Summary
- 2.1. Market Snapshot
- 3. Market Dynamics
- 3.1. Market Drivers
- 3.2. Market Restrains
- 3.3. Market Trends
- 3.4. Market Opportunities
- 4. Market Factor Analysis
- 4.1. Porters Five Forces
- 4.1.1. Bargaining Power of Suppliers
- 4.1.2. Bargaining Power of Buyers
- 4.1.3. Threat of New Entrants
- 4.1.4. Threat of Substitutes
- 4.1.5. Competitive Rivalry
- 4.2. PESTEL analysis
- 4.3. BCG Analysis
- 4.3.1. Stars (High Growth, High Market Share)
- 4.3.2. Cash Cows (Low Growth, High Market Share)
- 4.3.3. Question Mark (High Growth, Low Market Share)
- 4.3.4. Dogs (Low Growth, Low Market Share)
- 4.4. Ansoff Matrix Analysis
- 4.5. Supply Chain Analysis
- 4.6. Regulatory Landscape
- 4.7. Current Market Potential and Opportunity Assessment (TAM–SAM–SOM Framework)
- 4.8. VDR Analyst Note
- 4.1. Porters Five Forces
- 5. Market Analysis, Insights and Forecast 2021-2033
- 5.1. Market Analysis, Insights and Forecast - by Product
- 5.1.1. Drugs
- 5.1.1.1. NSAIDs
- 5.1.1.2. Anesthetics
- 5.1.1.3. Opioids
- 5.1.1.4. Other Drugs
- 5.1.2. Devices
- 5.1.2.1. Laser Therapy
- 5.1.2.2. Electromagnetic Therapy
- 5.1.1. Drugs
- 5.2. Market Analysis, Insights and Forecast - by Application
- 5.2.1. Osteoarthritis and Joint Pain
- 5.2.2. Postoperative Pain
- 5.2.3. Cancer
- 5.2.4. Other Applications
- 5.3. Market Analysis, Insights and Forecast - by Animal Type
- 5.3.1. Companion
- 5.3.2. Livestock
- 5.4. Market Analysis, Insights and Forecast - by End User
- 5.4.1. Hospitals and Clinics
- 5.4.2. Retail Outlet and Others
- 5.5. Market Analysis, Insights and Forecast - by Region
- 5.5.1. North America
- 5.5.2. Europe
- 5.5.3. Asia Pacific
- 5.5.4. Middle East and Africa
- 5.5.5. South America
- 5.1. Market Analysis, Insights and Forecast - by Product
- 6. Global Veterinary Pain Management Market Analysis, Insights and Forecast, 2021-2033
- 6.1. Market Analysis, Insights and Forecast - by Product
- 6.1.1. Drugs
- 6.1.1.1. NSAIDs
- 6.1.1.2. Anesthetics
- 6.1.1.3. Opioids
- 6.1.1.4. Other Drugs
- 6.1.2. Devices
- 6.1.2.1. Laser Therapy
- 6.1.2.2. Electromagnetic Therapy
- 6.1.1. Drugs
- 6.2. Market Analysis, Insights and Forecast - by Application
- 6.2.1. Osteoarthritis and Joint Pain
- 6.2.2. Postoperative Pain
- 6.2.3. Cancer
- 6.2.4. Other Applications
- 6.3. Market Analysis, Insights and Forecast - by Animal Type
- 6.3.1. Companion
- 6.3.2. Livestock
- 6.4. Market Analysis, Insights and Forecast - by End User
- 6.4.1. Hospitals and Clinics
- 6.4.2. Retail Outlet and Others
- 6.1. Market Analysis, Insights and Forecast - by Product
- 7. North America Veterinary Pain Management Market Analysis, Insights and Forecast, 2021-2033
- 7.1. Market Analysis, Insights and Forecast - by Product
- 7.1.1. Drugs
- 7.1.1.1. NSAIDs
- 7.1.1.2. Anesthetics
- 7.1.1.3. Opioids
- 7.1.1.4. Other Drugs
- 7.1.2. Devices
- 7.1.2.1. Laser Therapy
- 7.1.2.2. Electromagnetic Therapy
- 7.1.1. Drugs
- 7.2. Market Analysis, Insights and Forecast - by Application
- 7.2.1. Osteoarthritis and Joint Pain
- 7.2.2. Postoperative Pain
- 7.2.3. Cancer
- 7.2.4. Other Applications
- 7.3. Market Analysis, Insights and Forecast - by Animal Type
- 7.3.1. Companion
- 7.3.2. Livestock
- 7.4. Market Analysis, Insights and Forecast - by End User
- 7.4.1. Hospitals and Clinics
- 7.4.2. Retail Outlet and Others
- 7.1. Market Analysis, Insights and Forecast - by Product
- 8. Europe Veterinary Pain Management Market Analysis, Insights and Forecast, 2021-2033
- 8.1. Market Analysis, Insights and Forecast - by Product
- 8.1.1. Drugs
- 8.1.1.1. NSAIDs
- 8.1.1.2. Anesthetics
- 8.1.1.3. Opioids
- 8.1.1.4. Other Drugs
- 8.1.2. Devices
- 8.1.2.1. Laser Therapy
- 8.1.2.2. Electromagnetic Therapy
- 8.1.1. Drugs
- 8.2. Market Analysis, Insights and Forecast - by Application
- 8.2.1. Osteoarthritis and Joint Pain
- 8.2.2. Postoperative Pain
- 8.2.3. Cancer
- 8.2.4. Other Applications
- 8.3. Market Analysis, Insights and Forecast - by Animal Type
- 8.3.1. Companion
- 8.3.2. Livestock
- 8.4. Market Analysis, Insights and Forecast - by End User
- 8.4.1. Hospitals and Clinics
- 8.4.2. Retail Outlet and Others
- 8.1. Market Analysis, Insights and Forecast - by Product
- 9. Asia Pacific Veterinary Pain Management Market Analysis, Insights and Forecast, 2021-2033
- 9.1. Market Analysis, Insights and Forecast - by Product
- 9.1.1. Drugs
- 9.1.1.1. NSAIDs
- 9.1.1.2. Anesthetics
- 9.1.1.3. Opioids
- 9.1.1.4. Other Drugs
- 9.1.2. Devices
- 9.1.2.1. Laser Therapy
- 9.1.2.2. Electromagnetic Therapy
- 9.1.1. Drugs
- 9.2. Market Analysis, Insights and Forecast - by Application
- 9.2.1. Osteoarthritis and Joint Pain
- 9.2.2. Postoperative Pain
- 9.2.3. Cancer
- 9.2.4. Other Applications
- 9.3. Market Analysis, Insights and Forecast - by Animal Type
- 9.3.1. Companion
- 9.3.2. Livestock
- 9.4. Market Analysis, Insights and Forecast - by End User
- 9.4.1. Hospitals and Clinics
- 9.4.2. Retail Outlet and Others
- 9.1. Market Analysis, Insights and Forecast - by Product
- 10. Middle East and Africa Veterinary Pain Management Market Analysis, Insights and Forecast, 2021-2033
- 10.1. Market Analysis, Insights and Forecast - by Product
- 10.1.1. Drugs
- 10.1.1.1. NSAIDs
- 10.1.1.2. Anesthetics
- 10.1.1.3. Opioids
- 10.1.1.4. Other Drugs
- 10.1.2. Devices
- 10.1.2.1. Laser Therapy
- 10.1.2.2. Electromagnetic Therapy
- 10.1.1. Drugs
- 10.2. Market Analysis, Insights and Forecast - by Application
- 10.2.1. Osteoarthritis and Joint Pain
- 10.2.2. Postoperative Pain
- 10.2.3. Cancer
- 10.2.4. Other Applications
- 10.3. Market Analysis, Insights and Forecast - by Animal Type
- 10.3.1. Companion
- 10.3.2. Livestock
- 10.4. Market Analysis, Insights and Forecast - by End User
- 10.4.1. Hospitals and Clinics
- 10.4.2. Retail Outlet and Others
- 10.1. Market Analysis, Insights and Forecast - by Product
- 11. South America Veterinary Pain Management Market Analysis, Insights and Forecast, 2021-2033
- 11.1. Market Analysis, Insights and Forecast - by Product
- 11.1.1. Drugs
- 11.1.1.1. NSAIDs
- 11.1.1.2. Anesthetics
- 11.1.1.3. Opioids
- 11.1.1.4. Other Drugs
- 11.1.2. Devices
- 11.1.2.1. Laser Therapy
- 11.1.2.2. Electromagnetic Therapy
- 11.1.1. Drugs
- 11.2. Market Analysis, Insights and Forecast - by Application
- 11.2.1. Osteoarthritis and Joint Pain
- 11.2.2. Postoperative Pain
- 11.2.3. Cancer
- 11.2.4. Other Applications
- 11.3. Market Analysis, Insights and Forecast - by Animal Type
- 11.3.1. Companion
- 11.3.2. Livestock
- 11.4. Market Analysis, Insights and Forecast - by End User
- 11.4.1. Hospitals and Clinics
- 11.4.2. Retail Outlet and Others
- 11.1. Market Analysis, Insights and Forecast - by Product
- 12. Competitive Analysis
- 12.1. Company Profiles
- 12.1.1 Assisi Animal Health
- 12.1.1.1. Company Overview
- 12.1.1.2. Products
- 12.1.1.3. Company Financials
- 12.1.1.4. SWOT Analysis
- 12.1.2 Boehringer Ingelheim International GmbH
- 12.1.2.1. Company Overview
- 12.1.2.2. Products
- 12.1.2.3. Company Financials
- 12.1.2.4. SWOT Analysis
- 12.1.3 Merck and Co Inc
- 12.1.3.1. Company Overview
- 12.1.3.2. Products
- 12.1.3.3. Company Financials
- 12.1.3.4. SWOT Analysis
- 12.1.4 Dechra Pharmaceuticals PLC
- 12.1.4.1. Company Overview
- 12.1.4.2. Products
- 12.1.4.3. Company Financials
- 12.1.4.4. SWOT Analysis
- 12.1.5 Chanelle Veterinary Limited
- 12.1.5.1. Company Overview
- 12.1.5.2. Products
- 12.1.5.3. Company Financials
- 12.1.5.4. SWOT Analysis
- 12.1.6 VetoquinolSA
- 12.1.6.1. Company Overview
- 12.1.6.2. Products
- 12.1.6.3. Company Financials
- 12.1.6.4. SWOT Analysis
- 12.1.7 Norbrook
- 12.1.7.1. Company Overview
- 12.1.7.2. Products
- 12.1.7.3. Company Financials
- 12.1.7.4. SWOT Analysis
- 12.1.8 Eltech K-Laser SRL
- 12.1.8.1. Company Overview
- 12.1.8.2. Products
- 12.1.8.3. Company Financials
- 12.1.8.4. SWOT Analysis
- 12.1.9 Ceva Sante Animale
- 12.1.9.1. Company Overview
- 12.1.9.2. Products
- 12.1.9.3. Company Financials
- 12.1.9.4. SWOT Analysis
- 12.1.10 Elanco Animal Health Incorporated
- 12.1.10.1. Company Overview
- 12.1.10.2. Products
- 12.1.10.3. Company Financials
- 12.1.10.4. SWOT Analysis
- 12.1.11 Zoetis Inc
- 12.1.11.1. Company Overview
- 12.1.11.2. Products
- 12.1.11.3. Company Financials
- 12.1.11.4. SWOT Analysis
- 12.1.1 Assisi Animal Health
- 12.2. Market Entropy
- 12.2.1 Company's Key Areas Served
- 12.2.2 Recent Developments
- 12.3. Company Market Share Analysis 2025
- 12.3.1 Top 5 Companies Market Share Analysis
- 12.3.2 Top 3 Companies Market Share Analysis
- 12.4. List of Potential Customers
- 13. Research Methodology
List of Figures
- Figure 1: Global Veterinary Pain Management Market Revenue Breakdown (Million, %) by Region 2025 & 2033
- Figure 2: Global Veterinary Pain Management Market Volume Breakdown (K Unit, %) by Region 2025 & 2033
- Figure 3: North America Veterinary Pain Management Market Revenue (Million), by Product 2025 & 2033
- Figure 4: North America Veterinary Pain Management Market Volume (K Unit), by Product 2025 & 2033
- Figure 5: North America Veterinary Pain Management Market Revenue Share (%), by Product 2025 & 2033
- Figure 6: North America Veterinary Pain Management Market Volume Share (%), by Product 2025 & 2033
- Figure 7: North America Veterinary Pain Management Market Revenue (Million), by Application 2025 & 2033
- Figure 8: North America Veterinary Pain Management Market Volume (K Unit), by Application 2025 & 2033
- Figure 9: North America Veterinary Pain Management Market Revenue Share (%), by Application 2025 & 2033
- Figure 10: North America Veterinary Pain Management Market Volume Share (%), by Application 2025 & 2033
- Figure 11: North America Veterinary Pain Management Market Revenue (Million), by Animal Type 2025 & 2033
- Figure 12: North America Veterinary Pain Management Market Volume (K Unit), by Animal Type 2025 & 2033
- Figure 13: North America Veterinary Pain Management Market Revenue Share (%), by Animal Type 2025 & 2033
- Figure 14: North America Veterinary Pain Management Market Volume Share (%), by Animal Type 2025 & 2033
- Figure 15: North America Veterinary Pain Management Market Revenue (Million), by End User 2025 & 2033
- Figure 16: North America Veterinary Pain Management Market Volume (K Unit), by End User 2025 & 2033
- Figure 17: North America Veterinary Pain Management Market Revenue Share (%), by End User 2025 & 2033
- Figure 18: North America Veterinary Pain Management Market Volume Share (%), by End User 2025 & 2033
- Figure 19: North America Veterinary Pain Management Market Revenue (Million), by Country 2025 & 2033
- Figure 20: North America Veterinary Pain Management Market Volume (K Unit), by Country 2025 & 2033
- Figure 21: North America Veterinary Pain Management Market Revenue Share (%), by Country 2025 & 2033
- Figure 22: North America Veterinary Pain Management Market Volume Share (%), by Country 2025 & 2033
- Figure 23: Europe Veterinary Pain Management Market Revenue (Million), by Product 2025 & 2033
- Figure 24: Europe Veterinary Pain Management Market Volume (K Unit), by Product 2025 & 2033
- Figure 25: Europe Veterinary Pain Management Market Revenue Share (%), by Product 2025 & 2033
- Figure 26: Europe Veterinary Pain Management Market Volume Share (%), by Product 2025 & 2033
- Figure 27: Europe Veterinary Pain Management Market Revenue (Million), by Application 2025 & 2033
- Figure 28: Europe Veterinary Pain Management Market Volume (K Unit), by Application 2025 & 2033
- Figure 29: Europe Veterinary Pain Management Market Revenue Share (%), by Application 2025 & 2033
- Figure 30: Europe Veterinary Pain Management Market Volume Share (%), by Application 2025 & 2033
- Figure 31: Europe Veterinary Pain Management Market Revenue (Million), by Animal Type 2025 & 2033
- Figure 32: Europe Veterinary Pain Management Market Volume (K Unit), by Animal Type 2025 & 2033
- Figure 33: Europe Veterinary Pain Management Market Revenue Share (%), by Animal Type 2025 & 2033
- Figure 34: Europe Veterinary Pain Management Market Volume Share (%), by Animal Type 2025 & 2033
- Figure 35: Europe Veterinary Pain Management Market Revenue (Million), by End User 2025 & 2033
- Figure 36: Europe Veterinary Pain Management Market Volume (K Unit), by End User 2025 & 2033
- Figure 37: Europe Veterinary Pain Management Market Revenue Share (%), by End User 2025 & 2033
- Figure 38: Europe Veterinary Pain Management Market Volume Share (%), by End User 2025 & 2033
- Figure 39: Europe Veterinary Pain Management Market Revenue (Million), by Country 2025 & 2033
- Figure 40: Europe Veterinary Pain Management Market Volume (K Unit), by Country 2025 & 2033
- Figure 41: Europe Veterinary Pain Management Market Revenue Share (%), by Country 2025 & 2033
- Figure 42: Europe Veterinary Pain Management Market Volume Share (%), by Country 2025 & 2033
- Figure 43: Asia Pacific Veterinary Pain Management Market Revenue (Million), by Product 2025 & 2033
- Figure 44: Asia Pacific Veterinary Pain Management Market Volume (K Unit), by Product 2025 & 2033
- Figure 45: Asia Pacific Veterinary Pain Management Market Revenue Share (%), by Product 2025 & 2033
- Figure 46: Asia Pacific Veterinary Pain Management Market Volume Share (%), by Product 2025 & 2033
- Figure 47: Asia Pacific Veterinary Pain Management Market Revenue (Million), by Application 2025 & 2033
- Figure 48: Asia Pacific Veterinary Pain Management Market Volume (K Unit), by Application 2025 & 2033
- Figure 49: Asia Pacific Veterinary Pain Management Market Revenue Share (%), by Application 2025 & 2033
- Figure 50: Asia Pacific Veterinary Pain Management Market Volume Share (%), by Application 2025 & 2033
- Figure 51: Asia Pacific Veterinary Pain Management Market Revenue (Million), by Animal Type 2025 & 2033
- Figure 52: Asia Pacific Veterinary Pain Management Market Volume (K Unit), by Animal Type 2025 & 2033
- Figure 53: Asia Pacific Veterinary Pain Management Market Revenue Share (%), by Animal Type 2025 & 2033
- Figure 54: Asia Pacific Veterinary Pain Management Market Volume Share (%), by Animal Type 2025 & 2033
- Figure 55: Asia Pacific Veterinary Pain Management Market Revenue (Million), by End User 2025 & 2033
- Figure 56: Asia Pacific Veterinary Pain Management Market Volume (K Unit), by End User 2025 & 2033
- Figure 57: Asia Pacific Veterinary Pain Management Market Revenue Share (%), by End User 2025 & 2033
- Figure 58: Asia Pacific Veterinary Pain Management Market Volume Share (%), by End User 2025 & 2033
- Figure 59: Asia Pacific Veterinary Pain Management Market Revenue (Million), by Country 2025 & 2033
- Figure 60: Asia Pacific Veterinary Pain Management Market Volume (K Unit), by Country 2025 & 2033
- Figure 61: Asia Pacific Veterinary Pain Management Market Revenue Share (%), by Country 2025 & 2033
- Figure 62: Asia Pacific Veterinary Pain Management Market Volume Share (%), by Country 2025 & 2033
- Figure 63: Middle East and Africa Veterinary Pain Management Market Revenue (Million), by Product 2025 & 2033
- Figure 64: Middle East and Africa Veterinary Pain Management Market Volume (K Unit), by Product 2025 & 2033
- Figure 65: Middle East and Africa Veterinary Pain Management Market Revenue Share (%), by Product 2025 & 2033
- Figure 66: Middle East and Africa Veterinary Pain Management Market Volume Share (%), by Product 2025 & 2033
- Figure 67: Middle East and Africa Veterinary Pain Management Market Revenue (Million), by Application 2025 & 2033
- Figure 68: Middle East and Africa Veterinary Pain Management Market Volume (K Unit), by Application 2025 & 2033
- Figure 69: Middle East and Africa Veterinary Pain Management Market Revenue Share (%), by Application 2025 & 2033
- Figure 70: Middle East and Africa Veterinary Pain Management Market Volume Share (%), by Application 2025 & 2033
- Figure 71: Middle East and Africa Veterinary Pain Management Market Revenue (Million), by Animal Type 2025 & 2033
- Figure 72: Middle East and Africa Veterinary Pain Management Market Volume (K Unit), by Animal Type 2025 & 2033
- Figure 73: Middle East and Africa Veterinary Pain Management Market Revenue Share (%), by Animal Type 2025 & 2033
- Figure 74: Middle East and Africa Veterinary Pain Management Market Volume Share (%), by Animal Type 2025 & 2033
- Figure 75: Middle East and Africa Veterinary Pain Management Market Revenue (Million), by End User 2025 & 2033
- Figure 76: Middle East and Africa Veterinary Pain Management Market Volume (K Unit), by End User 2025 & 2033
- Figure 77: Middle East and Africa Veterinary Pain Management Market Revenue Share (%), by End User 2025 & 2033
- Figure 78: Middle East and Africa Veterinary Pain Management Market Volume Share (%), by End User 2025 & 2033
- Figure 79: Middle East and Africa Veterinary Pain Management Market Revenue (Million), by Country 2025 & 2033
- Figure 80: Middle East and Africa Veterinary Pain Management Market Volume (K Unit), by Country 2025 & 2033
- Figure 81: Middle East and Africa Veterinary Pain Management Market Revenue Share (%), by Country 2025 & 2033
- Figure 82: Middle East and Africa Veterinary Pain Management Market Volume Share (%), by Country 2025 & 2033
- Figure 83: South America Veterinary Pain Management Market Revenue (Million), by Product 2025 & 2033
- Figure 84: South America Veterinary Pain Management Market Volume (K Unit), by Product 2025 & 2033
- Figure 85: South America Veterinary Pain Management Market Revenue Share (%), by Product 2025 & 2033
- Figure 86: South America Veterinary Pain Management Market Volume Share (%), by Product 2025 & 2033
- Figure 87: South America Veterinary Pain Management Market Revenue (Million), by Application 2025 & 2033
- Figure 88: South America Veterinary Pain Management Market Volume (K Unit), by Application 2025 & 2033
- Figure 89: South America Veterinary Pain Management Market Revenue Share (%), by Application 2025 & 2033
- Figure 90: South America Veterinary Pain Management Market Volume Share (%), by Application 2025 & 2033
- Figure 91: South America Veterinary Pain Management Market Revenue (Million), by Animal Type 2025 & 2033
- Figure 92: South America Veterinary Pain Management Market Volume (K Unit), by Animal Type 2025 & 2033
- Figure 93: South America Veterinary Pain Management Market Revenue Share (%), by Animal Type 2025 & 2033
- Figure 94: South America Veterinary Pain Management Market Volume Share (%), by Animal Type 2025 & 2033
- Figure 95: South America Veterinary Pain Management Market Revenue (Million), by End User 2025 & 2033
- Figure 96: South America Veterinary Pain Management Market Volume (K Unit), by End User 2025 & 2033
- Figure 97: South America Veterinary Pain Management Market Revenue Share (%), by End User 2025 & 2033
- Figure 98: South America Veterinary Pain Management Market Volume Share (%), by End User 2025 & 2033
- Figure 99: South America Veterinary Pain Management Market Revenue (Million), by Country 2025 & 2033
- Figure 100: South America Veterinary Pain Management Market Volume (K Unit), by Country 2025 & 2033
- Figure 101: South America Veterinary Pain Management Market Revenue Share (%), by Country 2025 & 2033
- Figure 102: South America Veterinary Pain Management Market Volume Share (%), by Country 2025 & 2033
List of Tables
- Table 1: Global Veterinary Pain Management Market Revenue Million Forecast, by Product 2020 & 2033
- Table 2: Global Veterinary Pain Management Market Volume K Unit Forecast, by Product 2020 & 2033
- Table 3: Global Veterinary Pain Management Market Revenue Million Forecast, by Application 2020 & 2033
- Table 4: Global Veterinary Pain Management Market Volume K Unit Forecast, by Application 2020 & 2033
- Table 5: Global Veterinary Pain Management Market Revenue Million Forecast, by Animal Type 2020 & 2033
- Table 6: Global Veterinary Pain Management Market Volume K Unit Forecast, by Animal Type 2020 & 2033
- Table 7: Global Veterinary Pain Management Market Revenue Million Forecast, by End User 2020 & 2033
- Table 8: Global Veterinary Pain Management Market Volume K Unit Forecast, by End User 2020 & 2033
- Table 9: Global Veterinary Pain Management Market Revenue Million Forecast, by Region 2020 & 2033
- Table 10: Global Veterinary Pain Management Market Volume K Unit Forecast, by Region 2020 & 2033
- Table 11: Global Veterinary Pain Management Market Revenue Million Forecast, by Product 2020 & 2033
- Table 12: Global Veterinary Pain Management Market Volume K Unit Forecast, by Product 2020 & 2033
- Table 13: Global Veterinary Pain Management Market Revenue Million Forecast, by Application 2020 & 2033
- Table 14: Global Veterinary Pain Management Market Volume K Unit Forecast, by Application 2020 & 2033
- Table 15: Global Veterinary Pain Management Market Revenue Million Forecast, by Animal Type 2020 & 2033
- Table 16: Global Veterinary Pain Management Market Volume K Unit Forecast, by Animal Type 2020 & 2033
- Table 17: Global Veterinary Pain Management Market Revenue Million Forecast, by End User 2020 & 2033
- Table 18: Global Veterinary Pain Management Market Volume K Unit Forecast, by End User 2020 & 2033
- Table 19: Global Veterinary Pain Management Market Revenue Million Forecast, by Country 2020 & 2033
- Table 20: Global Veterinary Pain Management Market Volume K Unit Forecast, by Country 2020 & 2033
- Table 21: United States Veterinary Pain Management Market Revenue (Million) Forecast, by Application 2020 & 2033
- Table 22: United States Veterinary Pain Management Market Volume (K Unit) Forecast, by Application 2020 & 2033
- Table 23: Canada Veterinary Pain Management Market Revenue (Million) Forecast, by Application 2020 & 2033
- Table 24: Canada Veterinary Pain Management Market Volume (K Unit) Forecast, by Application 2020 & 2033
- Table 25: Mexico Veterinary Pain Management Market Revenue (Million) Forecast, by Application 2020 & 2033
- Table 26: Mexico Veterinary Pain Management Market Volume (K Unit) Forecast, by Application 2020 & 2033
- Table 27: Global Veterinary Pain Management Market Revenue Million Forecast, by Product 2020 & 2033
- Table 28: Global Veterinary Pain Management Market Volume K Unit Forecast, by Product 2020 & 2033
- Table 29: Global Veterinary Pain Management Market Revenue Million Forecast, by Application 2020 & 2033
- Table 30: Global Veterinary Pain Management Market Volume K Unit Forecast, by Application 2020 & 2033
- Table 31: Global Veterinary Pain Management Market Revenue Million Forecast, by Animal Type 2020 & 2033
- Table 32: Global Veterinary Pain Management Market Volume K Unit Forecast, by Animal Type 2020 & 2033
- Table 33: Global Veterinary Pain Management Market Revenue Million Forecast, by End User 2020 & 2033
- Table 34: Global Veterinary Pain Management Market Volume K Unit Forecast, by End User 2020 & 2033
- Table 35: Global Veterinary Pain Management Market Revenue Million Forecast, by Country 2020 & 2033
- Table 36: Global Veterinary Pain Management Market Volume K Unit Forecast, by Country 2020 & 2033
- Table 37: Germany Veterinary Pain Management Market Revenue (Million) Forecast, by Application 2020 & 2033
- Table 38: Germany Veterinary Pain Management Market Volume (K Unit) Forecast, by Application 2020 & 2033
- Table 39: United Kingdom Veterinary Pain Management Market Revenue (Million) Forecast, by Application 2020 & 2033
- Table 40: United Kingdom Veterinary Pain Management Market Volume (K Unit) Forecast, by Application 2020 & 2033
- Table 41: France Veterinary Pain Management Market Revenue (Million) Forecast, by Application 2020 & 2033
- Table 42: France Veterinary Pain Management Market Volume (K Unit) Forecast, by Application 2020 & 2033
- Table 43: Italy Veterinary Pain Management Market Revenue (Million) Forecast, by Application 2020 & 2033
- Table 44: Italy Veterinary Pain Management Market Volume (K Unit) Forecast, by Application 2020 & 2033
- Table 45: Spain Veterinary Pain Management Market Revenue (Million) Forecast, by Application 2020 & 2033
- Table 46: Spain Veterinary Pain Management Market Volume (K Unit) Forecast, by Application 2020 & 2033
- Table 47: Rest of Europe Veterinary Pain Management Market Revenue (Million) Forecast, by Application 2020 & 2033
- Table 48: Rest of Europe Veterinary Pain Management Market Volume (K Unit) Forecast, by Application 2020 & 2033
- Table 49: Global Veterinary Pain Management Market Revenue Million Forecast, by Product 2020 & 2033
- Table 50: Global Veterinary Pain Management Market Volume K Unit Forecast, by Product 2020 & 2033
- Table 51: Global Veterinary Pain Management Market Revenue Million Forecast, by Application 2020 & 2033
- Table 52: Global Veterinary Pain Management Market Volume K Unit Forecast, by Application 2020 & 2033
- Table 53: Global Veterinary Pain Management Market Revenue Million Forecast, by Animal Type 2020 & 2033
- Table 54: Global Veterinary Pain Management Market Volume K Unit Forecast, by Animal Type 2020 & 2033
- Table 55: Global Veterinary Pain Management Market Revenue Million Forecast, by End User 2020 & 2033
- Table 56: Global Veterinary Pain Management Market Volume K Unit Forecast, by End User 2020 & 2033
- Table 57: Global Veterinary Pain Management Market Revenue Million Forecast, by Country 2020 & 2033
- Table 58: Global Veterinary Pain Management Market Volume K Unit Forecast, by Country 2020 & 2033
- Table 59: China Veterinary Pain Management Market Revenue (Million) Forecast, by Application 2020 & 2033
- Table 60: China Veterinary Pain Management Market Volume (K Unit) Forecast, by Application 2020 & 2033
- Table 61: Japan Veterinary Pain Management Market Revenue (Million) Forecast, by Application 2020 & 2033
- Table 62: Japan Veterinary Pain Management Market Volume (K Unit) Forecast, by Application 2020 & 2033
- Table 63: India Veterinary Pain Management Market Revenue (Million) Forecast, by Application 2020 & 2033
- Table 64: India Veterinary Pain Management Market Volume (K Unit) Forecast, by Application 2020 & 2033
- Table 65: Australia Veterinary Pain Management Market Revenue (Million) Forecast, by Application 2020 & 2033
- Table 66: Australia Veterinary Pain Management Market Volume (K Unit) Forecast, by Application 2020 & 2033
- Table 67: South Korea Veterinary Pain Management Market Revenue (Million) Forecast, by Application 2020 & 2033
- Table 68: South Korea Veterinary Pain Management Market Volume (K Unit) Forecast, by Application 2020 & 2033
- Table 69: Rest of Asia Pacific Veterinary Pain Management Market Revenue (Million) Forecast, by Application 2020 & 2033
- Table 70: Rest of Asia Pacific Veterinary Pain Management Market Volume (K Unit) Forecast, by Application 2020 & 2033
- Table 71: Global Veterinary Pain Management Market Revenue Million Forecast, by Product 2020 & 2033
- Table 72: Global Veterinary Pain Management Market Volume K Unit Forecast, by Product 2020 & 2033
- Table 73: Global Veterinary Pain Management Market Revenue Million Forecast, by Application 2020 & 2033
- Table 74: Global Veterinary Pain Management Market Volume K Unit Forecast, by Application 2020 & 2033
- Table 75: Global Veterinary Pain Management Market Revenue Million Forecast, by Animal Type 2020 & 2033
- Table 76: Global Veterinary Pain Management Market Volume K Unit Forecast, by Animal Type 2020 & 2033
- Table 77: Global Veterinary Pain Management Market Revenue Million Forecast, by End User 2020 & 2033
- Table 78: Global Veterinary Pain Management Market Volume K Unit Forecast, by End User 2020 & 2033
- Table 79: Global Veterinary Pain Management Market Revenue Million Forecast, by Country 2020 & 2033
- Table 80: Global Veterinary Pain Management Market Volume K Unit Forecast, by Country 2020 & 2033
- Table 81: GCC Veterinary Pain Management Market Revenue (Million) Forecast, by Application 2020 & 2033
- Table 82: GCC Veterinary Pain Management Market Volume (K Unit) Forecast, by Application 2020 & 2033
- Table 83: South Africa Veterinary Pain Management Market Revenue (Million) Forecast, by Application 2020 & 2033
- Table 84: South Africa Veterinary Pain Management Market Volume (K Unit) Forecast, by Application 2020 & 2033
- Table 85: Rest of Middle East and Africa Veterinary Pain Management Market Revenue (Million) Forecast, by Application 2020 & 2033
- Table 86: Rest of Middle East and Africa Veterinary Pain Management Market Volume (K Unit) Forecast, by Application 2020 & 2033
- Table 87: Global Veterinary Pain Management Market Revenue Million Forecast, by Product 2020 & 2033
- Table 88: Global Veterinary Pain Management Market Volume K Unit Forecast, by Product 2020 & 2033
- Table 89: Global Veterinary Pain Management Market Revenue Million Forecast, by Application 2020 & 2033
- Table 90: Global Veterinary Pain Management Market Volume K Unit Forecast, by Application 2020 & 2033
- Table 91: Global Veterinary Pain Management Market Revenue Million Forecast, by Animal Type 2020 & 2033
- Table 92: Global Veterinary Pain Management Market Volume K Unit Forecast, by Animal Type 2020 & 2033
- Table 93: Global Veterinary Pain Management Market Revenue Million Forecast, by End User 2020 & 2033
- Table 94: Global Veterinary Pain Management Market Volume K Unit Forecast, by End User 2020 & 2033
- Table 95: Global Veterinary Pain Management Market Revenue Million Forecast, by Country 2020 & 2033
- Table 96: Global Veterinary Pain Management Market Volume K Unit Forecast, by Country 2020 & 2033
- Table 97: Brazil Veterinary Pain Management Market Revenue (Million) Forecast, by Application 2020 & 2033
- Table 98: Brazil Veterinary Pain Management Market Volume (K Unit) Forecast, by Application 2020 & 2033
- Table 99: Argentina Veterinary Pain Management Market Revenue (Million) Forecast, by Application 2020 & 2033
- Table 100: Argentina Veterinary Pain Management Market Volume (K Unit) Forecast, by Application 2020 & 2033
- Table 101: Rest of South America Veterinary Pain Management Market Revenue (Million) Forecast, by Application 2020 & 2033
- Table 102: Rest of South America Veterinary Pain Management Market Volume (K Unit) Forecast, by Application 2020 & 2033
Frequently Asked Questions
1. What is the projected Compound Annual Growth Rate (CAGR) of the Veterinary Pain Management Market?
The projected CAGR is approximately 5.91%.
2. Which companies are prominent players in the Veterinary Pain Management Market?
Key companies in the market include Assisi Animal Health, Boehringer Ingelheim International GmbH, Merck and Co Inc, Dechra Pharmaceuticals PLC, Chanelle Veterinary Limited, VetoquinolSA, Norbrook, Eltech K-Laser SRL, Ceva Sante Animale, Elanco Animal Health Incorporated, Zoetis Inc.
3. What are the main segments of the Veterinary Pain Management Market?
The market segments include Product, Application, Animal Type, End User.
4. Can you provide details about the market size?
The market size is estimated to be USD 1.65 Million as of 2022.
5. What are some drivers contributing to market growth?
Growth in Prevalence of Painful and Inflammatory Diseases in Animals; Rise in Need for Easily Accessible and Affordable Treatment Options; Increase in Awareness about Animal Health and Welfare.
6. What are the notable trends driving market growth?
Laser Therapy is Expected to Witness Considerable Growth Over the Forecast Period.
7. Are there any restraints impacting market growth?
Side Effects Associated With Treatment and High Cost of Certain Products.
8. Can you provide examples of recent developments in the market?
September 2022: Zoetis launched Solensia to manage feline osteoarthritis pain in the United States.
9. What pricing options are available for accessing the report?
Pricing options include single-user, multi-user, and enterprise licenses priced at USD 4750, USD 5250, and USD 8750 respectively.
10. Is the market size provided in terms of value or volume?
The market size is provided in terms of value, measured in Million and volume, measured in K Unit.
11. Are there any specific market keywords associated with the report?
Yes, the market keyword associated with the report is "Veterinary Pain Management Market," which aids in identifying and referencing the specific market segment covered.
12. How do I determine which pricing option suits my needs best?
The pricing options vary based on user requirements and access needs. Individual users may opt for single-user licenses, while businesses requiring broader access may choose multi-user or enterprise licenses for cost-effective access to the report.
13. Are there any additional resources or data provided in the Veterinary Pain Management Market report?
While the report offers comprehensive insights, it's advisable to review the specific contents or supplementary materials provided to ascertain if additional resources or data are available.
14. How can I stay updated on further developments or reports in the Veterinary Pain Management Market?
To stay informed about further developments, trends, and reports in the Veterinary Pain Management Market, consider subscribing to industry newsletters, following relevant companies and organizations, or regularly checking reputable industry news sources and publications.
Methodology
Step 1 - Identification of Relevant Samples Size from Population Database


Step 2 - Approaches for Defining Global Market Size (Value, Volume* & Price*)

Note*: In applicable scenarios
Step 3 - Data Sources
Primary Research
- Web Analytics
- Survey Reports
- Research Institute
- Latest Research Reports
- Opinion Leaders
Secondary Research
- Annual Reports
- White Paper
- Latest Press Release
- Industry Association
- Paid Database
- Investor Presentations

Step 4 - Data Triangulation
Involves using different sources of information in order to increase the validity of a study
These sources are likely to be stakeholders in a program - participants, other researchers, program staff, other community members, and so on.
Then we put all data in single framework & apply various statistical tools to find out the dynamic on the market.
During the analysis stage, feedback from the stakeholder groups would be compared to determine areas of agreement as well as areas of divergence