

Key Insights for Chromatography Data Systems Market
The Chromatography Data Systems Market stands as a pivotal component within the broader analytical instrumentation and laboratory informatics landscape, valued at an estimated USD 506.63 Million. This market is poised for robust expansion, projected to achieve a Compound Annual Growth Rate (CAGR) of 7.92% over the forecast period. The fundamental impetus for this growth is the escalating investment in research and development within the life sciences sector, coupled with an increasing global imperative for stringent food safety and quality assurance. Modern Chromatography Data Systems (CDS) are indispensable for managing the complex data generated by chromatographic techniques, ensuring data integrity, regulatory compliance, and streamlined laboratory workflows.
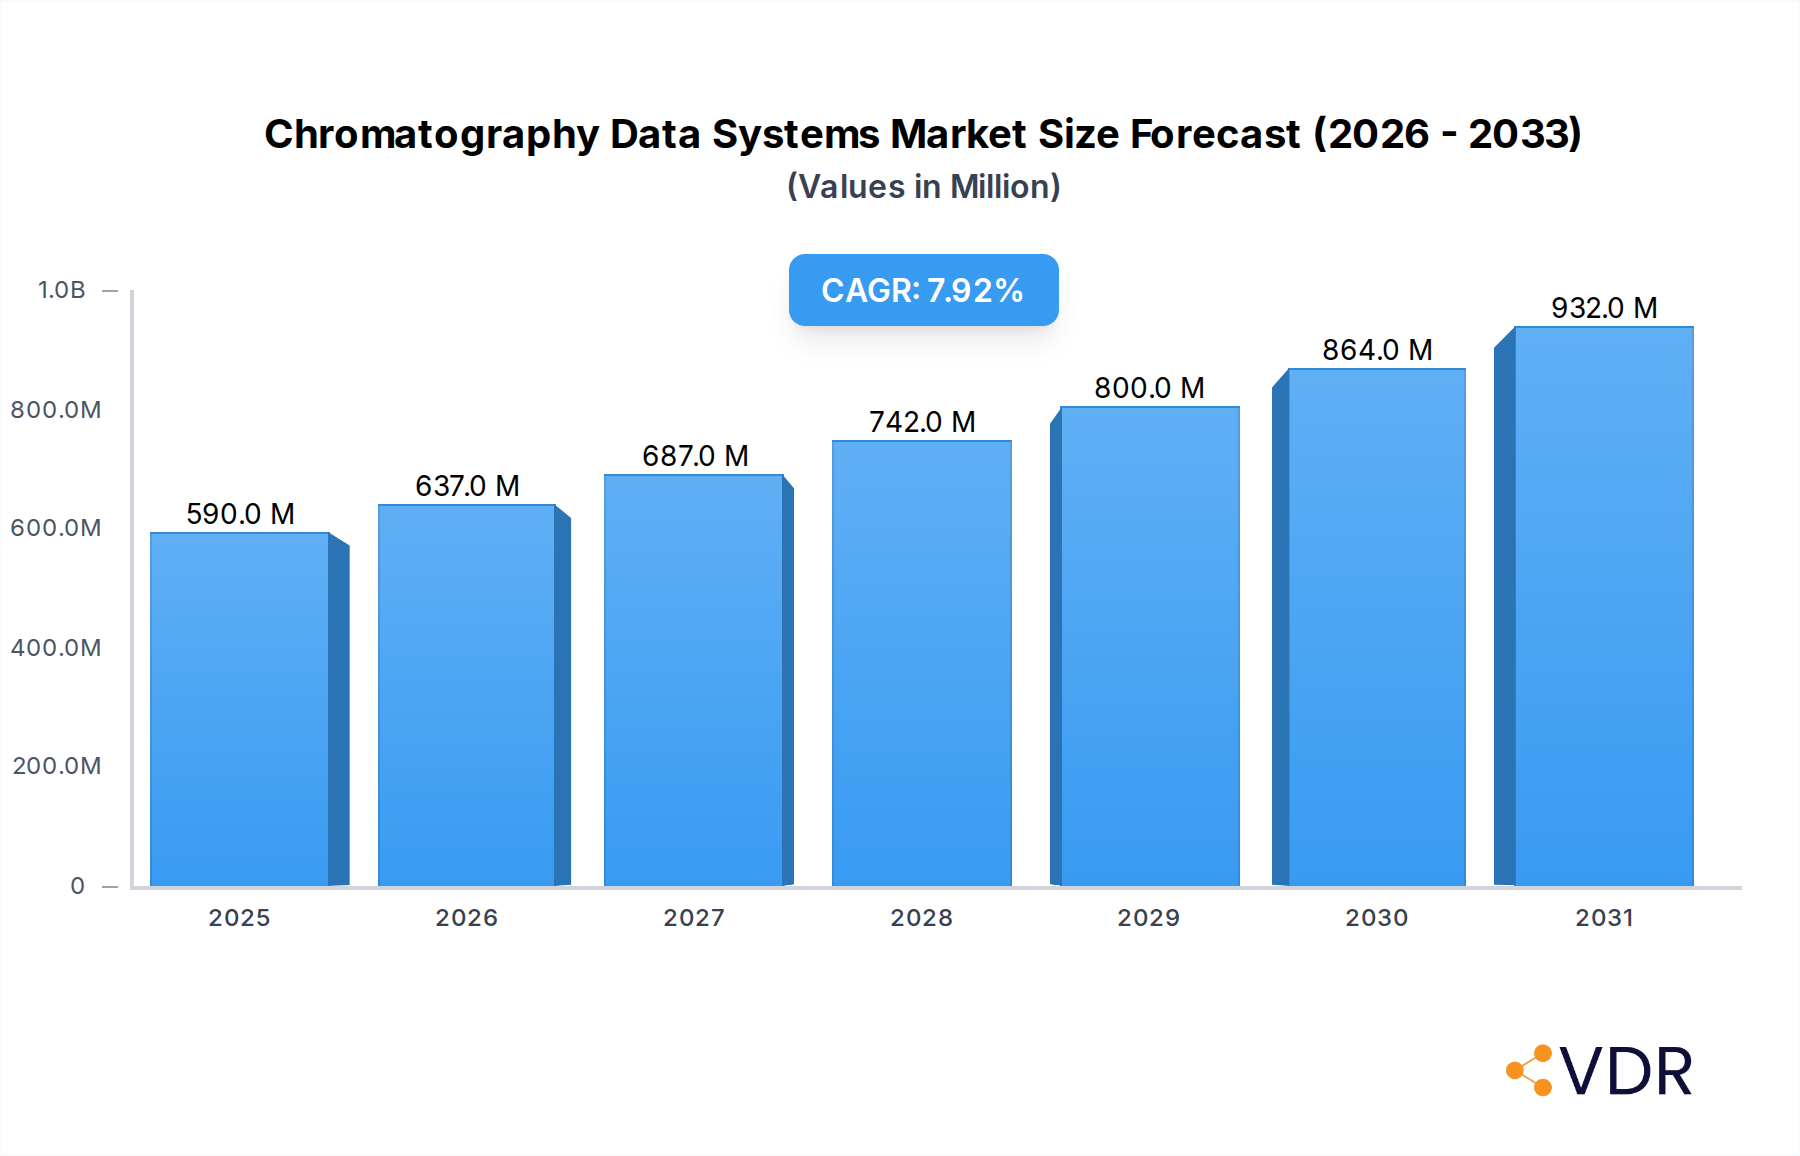
Chromatography Data Systems Market Market Size (In Million)
Key demand drivers include the rising expenses on research and development from the life sciences sector, which necessitates advanced data management solutions for drug discovery, development, and quality control. Simultaneously, the growing demand for food testing, driven by consumer safety concerns and evolving regulatory frameworks, further fuels the adoption of sophisticated CDS platforms. These systems play a critical role in accurately identifying and quantifying contaminants, additives, and nutritional components in food products. Technologically, the market is experiencing a significant shift towards more flexible and scalable deployment models, with the cloud segment expected to witness substantial growth. This trend allows for enhanced collaboration, reduced infrastructure costs, and improved data accessibility, aligning with the broader digital transformation within the Laboratory Informatics Market. The demand for seamless integration with other Analytical Instruments Market offerings, such as Mass Spectrometry Market systems, and enterprise-level solutions like Laboratory Information Management Systems (LIMS), further underscores the market's trajectory towards integrated, intelligent laboratory environments. As industries navigate increasingly complex analytical challenges and regulatory demands, the Chromatography Data Systems Market is set to play an even more crucial role in ensuring data accuracy, operational efficiency, and scientific advancement.

Chromatography Data Systems Market Company Market Share
Dominant End-User Segment in Chromatography Data Systems Market
Within the Chromatography Data Systems Market, the "Pharmaceutical Companies" end-user segment is a significant contributor to market revenue, driven by inherent industry characteristics and regulatory mandates. While specific revenue share data for individual segments was not provided in the source material, the considerable and ongoing investment in research and development from the life sciences sector, explicitly identified as a key market driver, strongly positions pharmaceutical and biotechnology companies as primary adopters of advanced CDS solutions. Pharmaceutical companies operate under rigorous regulatory frameworks, such as FDA 21 CFR Part 11, which demand meticulous data integrity, audit trails, and robust electronic record management. Chromatography Data Systems are integral to achieving and maintaining this compliance across all stages of drug development, from discovery and preclinical testing to clinical trials and quality control (QC) in manufacturing.
The widespread application of chromatographic techniques, including High-Performance Liquid Chromatography Market (HPLC) and Gas Chromatography Market (GC), in pharmaceutical research and quality assurance underscores the reliance on CDS. These techniques are critical for compound identification, purity analysis, stability studies, and dissolution testing. The sheer volume and complexity of analytical data generated in pharmaceutical laboratories necessitate powerful CDS platforms capable of efficient data acquisition, processing, interpretation, and secure archival. Furthermore, the drive for higher throughput in drug screening and the need for automation in analytical laboratories propel the demand for integrated CDS platforms that can seamlessly interface with various analytical instruments and other Laboratory Informatics Market systems. The stringent quality control processes in the Pharmaceutical & Biotechnology Market also ensure a continuous demand for upgrading and maintaining validated CDS environments, contributing to a stable and growing revenue stream for market participants. The shift towards biologics and personalized medicine, with their unique analytical challenges, is also expected to further solidify the dominance of pharmaceutical end-users in the adoption of sophisticated Chromatography Data Systems.
Key Market Drivers and Constraints in Chromatography Data Systems Market
The Chromatography Data Systems Market is profoundly influenced by several macro and microeconomic factors. Two primary drivers stand out based on the provided report data:
Firstly, the Rising Expenses on Research and Development From Life Sciences Sector serves as a significant catalyst for market growth. Life sciences companies, particularly those within the Pharmaceutical & Biotechnology Market, continually invest substantial capital into drug discovery, development, and advanced biological research. This sustained and increasing R&D expenditure directly translates into a heightened demand for sophisticated analytical instruments and the robust data management systems required to process their output. For instance, the development of new drug entities or complex biopharmaceuticals necessitates extensive chromatographic analysis for purification, characterization, and quality control. Modern CDS platforms are crucial for managing the voluminous, complex data generated by High-Performance Liquid Chromatography Market, Gas Chromatography Market, and other techniques, ensuring data integrity, audit trails, and compliance with stringent regulatory requirements such as FDA 21 CFR Part 11.
Secondly, the Growing Demand for Food Testing is another powerful driver. Global food safety concerns, coupled with an increasing array of regulations and consumer awareness regarding food quality, have spurred a surge in analytical testing across the food and beverage industry. This includes testing for contaminants (pesticides, heavy metals), allergens, nutritional components, and authenticity. Chromatography, often coupled with Mass Spectrometry Market techniques, is a cornerstone of Food Testing Market laboratories worldwide. CDS platforms provide the essential infrastructure to manage the large datasets, automate reporting, and ensure the traceability and reliability of analytical results, thereby supporting compliance with international food safety standards and protecting public health.
Regarding constraints, the report data indicates Rising Expenses on Research and Development From Life Sciences Sector as a restraint, which presents an apparent dichotomy with its role as a driver. Interpreting this, while R&D spending by life sciences fuels demand for CDS, the high cost associated with the implementation, validation, and ongoing maintenance of advanced Chromatography Data Systems solutions can pose a significant barrier, especially for smaller academic institutions or emerging biotechnology firms. The initial capital outlay for high-end analytical instruments and their integrated CDS, coupled with the specialized personnel required for operation and regulatory compliance, can strain budgets. This implies that while the need for advanced analytics is clear, the financial burden of adopting and sustaining these sophisticated systems can slow market penetration in certain segments or regions.
Competitive Ecosystem of Chromatography Data Systems Market
Competition within the Chromatography Data Systems Market is characterized by a mix of large, diversified analytical instrument manufacturers and specialized software providers, all vying for market share through innovation, strategic partnerships, and customer support. The landscape is dynamic, with continuous advancements in software capabilities, integration, and cloud-based solutions:
- Advanced Chemistry Development Inc: A company recognized for its chemistry software solutions, including Spectrus JS for integrated analytical data processing, which complements chromatography data analysis with spectral interpretation tools.
- Agilent Technologies Inc: A major global player offering a comprehensive portfolio of analytical instruments and software, including its OpenLab CDS platform, known for its scalability and integration capabilities across various chromatographic techniques.
- Bio-Rad Laboratories Inc: Primarily known for its life science research and clinical diagnostics products, Bio-Rad also offers chromatography systems and associated software solutions tailored for biopharmaceutical applications.
- Bruker Corporation: A leading provider of high-performance scientific instruments and analytical solutions, Bruker’s portfolio includes software for chromatographic data processing, often integrated with their
Mass Spectrometry Marketand NMR platforms. - JASCO International Co Ltd: Specializes in optical spectroscopy and chromatography instruments, offering ChromNAV software that provides intuitive control and data management for their HPLC and GC systems.
- Justice Innovations Inc: Focuses on specialized software solutions, often catering to niche markets or specific regulatory needs, providing custom data management and reporting for analytical laboratories.
- PerkinElmer Inc: A global leader in diagnostics, life sciences, and applied markets, offering the SimplicityChrom CDS as part of its analytical instrumentation platforms, emphasizing ease of use and 21 CFR Part 11 compliance.
- Shimadzu Corporation: A prominent manufacturer of precision instruments, medical equipment, and aircraft systems, Shimadzu provides its LabSolutions CDS for comprehensive control and data handling across its extensive range of
Gas Chromatography MarketandHigh-Performance Liquid Chromatography Marketinstruments. - Thermo Fisher Scientific Inc: A global scientific instrumentation and services giant, Thermo Fisher Scientific offers robust CDS solutions like Chromeleon, which provides full integration and compliance features for diverse analytical workflows.
- Waters Corporatio: A leading innovator in separation and
Mass Spectrometry Markettechnologies, Waters is renowned for its Empower CDS, widely considered a market standard for its comprehensive compliance features, scalability, and broad instrument compatibility.
Recent Developments & Milestones in Chromatography Data Systems Market
The Chromatography Data Systems Market continues to evolve through strategic partnerships, product launches, and technological advancements aimed at enhancing integration, compliance, and user experience. Recent key developments include:
- May 2023: Sciex Corporation, a United States-based manufacturer of
Mass Spectrometry Marketinstrumentation, launched the BioPhase 8800 driver. This innovation enables the seamless integration of the BioPhase 8800 system with the Empower chromatography data system from Waters Technologies Corporation, improving workflow efficiency for users in biopharmaceutical analysis. - January 2023: Waters Corporation announced the launch of waters_connect System Monitoring. This new Software-as-a-Service (SaaS) application offers real-time monitoring capabilities for any chromatography instruments, irrespective of the manufacturer, that are running on Waters Empower Software. This development underscores the growing trend towards cloud-based solutions and remote laboratory management within the
Chromatography Data Systems Market. - June 2022: PerkinElmer Inc. launched the GC 2400 Platform, an advanced, automated gas chromatography, headspace sampler, and gas chromatography/mass spectrometry solution. Designed to simplify lab operations and drive precise results, the platform features the 21 CFR Part 11 compliant SimplicityChrom chromatography data system, which aims to reduce user training and guide teams through the entire
Gas Chromatography Marketworkflow.
Regional Market Breakdown for Chromatography Data Systems Market
While specific regional CAGR, revenue share, or absolute value data for the Chromatography Data Systems Market was not explicitly provided in the source material, a qualitative analysis of key regions reveals distinct market dynamics driven by varying levels of research investment, regulatory landscapes, and industrial infrastructure. The global market, valued at USD 506.63 Million, sees participation from diverse geographic areas.
North America, encompassing the United States, Canada, and Mexico, is a mature market characterized by significant R&D expenditures in the Pharmaceutical & Biotechnology Market. The presence of major pharmaceutical and biotechnology companies, stringent regulatory requirements, and a strong focus on advanced analytical techniques drive continuous adoption and upgrades of CDS. The United States, in particular, leads in life sciences innovation, underpinning a robust demand for compliant and integrated Laboratory Informatics Market solutions.
Europe, including Germany, the United Kingdom, and France, also represents a substantial market share. This region benefits from a strong academic and research base, a well-established Analytical Instruments Market, and a growing emphasis on food safety regulations, particularly in countries like Germany. The need for data integrity and efficient laboratory operations across industries, from pharmaceuticals to environmental testing, sustains the demand for sophisticated CDS platforms. Innovation in High-Performance Liquid Chromatography Market and Gas Chromatography Market also remains strong here.
Asia Pacific, covering China, Japan, and India, is projected to be the fastest-growing region. This growth is fueled by increasing investments in R&D, rapid expansion of the pharmaceutical and biotechnology sectors, and rising awareness and regulation concerning Food Testing Market and environmental monitoring. Emerging economies in this region are rapidly adopting modern laboratory infrastructure, driving significant demand for new installations and upgrades of Chromatography Data Systems.
The Middle East and Africa and South America regions currently hold smaller shares but are experiencing gradual growth. This expansion is primarily driven by increasing healthcare expenditure, industrialization, and the establishment of new research and quality control laboratories. As these regions develop their pharmaceutical and food processing industries, the demand for reliable analytical solutions and associated CDS is expected to rise, albeit from a lower base.

Chromatography Data Systems Market Regional Market Share
Export, Trade Flow & Tariff Impact on Chromatography Data Systems Market
The Chromatography Data Systems Market, intrinsically linked to the Analytical Instruments Market and Laboratory Informatics Market, is influenced by global trade flows of both physical instruments and intangible software solutions. Major trade corridors primarily involve established manufacturing hubs in North America (e.g., USA), Europe (e.g., Germany), and Asia (e.g., Japan, China) as leading exporters of chromatography hardware components and integrated systems. Importing nations typically include rapidly developing economies in Asia Pacific, Latin America, and the Middle East, which are expanding their pharmaceutical, biotechnology, and Food Testing Market capabilities.
Tariff and non-tariff barriers can significantly impact the cost and availability of chromatography instruments, subsequently affecting the deployment of associated CDS. For instance, recent trade policy shifts, such as tariffs imposed during the US-China trade disputes, led to increased costs for imported Analytical Instruments Market in both directions. This can either inflate the final price for end-users or force manufacturers to localize production or source components from alternative regions, potentially disrupting supply chains and delaying market entry for new CDS solutions requiring specific hardware. Furthermore, non-tariff barriers, including complex import licensing, varying technical standards, and certification requirements, can prolong customs processes and increase operational overheads for companies operating in the Chromatography Data Systems Market. The increasing prevalence of Cloud Computing Market-based CDS solutions, however, somewhat mitigates the impact of physical trade barriers for software, shifting challenges towards data sovereignty, cybersecurity, and cross-border data transfer regulations rather than traditional import/export duties.
Sustainability & ESG Pressures on Chromatography Data Systems Market
The Chromatography Data Systems Market is increasingly subject to sustainability and ESG (Environmental, Social, and Governance) pressures, reflecting a broader industry trend towards greener laboratory practices and responsible business operations. Environmental regulations are pushing laboratories to minimize their ecological footprint, directly impacting the demand for and design of CDS. For instance, regulations aimed at reducing solvent waste in High-Performance Liquid Chromatography Market or Gas Chromatography Market lead to a preference for CDS that can optimize methods for lower solvent consumption or manage data from micro- and nano-chromatography systems.
Carbon targets and circular economy mandates are influencing hardware design and software features. CDS developers are incorporating functionalities that support energy-efficient instrument operation, track consumable usage (e.g., columns, solvents), and facilitate digital documentation to reduce paper waste. The Cloud Computing Market deployment model for CDS, identified as a significant trend, also plays a crucial role here. Cloud-based systems reduce the need for on-premise servers, thereby cutting down energy consumption and physical waste. They also enable remote monitoring and operation, potentially reducing travel-related carbon emissions for service and support personnel.
ESG investor criteria are compelling companies in the Chromatography Data Systems Market to demonstrate clear commitments to sustainability. This translates into pressure for manufacturers to offer products with longer lifecycles, provide clear end-of-life recycling programs for instruments, and ensure their software adheres to robust data security and privacy standards (governance aspect). From a social perspective, intuitive and user-friendly CDS interfaces, robust training programs, and accessibility features contribute to the 'S' in ESG by enhancing user experience and promoting a skilled workforce in the Laboratory Informatics Market. Overall, the industry is witnessing a shift towards integrated solutions that not only deliver high analytical performance but also contribute to a more sustainable and ethically responsible laboratory ecosystem.
Chromatography Data Systems Market Segmentation
-
1. Type
- 1.1. Integrated CDS
- 1.2. Standalone CDS
-
2. Deployment Mode
- 2.1. On-Premise CDS
- 2.2. Cloud-Based CDS
- 2.3. Hybrid CDS
-
3. Enterprise Size
- 3.1. Large Enterprises
- 3.2. Small & Medium Enterprises (SMEs)
-
4. Technique
- 4.1. Gas Chromatography (GC)
- 4.2. High-Performance Liquid Chromatography (HPLC)
- 4.3. Ion Chromatography (IC)
- 4.4. Thin Layer Chromatography (TLC)
- 4.5. Supercritical Fluid Chromatography (SFC)
- 4.6. Others
-
5. End User
- 5.1. Pharmaceutical Companies
- 5.2. Biotechnology Companies
- 5.3. CROs
- 5.4. CDMOs
- 5.5. Academic and Research Institutes
- 5.6. Others
Chromatography Data Systems Market Segmentation By Geography
-
1. North America
- 1.1. United States
- 1.2. Canada
- 1.3. Mexico
-
2. Europe
- 2.1. Germany
- 2.2. United Kingdom
- 2.3. France
- 2.4. Italy
- 2.5. Spain
- 2.6. Rest of Europe
-
3. Asia Pacific
- 3.1. China
- 3.2. Japan
- 3.3. India
- 3.4. Australia
- 3.5. South Korea
- 3.6. Rest of Asia Pacific
-
4. Middle East and Africa
- 4.1. GCC
- 4.2. South Africa
- 4.3. Rest of Middle East and Africa
-
5. South America
- 5.1. Brazil
- 5.2. Argentina
- 5.3. Rest of South America
Chromatography Data Systems Market Regional Market Share
Geographic Coverage of Chromatography Data Systems Market
Chromatography Data Systems Market REPORT HIGHLIGHTS
| Aspects | Details |
|---|---|
| Study Period | 2020-2034 |
| Base Year | 2025 |
| Estimated Year | 2026 |
| Forecast Period | 2026-2034 |
| Historical Period | 2020-2025 |
| Growth Rate | CAGR of 7.92% from 2020-2034 |
| Segmentation |
|
Table of Contents
- 1. Introduction
- 1.1. Research Scope
- 1.2. Market Segmentation
- 1.3. Research Objective
- 1.4. Definitions and Assumptions
- 2. Executive Summary
- 2.1. Market Snapshot
- 3. Market Dynamics
- 3.1. Market Drivers
- 3.2. Market Restrains
- 3.3. Market Trends
- 3.4. Market Opportunities
- 4. Market Factor Analysis
- 4.1. Porters Five Forces
- 4.1.1. Bargaining Power of Suppliers
- 4.1.2. Bargaining Power of Buyers
- 4.1.3. Threat of New Entrants
- 4.1.4. Threat of Substitutes
- 4.1.5. Competitive Rivalry
- 4.2. PESTEL analysis
- 4.3. BCG Analysis
- 4.3.1. Stars (High Growth, High Market Share)
- 4.3.2. Cash Cows (Low Growth, High Market Share)
- 4.3.3. Question Mark (High Growth, Low Market Share)
- 4.3.4. Dogs (Low Growth, Low Market Share)
- 4.4. Ansoff Matrix Analysis
- 4.5. Supply Chain Analysis
- 4.6. Regulatory Landscape
- 4.7. Current Market Potential and Opportunity Assessment (TAM–SAM–SOM Framework)
- 4.8. VDR Analyst Note
- 4.1. Porters Five Forces
- 5. Market Analysis, Insights and Forecast 2021-2033
- 5.1. Market Analysis, Insights and Forecast - by Type
- 5.1.1. Integrated CDS
- 5.1.2. Standalone CDS
- 5.2. Market Analysis, Insights and Forecast - by Deployment Mode
- 5.2.1. On-Premise CDS
- 5.2.2. Cloud-Based CDS
- 5.2.3. Hybrid CDS
- 5.3. Market Analysis, Insights and Forecast - by Enterprise Size
- 5.3.1. Large Enterprises
- 5.3.2. Small & Medium Enterprises (SMEs)
- 5.4. Market Analysis, Insights and Forecast - by Technique
- 5.4.1. Gas Chromatography (GC)
- 5.4.2. High-Performance Liquid Chromatography (HPLC)
- 5.4.3. Ion Chromatography (IC)
- 5.4.4. Thin Layer Chromatography (TLC)
- 5.4.5. Supercritical Fluid Chromatography (SFC)
- 5.4.6. Others
- 5.5. Market Analysis, Insights and Forecast - by End User
- 5.5.1. Pharmaceutical Companies
- 5.5.2. Biotechnology Companies
- 5.5.3. CROs
- 5.5.4. CDMOs
- 5.5.5. Academic and Research Institutes
- 5.5.6. Others
- 5.6. Market Analysis, Insights and Forecast - by Region
- 5.6.1. North America
- 5.6.2. Europe
- 5.6.3. Asia Pacific
- 5.6.4. Middle East and Africa
- 5.6.5. South America
- 5.1. Market Analysis, Insights and Forecast - by Type
- 6. Global Chromatography Data Systems Market Analysis, Insights and Forecast, 2021-2033
- 6.1. Market Analysis, Insights and Forecast - by Type
- 6.1.1. Integrated CDS
- 6.1.2. Standalone CDS
- 6.2. Market Analysis, Insights and Forecast - by Deployment Mode
- 6.2.1. On-Premise CDS
- 6.2.2. Cloud-Based CDS
- 6.2.3. Hybrid CDS
- 6.3. Market Analysis, Insights and Forecast - by Enterprise Size
- 6.3.1. Large Enterprises
- 6.3.2. Small & Medium Enterprises (SMEs)
- 6.4. Market Analysis, Insights and Forecast - by Technique
- 6.4.1. Gas Chromatography (GC)
- 6.4.2. High-Performance Liquid Chromatography (HPLC)
- 6.4.3. Ion Chromatography (IC)
- 6.4.4. Thin Layer Chromatography (TLC)
- 6.4.5. Supercritical Fluid Chromatography (SFC)
- 6.4.6. Others
- 6.5. Market Analysis, Insights and Forecast - by End User
- 6.5.1. Pharmaceutical Companies
- 6.5.2. Biotechnology Companies
- 6.5.3. CROs
- 6.5.4. CDMOs
- 6.5.5. Academic and Research Institutes
- 6.5.6. Others
- 6.1. Market Analysis, Insights and Forecast - by Type
- 7. North America Chromatography Data Systems Market Analysis, Insights and Forecast, 2021-2033
- 7.1. Market Analysis, Insights and Forecast - by Type
- 7.1.1. Integrated CDS
- 7.1.2. Standalone CDS
- 7.2. Market Analysis, Insights and Forecast - by Deployment Mode
- 7.2.1. On-Premise CDS
- 7.2.2. Cloud-Based CDS
- 7.2.3. Hybrid CDS
- 7.3. Market Analysis, Insights and Forecast - by Enterprise Size
- 7.3.1. Large Enterprises
- 7.3.2. Small & Medium Enterprises (SMEs)
- 7.4. Market Analysis, Insights and Forecast - by Technique
- 7.4.1. Gas Chromatography (GC)
- 7.4.2. High-Performance Liquid Chromatography (HPLC)
- 7.4.3. Ion Chromatography (IC)
- 7.4.4. Thin Layer Chromatography (TLC)
- 7.4.5. Supercritical Fluid Chromatography (SFC)
- 7.4.6. Others
- 7.5. Market Analysis, Insights and Forecast - by End User
- 7.5.1. Pharmaceutical Companies
- 7.5.2. Biotechnology Companies
- 7.5.3. CROs
- 7.5.4. CDMOs
- 7.5.5. Academic and Research Institutes
- 7.5.6. Others
- 7.1. Market Analysis, Insights and Forecast - by Type
- 8. Europe Chromatography Data Systems Market Analysis, Insights and Forecast, 2021-2033
- 8.1. Market Analysis, Insights and Forecast - by Type
- 8.1.1. Integrated CDS
- 8.1.2. Standalone CDS
- 8.2. Market Analysis, Insights and Forecast - by Deployment Mode
- 8.2.1. On-Premise CDS
- 8.2.2. Cloud-Based CDS
- 8.2.3. Hybrid CDS
- 8.3. Market Analysis, Insights and Forecast - by Enterprise Size
- 8.3.1. Large Enterprises
- 8.3.2. Small & Medium Enterprises (SMEs)
- 8.4. Market Analysis, Insights and Forecast - by Technique
- 8.4.1. Gas Chromatography (GC)
- 8.4.2. High-Performance Liquid Chromatography (HPLC)
- 8.4.3. Ion Chromatography (IC)
- 8.4.4. Thin Layer Chromatography (TLC)
- 8.4.5. Supercritical Fluid Chromatography (SFC)
- 8.4.6. Others
- 8.5. Market Analysis, Insights and Forecast - by End User
- 8.5.1. Pharmaceutical Companies
- 8.5.2. Biotechnology Companies
- 8.5.3. CROs
- 8.5.4. CDMOs
- 8.5.5. Academic and Research Institutes
- 8.5.6. Others
- 8.1. Market Analysis, Insights and Forecast - by Type
- 9. Asia Pacific Chromatography Data Systems Market Analysis, Insights and Forecast, 2021-2033
- 9.1. Market Analysis, Insights and Forecast - by Type
- 9.1.1. Integrated CDS
- 9.1.2. Standalone CDS
- 9.2. Market Analysis, Insights and Forecast - by Deployment Mode
- 9.2.1. On-Premise CDS
- 9.2.2. Cloud-Based CDS
- 9.2.3. Hybrid CDS
- 9.3. Market Analysis, Insights and Forecast - by Enterprise Size
- 9.3.1. Large Enterprises
- 9.3.2. Small & Medium Enterprises (SMEs)
- 9.4. Market Analysis, Insights and Forecast - by Technique
- 9.4.1. Gas Chromatography (GC)
- 9.4.2. High-Performance Liquid Chromatography (HPLC)
- 9.4.3. Ion Chromatography (IC)
- 9.4.4. Thin Layer Chromatography (TLC)
- 9.4.5. Supercritical Fluid Chromatography (SFC)
- 9.4.6. Others
- 9.5. Market Analysis, Insights and Forecast - by End User
- 9.5.1. Pharmaceutical Companies
- 9.5.2. Biotechnology Companies
- 9.5.3. CROs
- 9.5.4. CDMOs
- 9.5.5. Academic and Research Institutes
- 9.5.6. Others
- 9.1. Market Analysis, Insights and Forecast - by Type
- 10. Middle East and Africa Chromatography Data Systems Market Analysis, Insights and Forecast, 2021-2033
- 10.1. Market Analysis, Insights and Forecast - by Type
- 10.1.1. Integrated CDS
- 10.1.2. Standalone CDS
- 10.2. Market Analysis, Insights and Forecast - by Deployment Mode
- 10.2.1. On-Premise CDS
- 10.2.2. Cloud-Based CDS
- 10.2.3. Hybrid CDS
- 10.3. Market Analysis, Insights and Forecast - by Enterprise Size
- 10.3.1. Large Enterprises
- 10.3.2. Small & Medium Enterprises (SMEs)
- 10.4. Market Analysis, Insights and Forecast - by Technique
- 10.4.1. Gas Chromatography (GC)
- 10.4.2. High-Performance Liquid Chromatography (HPLC)
- 10.4.3. Ion Chromatography (IC)
- 10.4.4. Thin Layer Chromatography (TLC)
- 10.4.5. Supercritical Fluid Chromatography (SFC)
- 10.4.6. Others
- 10.5. Market Analysis, Insights and Forecast - by End User
- 10.5.1. Pharmaceutical Companies
- 10.5.2. Biotechnology Companies
- 10.5.3. CROs
- 10.5.4. CDMOs
- 10.5.5. Academic and Research Institutes
- 10.5.6. Others
- 10.1. Market Analysis, Insights and Forecast - by Type
- 11. South America Chromatography Data Systems Market Analysis, Insights and Forecast, 2021-2033
- 11.1. Market Analysis, Insights and Forecast - by Type
- 11.1.1. Integrated CDS
- 11.1.2. Standalone CDS
- 11.2. Market Analysis, Insights and Forecast - by Deployment Mode
- 11.2.1. On-Premise CDS
- 11.2.2. Cloud-Based CDS
- 11.2.3. Hybrid CDS
- 11.3. Market Analysis, Insights and Forecast - by Enterprise Size
- 11.3.1. Large Enterprises
- 11.3.2. Small & Medium Enterprises (SMEs)
- 11.4. Market Analysis, Insights and Forecast - by Technique
- 11.4.1. Gas Chromatography (GC)
- 11.4.2. High-Performance Liquid Chromatography (HPLC)
- 11.4.3. Ion Chromatography (IC)
- 11.4.4. Thin Layer Chromatography (TLC)
- 11.4.5. Supercritical Fluid Chromatography (SFC)
- 11.4.6. Others
- 11.5. Market Analysis, Insights and Forecast - by End User
- 11.5.1. Pharmaceutical Companies
- 11.5.2. Biotechnology Companies
- 11.5.3. CROs
- 11.5.4. CDMOs
- 11.5.5. Academic and Research Institutes
- 11.5.6. Others
- 11.1. Market Analysis, Insights and Forecast - by Type
- 12. Competitive Analysis
- 12.1. Company Profiles
- 12.1.1 Advanced Chemistry Development Inc
- 12.1.1.1. Company Overview
- 12.1.1.2. Products
- 12.1.1.3. Company Financials
- 12.1.1.4. SWOT Analysis
- 12.1.2 Agilent Technologies Inc
- 12.1.2.1. Company Overview
- 12.1.2.2. Products
- 12.1.2.3. Company Financials
- 12.1.2.4. SWOT Analysis
- 12.1.3 Bio-Rad Laboratories Inc
- 12.1.3.1. Company Overview
- 12.1.3.2. Products
- 12.1.3.3. Company Financials
- 12.1.3.4. SWOT Analysis
- 12.1.4 Bruker Corporation
- 12.1.4.1. Company Overview
- 12.1.4.2. Products
- 12.1.4.3. Company Financials
- 12.1.4.4. SWOT Analysis
- 12.1.5 JASCO International Co Ltd
- 12.1.5.1. Company Overview
- 12.1.5.2. Products
- 12.1.5.3. Company Financials
- 12.1.5.4. SWOT Analysis
- 12.1.6 Justice Innovations Inc
- 12.1.6.1. Company Overview
- 12.1.6.2. Products
- 12.1.6.3. Company Financials
- 12.1.6.4. SWOT Analysis
- 12.1.7 PerkinElmer Inc
- 12.1.7.1. Company Overview
- 12.1.7.2. Products
- 12.1.7.3. Company Financials
- 12.1.7.4. SWOT Analysis
- 12.1.8 Shimadzu Corporation
- 12.1.8.1. Company Overview
- 12.1.8.2. Products
- 12.1.8.3. Company Financials
- 12.1.8.4. SWOT Analysis
- 12.1.9 Thermo Fisher Scientific Inc
- 12.1.9.1. Company Overview
- 12.1.9.2. Products
- 12.1.9.3. Company Financials
- 12.1.9.4. SWOT Analysis
- 12.1.10 Waters Corporatio
- 12.1.10.1. Company Overview
- 12.1.10.2. Products
- 12.1.10.3. Company Financials
- 12.1.10.4. SWOT Analysis
- 12.1.1 Advanced Chemistry Development Inc
- 12.2. Market Entropy
- 12.2.1 Company's Key Areas Served
- 12.2.2 Recent Developments
- 12.3. Company Market Share Analysis 2025
- 12.3.1 Top 5 Companies Market Share Analysis
- 12.3.2 Top 3 Companies Market Share Analysis
- 12.4. List of Potential Customers
- 13. Research Methodology
List of Figures
- Figure 1: Global Chromatography Data Systems Market Revenue Breakdown (Million, %) by Region 2025 & 2033
- Figure 2: Global Chromatography Data Systems Market Volume Breakdown (Million, %) by Region 2025 & 2033
- Figure 3: North America Chromatography Data Systems Market Revenue (Million), by Type 2025 & 2033
- Figure 4: North America Chromatography Data Systems Market Volume (Million), by Type 2025 & 2033
- Figure 5: North America Chromatography Data Systems Market Revenue Share (%), by Type 2025 & 2033
- Figure 6: North America Chromatography Data Systems Market Volume Share (%), by Type 2025 & 2033
- Figure 7: North America Chromatography Data Systems Market Revenue (Million), by Deployment Mode 2025 & 2033
- Figure 8: North America Chromatography Data Systems Market Volume (Million), by Deployment Mode 2025 & 2033
- Figure 9: North America Chromatography Data Systems Market Revenue Share (%), by Deployment Mode 2025 & 2033
- Figure 10: North America Chromatography Data Systems Market Volume Share (%), by Deployment Mode 2025 & 2033
- Figure 11: North America Chromatography Data Systems Market Revenue (Million), by Enterprise Size 2025 & 2033
- Figure 12: North America Chromatography Data Systems Market Volume (Million), by Enterprise Size 2025 & 2033
- Figure 13: North America Chromatography Data Systems Market Revenue Share (%), by Enterprise Size 2025 & 2033
- Figure 14: North America Chromatography Data Systems Market Volume Share (%), by Enterprise Size 2025 & 2033
- Figure 15: North America Chromatography Data Systems Market Revenue (Million), by Technique 2025 & 2033
- Figure 16: North America Chromatography Data Systems Market Volume (Million), by Technique 2025 & 2033
- Figure 17: North America Chromatography Data Systems Market Revenue Share (%), by Technique 2025 & 2033
- Figure 18: North America Chromatography Data Systems Market Volume Share (%), by Technique 2025 & 2033
- Figure 19: North America Chromatography Data Systems Market Revenue (Million), by End User 2025 & 2033
- Figure 20: North America Chromatography Data Systems Market Volume (Million), by End User 2025 & 2033
- Figure 21: North America Chromatography Data Systems Market Revenue Share (%), by End User 2025 & 2033
- Figure 22: North America Chromatography Data Systems Market Volume Share (%), by End User 2025 & 2033
- Figure 23: North America Chromatography Data Systems Market Revenue (Million), by Country 2025 & 2033
- Figure 24: North America Chromatography Data Systems Market Volume (Million), by Country 2025 & 2033
- Figure 25: North America Chromatography Data Systems Market Revenue Share (%), by Country 2025 & 2033
- Figure 26: North America Chromatography Data Systems Market Volume Share (%), by Country 2025 & 2033
- Figure 27: Europe Chromatography Data Systems Market Revenue (Million), by Type 2025 & 2033
- Figure 28: Europe Chromatography Data Systems Market Volume (Million), by Type 2025 & 2033
- Figure 29: Europe Chromatography Data Systems Market Revenue Share (%), by Type 2025 & 2033
- Figure 30: Europe Chromatography Data Systems Market Volume Share (%), by Type 2025 & 2033
- Figure 31: Europe Chromatography Data Systems Market Revenue (Million), by Deployment Mode 2025 & 2033
- Figure 32: Europe Chromatography Data Systems Market Volume (Million), by Deployment Mode 2025 & 2033
- Figure 33: Europe Chromatography Data Systems Market Revenue Share (%), by Deployment Mode 2025 & 2033
- Figure 34: Europe Chromatography Data Systems Market Volume Share (%), by Deployment Mode 2025 & 2033
- Figure 35: Europe Chromatography Data Systems Market Revenue (Million), by Enterprise Size 2025 & 2033
- Figure 36: Europe Chromatography Data Systems Market Volume (Million), by Enterprise Size 2025 & 2033
- Figure 37: Europe Chromatography Data Systems Market Revenue Share (%), by Enterprise Size 2025 & 2033
- Figure 38: Europe Chromatography Data Systems Market Volume Share (%), by Enterprise Size 2025 & 2033
- Figure 39: Europe Chromatography Data Systems Market Revenue (Million), by Technique 2025 & 2033
- Figure 40: Europe Chromatography Data Systems Market Volume (Million), by Technique 2025 & 2033
- Figure 41: Europe Chromatography Data Systems Market Revenue Share (%), by Technique 2025 & 2033
- Figure 42: Europe Chromatography Data Systems Market Volume Share (%), by Technique 2025 & 2033
- Figure 43: Europe Chromatography Data Systems Market Revenue (Million), by End User 2025 & 2033
- Figure 44: Europe Chromatography Data Systems Market Volume (Million), by End User 2025 & 2033
- Figure 45: Europe Chromatography Data Systems Market Revenue Share (%), by End User 2025 & 2033
- Figure 46: Europe Chromatography Data Systems Market Volume Share (%), by End User 2025 & 2033
- Figure 47: Europe Chromatography Data Systems Market Revenue (Million), by Country 2025 & 2033
- Figure 48: Europe Chromatography Data Systems Market Volume (Million), by Country 2025 & 2033
- Figure 49: Europe Chromatography Data Systems Market Revenue Share (%), by Country 2025 & 2033
- Figure 50: Europe Chromatography Data Systems Market Volume Share (%), by Country 2025 & 2033
- Figure 51: Asia Pacific Chromatography Data Systems Market Revenue (Million), by Type 2025 & 2033
- Figure 52: Asia Pacific Chromatography Data Systems Market Volume (Million), by Type 2025 & 2033
- Figure 53: Asia Pacific Chromatography Data Systems Market Revenue Share (%), by Type 2025 & 2033
- Figure 54: Asia Pacific Chromatography Data Systems Market Volume Share (%), by Type 2025 & 2033
- Figure 55: Asia Pacific Chromatography Data Systems Market Revenue (Million), by Deployment Mode 2025 & 2033
- Figure 56: Asia Pacific Chromatography Data Systems Market Volume (Million), by Deployment Mode 2025 & 2033
- Figure 57: Asia Pacific Chromatography Data Systems Market Revenue Share (%), by Deployment Mode 2025 & 2033
- Figure 58: Asia Pacific Chromatography Data Systems Market Volume Share (%), by Deployment Mode 2025 & 2033
- Figure 59: Asia Pacific Chromatography Data Systems Market Revenue (Million), by Enterprise Size 2025 & 2033
- Figure 60: Asia Pacific Chromatography Data Systems Market Volume (Million), by Enterprise Size 2025 & 2033
- Figure 61: Asia Pacific Chromatography Data Systems Market Revenue Share (%), by Enterprise Size 2025 & 2033
- Figure 62: Asia Pacific Chromatography Data Systems Market Volume Share (%), by Enterprise Size 2025 & 2033
- Figure 63: Asia Pacific Chromatography Data Systems Market Revenue (Million), by Technique 2025 & 2033
- Figure 64: Asia Pacific Chromatography Data Systems Market Volume (Million), by Technique 2025 & 2033
- Figure 65: Asia Pacific Chromatography Data Systems Market Revenue Share (%), by Technique 2025 & 2033
- Figure 66: Asia Pacific Chromatography Data Systems Market Volume Share (%), by Technique 2025 & 2033
- Figure 67: Asia Pacific Chromatography Data Systems Market Revenue (Million), by End User 2025 & 2033
- Figure 68: Asia Pacific Chromatography Data Systems Market Volume (Million), by End User 2025 & 2033
- Figure 69: Asia Pacific Chromatography Data Systems Market Revenue Share (%), by End User 2025 & 2033
- Figure 70: Asia Pacific Chromatography Data Systems Market Volume Share (%), by End User 2025 & 2033
- Figure 71: Asia Pacific Chromatography Data Systems Market Revenue (Million), by Country 2025 & 2033
- Figure 72: Asia Pacific Chromatography Data Systems Market Volume (Million), by Country 2025 & 2033
- Figure 73: Asia Pacific Chromatography Data Systems Market Revenue Share (%), by Country 2025 & 2033
- Figure 74: Asia Pacific Chromatography Data Systems Market Volume Share (%), by Country 2025 & 2033
- Figure 75: Middle East and Africa Chromatography Data Systems Market Revenue (Million), by Type 2025 & 2033
- Figure 76: Middle East and Africa Chromatography Data Systems Market Volume (Million), by Type 2025 & 2033
- Figure 77: Middle East and Africa Chromatography Data Systems Market Revenue Share (%), by Type 2025 & 2033
- Figure 78: Middle East and Africa Chromatography Data Systems Market Volume Share (%), by Type 2025 & 2033
- Figure 79: Middle East and Africa Chromatography Data Systems Market Revenue (Million), by Deployment Mode 2025 & 2033
- Figure 80: Middle East and Africa Chromatography Data Systems Market Volume (Million), by Deployment Mode 2025 & 2033
- Figure 81: Middle East and Africa Chromatography Data Systems Market Revenue Share (%), by Deployment Mode 2025 & 2033
- Figure 82: Middle East and Africa Chromatography Data Systems Market Volume Share (%), by Deployment Mode 2025 & 2033
- Figure 83: Middle East and Africa Chromatography Data Systems Market Revenue (Million), by Enterprise Size 2025 & 2033
- Figure 84: Middle East and Africa Chromatography Data Systems Market Volume (Million), by Enterprise Size 2025 & 2033
- Figure 85: Middle East and Africa Chromatography Data Systems Market Revenue Share (%), by Enterprise Size 2025 & 2033
- Figure 86: Middle East and Africa Chromatography Data Systems Market Volume Share (%), by Enterprise Size 2025 & 2033
- Figure 87: Middle East and Africa Chromatography Data Systems Market Revenue (Million), by Technique 2025 & 2033
- Figure 88: Middle East and Africa Chromatography Data Systems Market Volume (Million), by Technique 2025 & 2033
- Figure 89: Middle East and Africa Chromatography Data Systems Market Revenue Share (%), by Technique 2025 & 2033
- Figure 90: Middle East and Africa Chromatography Data Systems Market Volume Share (%), by Technique 2025 & 2033
- Figure 91: Middle East and Africa Chromatography Data Systems Market Revenue (Million), by End User 2025 & 2033
- Figure 92: Middle East and Africa Chromatography Data Systems Market Volume (Million), by End User 2025 & 2033
- Figure 93: Middle East and Africa Chromatography Data Systems Market Revenue Share (%), by End User 2025 & 2033
- Figure 94: Middle East and Africa Chromatography Data Systems Market Volume Share (%), by End User 2025 & 2033
- Figure 95: Middle East and Africa Chromatography Data Systems Market Revenue (Million), by Country 2025 & 2033
- Figure 96: Middle East and Africa Chromatography Data Systems Market Volume (Million), by Country 2025 & 2033
- Figure 97: Middle East and Africa Chromatography Data Systems Market Revenue Share (%), by Country 2025 & 2033
- Figure 98: Middle East and Africa Chromatography Data Systems Market Volume Share (%), by Country 2025 & 2033
- Figure 99: South America Chromatography Data Systems Market Revenue (Million), by Type 2025 & 2033
- Figure 100: South America Chromatography Data Systems Market Volume (Million), by Type 2025 & 2033
- Figure 101: South America Chromatography Data Systems Market Revenue Share (%), by Type 2025 & 2033
- Figure 102: South America Chromatography Data Systems Market Volume Share (%), by Type 2025 & 2033
- Figure 103: South America Chromatography Data Systems Market Revenue (Million), by Deployment Mode 2025 & 2033
- Figure 104: South America Chromatography Data Systems Market Volume (Million), by Deployment Mode 2025 & 2033
- Figure 105: South America Chromatography Data Systems Market Revenue Share (%), by Deployment Mode 2025 & 2033
- Figure 106: South America Chromatography Data Systems Market Volume Share (%), by Deployment Mode 2025 & 2033
- Figure 107: South America Chromatography Data Systems Market Revenue (Million), by Enterprise Size 2025 & 2033
- Figure 108: South America Chromatography Data Systems Market Volume (Million), by Enterprise Size 2025 & 2033
- Figure 109: South America Chromatography Data Systems Market Revenue Share (%), by Enterprise Size 2025 & 2033
- Figure 110: South America Chromatography Data Systems Market Volume Share (%), by Enterprise Size 2025 & 2033
- Figure 111: South America Chromatography Data Systems Market Revenue (Million), by Technique 2025 & 2033
- Figure 112: South America Chromatography Data Systems Market Volume (Million), by Technique 2025 & 2033
- Figure 113: South America Chromatography Data Systems Market Revenue Share (%), by Technique 2025 & 2033
- Figure 114: South America Chromatography Data Systems Market Volume Share (%), by Technique 2025 & 2033
- Figure 115: South America Chromatography Data Systems Market Revenue (Million), by End User 2025 & 2033
- Figure 116: South America Chromatography Data Systems Market Volume (Million), by End User 2025 & 2033
- Figure 117: South America Chromatography Data Systems Market Revenue Share (%), by End User 2025 & 2033
- Figure 118: South America Chromatography Data Systems Market Volume Share (%), by End User 2025 & 2033
- Figure 119: South America Chromatography Data Systems Market Revenue (Million), by Country 2025 & 2033
- Figure 120: South America Chromatography Data Systems Market Volume (Million), by Country 2025 & 2033
- Figure 121: South America Chromatography Data Systems Market Revenue Share (%), by Country 2025 & 2033
- Figure 122: South America Chromatography Data Systems Market Volume Share (%), by Country 2025 & 2033
List of Tables
- Table 1: Global Chromatography Data Systems Market Revenue Million Forecast, by Type 2020 & 2033
- Table 2: Global Chromatography Data Systems Market Volume Million Forecast, by Type 2020 & 2033
- Table 3: Global Chromatography Data Systems Market Revenue Million Forecast, by Deployment Mode 2020 & 2033
- Table 4: Global Chromatography Data Systems Market Volume Million Forecast, by Deployment Mode 2020 & 2033
- Table 5: Global Chromatography Data Systems Market Revenue Million Forecast, by Enterprise Size 2020 & 2033
- Table 6: Global Chromatography Data Systems Market Volume Million Forecast, by Enterprise Size 2020 & 2033
- Table 7: Global Chromatography Data Systems Market Revenue Million Forecast, by Technique 2020 & 2033
- Table 8: Global Chromatography Data Systems Market Volume Million Forecast, by Technique 2020 & 2033
- Table 9: Global Chromatography Data Systems Market Revenue Million Forecast, by End User 2020 & 2033
- Table 10: Global Chromatography Data Systems Market Volume Million Forecast, by End User 2020 & 2033
- Table 11: Global Chromatography Data Systems Market Revenue Million Forecast, by Region 2020 & 2033
- Table 12: Global Chromatography Data Systems Market Volume Million Forecast, by Region 2020 & 2033
- Table 13: Global Chromatography Data Systems Market Revenue Million Forecast, by Type 2020 & 2033
- Table 14: Global Chromatography Data Systems Market Volume Million Forecast, by Type 2020 & 2033
- Table 15: Global Chromatography Data Systems Market Revenue Million Forecast, by Deployment Mode 2020 & 2033
- Table 16: Global Chromatography Data Systems Market Volume Million Forecast, by Deployment Mode 2020 & 2033
- Table 17: Global Chromatography Data Systems Market Revenue Million Forecast, by Enterprise Size 2020 & 2033
- Table 18: Global Chromatography Data Systems Market Volume Million Forecast, by Enterprise Size 2020 & 2033
- Table 19: Global Chromatography Data Systems Market Revenue Million Forecast, by Technique 2020 & 2033
- Table 20: Global Chromatography Data Systems Market Volume Million Forecast, by Technique 2020 & 2033
- Table 21: Global Chromatography Data Systems Market Revenue Million Forecast, by End User 2020 & 2033
- Table 22: Global Chromatography Data Systems Market Volume Million Forecast, by End User 2020 & 2033
- Table 23: Global Chromatography Data Systems Market Revenue Million Forecast, by Country 2020 & 2033
- Table 24: Global Chromatography Data Systems Market Volume Million Forecast, by Country 2020 & 2033
- Table 25: United States Chromatography Data Systems Market Revenue (Million) Forecast, by Application 2020 & 2033
- Table 26: United States Chromatography Data Systems Market Volume (Million) Forecast, by Application 2020 & 2033
- Table 27: Canada Chromatography Data Systems Market Revenue (Million) Forecast, by Application 2020 & 2033
- Table 28: Canada Chromatography Data Systems Market Volume (Million) Forecast, by Application 2020 & 2033
- Table 29: Mexico Chromatography Data Systems Market Revenue (Million) Forecast, by Application 2020 & 2033
- Table 30: Mexico Chromatography Data Systems Market Volume (Million) Forecast, by Application 2020 & 2033
- Table 31: Global Chromatography Data Systems Market Revenue Million Forecast, by Type 2020 & 2033
- Table 32: Global Chromatography Data Systems Market Volume Million Forecast, by Type 2020 & 2033
- Table 33: Global Chromatography Data Systems Market Revenue Million Forecast, by Deployment Mode 2020 & 2033
- Table 34: Global Chromatography Data Systems Market Volume Million Forecast, by Deployment Mode 2020 & 2033
- Table 35: Global Chromatography Data Systems Market Revenue Million Forecast, by Enterprise Size 2020 & 2033
- Table 36: Global Chromatography Data Systems Market Volume Million Forecast, by Enterprise Size 2020 & 2033
- Table 37: Global Chromatography Data Systems Market Revenue Million Forecast, by Technique 2020 & 2033
- Table 38: Global Chromatography Data Systems Market Volume Million Forecast, by Technique 2020 & 2033
- Table 39: Global Chromatography Data Systems Market Revenue Million Forecast, by End User 2020 & 2033
- Table 40: Global Chromatography Data Systems Market Volume Million Forecast, by End User 2020 & 2033
- Table 41: Global Chromatography Data Systems Market Revenue Million Forecast, by Country 2020 & 2033
- Table 42: Global Chromatography Data Systems Market Volume Million Forecast, by Country 2020 & 2033
- Table 43: Germany Chromatography Data Systems Market Revenue (Million) Forecast, by Application 2020 & 2033
- Table 44: Germany Chromatography Data Systems Market Volume (Million) Forecast, by Application 2020 & 2033
- Table 45: United Kingdom Chromatography Data Systems Market Revenue (Million) Forecast, by Application 2020 & 2033
- Table 46: United Kingdom Chromatography Data Systems Market Volume (Million) Forecast, by Application 2020 & 2033
- Table 47: France Chromatography Data Systems Market Revenue (Million) Forecast, by Application 2020 & 2033
- Table 48: France Chromatography Data Systems Market Volume (Million) Forecast, by Application 2020 & 2033
- Table 49: Italy Chromatography Data Systems Market Revenue (Million) Forecast, by Application 2020 & 2033
- Table 50: Italy Chromatography Data Systems Market Volume (Million) Forecast, by Application 2020 & 2033
- Table 51: Spain Chromatography Data Systems Market Revenue (Million) Forecast, by Application 2020 & 2033
- Table 52: Spain Chromatography Data Systems Market Volume (Million) Forecast, by Application 2020 & 2033
- Table 53: Rest of Europe Chromatography Data Systems Market Revenue (Million) Forecast, by Application 2020 & 2033
- Table 54: Rest of Europe Chromatography Data Systems Market Volume (Million) Forecast, by Application 2020 & 2033
- Table 55: Global Chromatography Data Systems Market Revenue Million Forecast, by Type 2020 & 2033
- Table 56: Global Chromatography Data Systems Market Volume Million Forecast, by Type 2020 & 2033
- Table 57: Global Chromatography Data Systems Market Revenue Million Forecast, by Deployment Mode 2020 & 2033
- Table 58: Global Chromatography Data Systems Market Volume Million Forecast, by Deployment Mode 2020 & 2033
- Table 59: Global Chromatography Data Systems Market Revenue Million Forecast, by Enterprise Size 2020 & 2033
- Table 60: Global Chromatography Data Systems Market Volume Million Forecast, by Enterprise Size 2020 & 2033
- Table 61: Global Chromatography Data Systems Market Revenue Million Forecast, by Technique 2020 & 2033
- Table 62: Global Chromatography Data Systems Market Volume Million Forecast, by Technique 2020 & 2033
- Table 63: Global Chromatography Data Systems Market Revenue Million Forecast, by End User 2020 & 2033
- Table 64: Global Chromatography Data Systems Market Volume Million Forecast, by End User 2020 & 2033
- Table 65: Global Chromatography Data Systems Market Revenue Million Forecast, by Country 2020 & 2033
- Table 66: Global Chromatography Data Systems Market Volume Million Forecast, by Country 2020 & 2033
- Table 67: China Chromatography Data Systems Market Revenue (Million) Forecast, by Application 2020 & 2033
- Table 68: China Chromatography Data Systems Market Volume (Million) Forecast, by Application 2020 & 2033
- Table 69: Japan Chromatography Data Systems Market Revenue (Million) Forecast, by Application 2020 & 2033
- Table 70: Japan Chromatography Data Systems Market Volume (Million) Forecast, by Application 2020 & 2033
- Table 71: India Chromatography Data Systems Market Revenue (Million) Forecast, by Application 2020 & 2033
- Table 72: India Chromatography Data Systems Market Volume (Million) Forecast, by Application 2020 & 2033
- Table 73: Australia Chromatography Data Systems Market Revenue (Million) Forecast, by Application 2020 & 2033
- Table 74: Australia Chromatography Data Systems Market Volume (Million) Forecast, by Application 2020 & 2033
- Table 75: South Korea Chromatography Data Systems Market Revenue (Million) Forecast, by Application 2020 & 2033
- Table 76: South Korea Chromatography Data Systems Market Volume (Million) Forecast, by Application 2020 & 2033
- Table 77: Rest of Asia Pacific Chromatography Data Systems Market Revenue (Million) Forecast, by Application 2020 & 2033
- Table 78: Rest of Asia Pacific Chromatography Data Systems Market Volume (Million) Forecast, by Application 2020 & 2033
- Table 79: Global Chromatography Data Systems Market Revenue Million Forecast, by Type 2020 & 2033
- Table 80: Global Chromatography Data Systems Market Volume Million Forecast, by Type 2020 & 2033
- Table 81: Global Chromatography Data Systems Market Revenue Million Forecast, by Deployment Mode 2020 & 2033
- Table 82: Global Chromatography Data Systems Market Volume Million Forecast, by Deployment Mode 2020 & 2033
- Table 83: Global Chromatography Data Systems Market Revenue Million Forecast, by Enterprise Size 2020 & 2033
- Table 84: Global Chromatography Data Systems Market Volume Million Forecast, by Enterprise Size 2020 & 2033
- Table 85: Global Chromatography Data Systems Market Revenue Million Forecast, by Technique 2020 & 2033
- Table 86: Global Chromatography Data Systems Market Volume Million Forecast, by Technique 2020 & 2033
- Table 87: Global Chromatography Data Systems Market Revenue Million Forecast, by End User 2020 & 2033
- Table 88: Global Chromatography Data Systems Market Volume Million Forecast, by End User 2020 & 2033
- Table 89: Global Chromatography Data Systems Market Revenue Million Forecast, by Country 2020 & 2033
- Table 90: Global Chromatography Data Systems Market Volume Million Forecast, by Country 2020 & 2033
- Table 91: GCC Chromatography Data Systems Market Revenue (Million) Forecast, by Application 2020 & 2033
- Table 92: GCC Chromatography Data Systems Market Volume (Million) Forecast, by Application 2020 & 2033
- Table 93: South Africa Chromatography Data Systems Market Revenue (Million) Forecast, by Application 2020 & 2033
- Table 94: South Africa Chromatography Data Systems Market Volume (Million) Forecast, by Application 2020 & 2033
- Table 95: Rest of Middle East and Africa Chromatography Data Systems Market Revenue (Million) Forecast, by Application 2020 & 2033
- Table 96: Rest of Middle East and Africa Chromatography Data Systems Market Volume (Million) Forecast, by Application 2020 & 2033
- Table 97: Global Chromatography Data Systems Market Revenue Million Forecast, by Type 2020 & 2033
- Table 98: Global Chromatography Data Systems Market Volume Million Forecast, by Type 2020 & 2033
- Table 99: Global Chromatography Data Systems Market Revenue Million Forecast, by Deployment Mode 2020 & 2033
- Table 100: Global Chromatography Data Systems Market Volume Million Forecast, by Deployment Mode 2020 & 2033
- Table 101: Global Chromatography Data Systems Market Revenue Million Forecast, by Enterprise Size 2020 & 2033
- Table 102: Global Chromatography Data Systems Market Volume Million Forecast, by Enterprise Size 2020 & 2033
- Table 103: Global Chromatography Data Systems Market Revenue Million Forecast, by Technique 2020 & 2033
- Table 104: Global Chromatography Data Systems Market Volume Million Forecast, by Technique 2020 & 2033
- Table 105: Global Chromatography Data Systems Market Revenue Million Forecast, by End User 2020 & 2033
- Table 106: Global Chromatography Data Systems Market Volume Million Forecast, by End User 2020 & 2033
- Table 107: Global Chromatography Data Systems Market Revenue Million Forecast, by Country 2020 & 2033
- Table 108: Global Chromatography Data Systems Market Volume Million Forecast, by Country 2020 & 2033
- Table 109: Brazil Chromatography Data Systems Market Revenue (Million) Forecast, by Application 2020 & 2033
- Table 110: Brazil Chromatography Data Systems Market Volume (Million) Forecast, by Application 2020 & 2033
- Table 111: Argentina Chromatography Data Systems Market Revenue (Million) Forecast, by Application 2020 & 2033
- Table 112: Argentina Chromatography Data Systems Market Volume (Million) Forecast, by Application 2020 & 2033
- Table 113: Rest of South America Chromatography Data Systems Market Revenue (Million) Forecast, by Application 2020 & 2033
- Table 114: Rest of South America Chromatography Data Systems Market Volume (Million) Forecast, by Application 2020 & 2033
Frequently Asked Questions
1. What is the projected Compound Annual Growth Rate (CAGR) of the Chromatography Data Systems Market?
The projected CAGR is approximately 7.92%.
2. Which companies are prominent players in the Chromatography Data Systems Market?
Key companies in the market include Advanced Chemistry Development Inc, Agilent Technologies Inc, Bio-Rad Laboratories Inc, Bruker Corporation, JASCO International Co Ltd, Justice Innovations Inc, PerkinElmer Inc, Shimadzu Corporation, Thermo Fisher Scientific Inc, Waters Corporatio.
3. What are the main segments of the Chromatography Data Systems Market?
The market segments include Type, Deployment Mode, Enterprise Size, Technique, End User.
4. Can you provide details about the market size?
The market size is estimated to be USD 506.63 Million as of 2022.
5. What are some drivers contributing to market growth?
Rising Expenses on Research and Development From Life Sciences Sector; Growing Demand for Food Testing.
6. What are the notable trends driving market growth?
The Cloud Segment is Expected to Witness Substantial Growth Over the Forecast Period.
7. Are there any restraints impacting market growth?
Rising Expenses on Research and Development From Life Sciences Sector; Growing Demand for Food Testing.
8. Can you provide examples of recent developments in the market?
May 2023: Sciex Corporation, a United States-based manufacturer of mass spectrometry instrumentation, launched the BioPhase 8800 driver, which enables the easy integration of the BioPhase 8800 system with the Empower chromatography data system from Waters Technologies Corporation.
9. What pricing options are available for accessing the report?
Pricing options include single-user, multi-user, and enterprise licenses priced at USD 4750, USD 5250, and USD 8750 respectively.
10. Is the market size provided in terms of value or volume?
The market size is provided in terms of value, measured in Million and volume, measured in Million.
11. Are there any specific market keywords associated with the report?
Yes, the market keyword associated with the report is "Chromatography Data Systems Market," which aids in identifying and referencing the specific market segment covered.
12. How do I determine which pricing option suits my needs best?
The pricing options vary based on user requirements and access needs. Individual users may opt for single-user licenses, while businesses requiring broader access may choose multi-user or enterprise licenses for cost-effective access to the report.
13. Are there any additional resources or data provided in the Chromatography Data Systems Market report?
While the report offers comprehensive insights, it's advisable to review the specific contents or supplementary materials provided to ascertain if additional resources or data are available.
14. How can I stay updated on further developments or reports in the Chromatography Data Systems Market?
To stay informed about further developments, trends, and reports in the Chromatography Data Systems Market, consider subscribing to industry newsletters, following relevant companies and organizations, or regularly checking reputable industry news sources and publications.
Methodology
Step 1 - Identification of Relevant Samples Size from Population Database


Step 2 - Approaches for Defining Global Market Size (Value, Volume* & Price*)

Note*: In applicable scenarios
Step 3 - Data Sources
Primary Research
- Web Analytics
- Survey Reports
- Research Institute
- Latest Research Reports
- Opinion Leaders
Secondary Research
- Annual Reports
- White Paper
- Latest Press Release
- Industry Association
- Paid Database
- Investor Presentations

Step 4 - Data Triangulation
Involves using different sources of information in order to increase the validity of a study
These sources are likely to be stakeholders in a program - participants, other researchers, program staff, other community members, and so on.
Then we put all data in single framework & apply various statistical tools to find out the dynamic on the market.
During the analysis stage, feedback from the stakeholder groups would be compared to determine areas of agreement as well as areas of divergence