


Key Insights
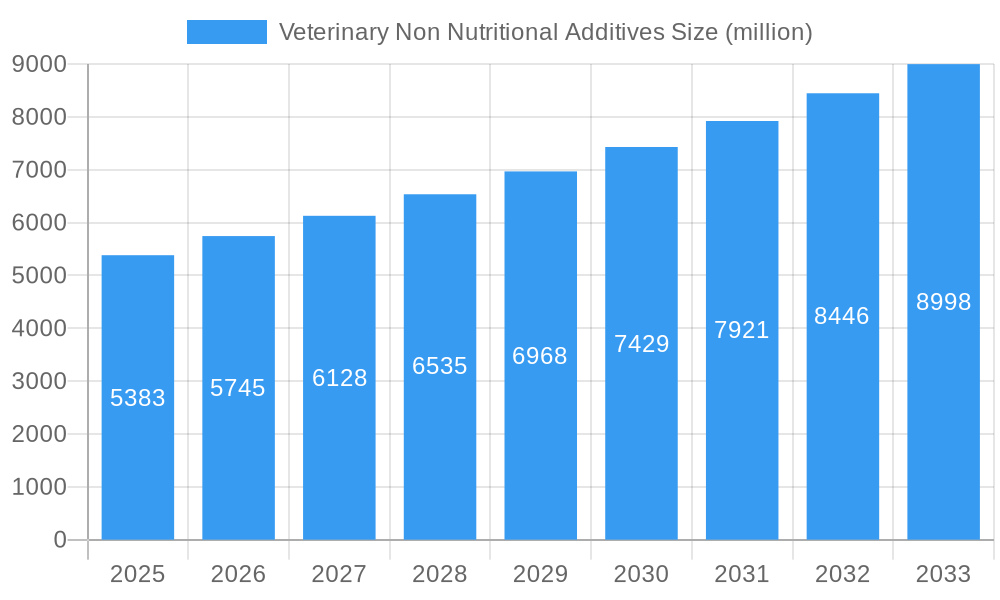
The global Veterinary Non-Nutritional Additives market is poised for significant expansion, projected to reach an estimated \$5,383 million by 2025, driven by a robust Compound Annual Growth Rate (CAGR) of 6.7%. This growth is fueled by an increasing global demand for animal protein, necessitating improved animal health and productivity to meet the needs of a growing population. The poultry segment is anticipated to be a primary driver, given the widespread adoption of intensive farming practices and the continuous need for disease prevention and growth enhancement in avian species. Furthermore, the rising awareness among livestock producers regarding the benefits of non-nutritional additives in preventing infections, reducing antibiotic reliance, and improving overall animal welfare contributes substantially to market expansion. Technological advancements in the formulation and delivery of these additives, alongside a growing emphasis on sustainable and antibiotic-free animal production, are further bolstering market prospects.
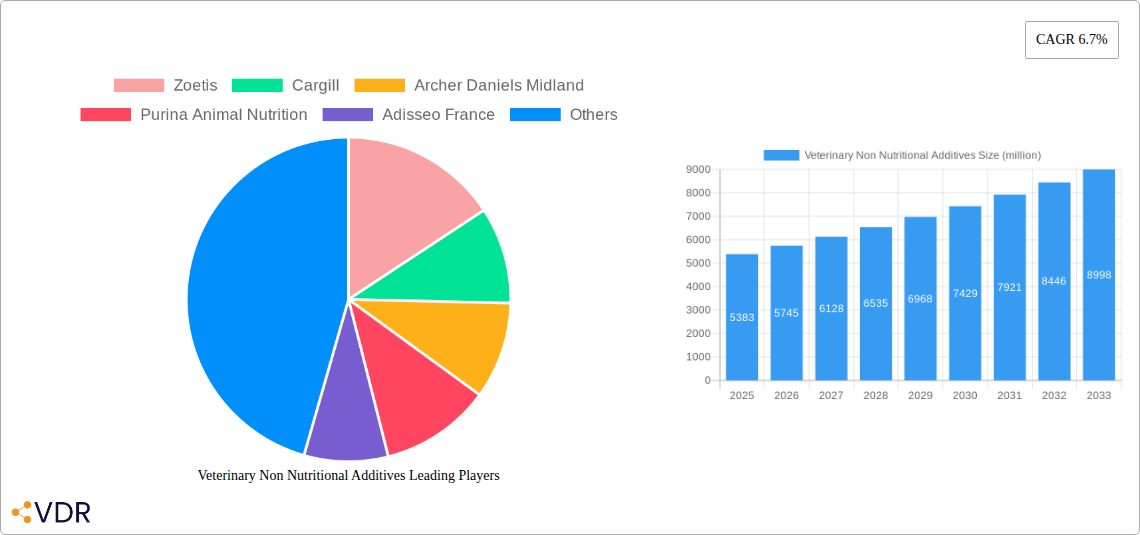
Veterinary Non Nutritional Additives Market Size (In Billion)

The market is segmented into various applications and types, reflecting the diverse needs of the animal husbandry sector. The "Growth Promoting" category within the "Type" segment is expected to witness substantial uptake, as producers seek to optimize feed conversion ratios and accelerate animal growth. Similarly, "Deworming Health Care" plays a critical role in maintaining herd and flock health, thus contributing to market value. Regionally, Asia Pacific is emerging as a key growth engine, propelled by rapid industrialization in animal agriculture in countries like China and India, coupled with increasing disposable incomes that drive demand for animal-based food products. North America and Europe, with their established animal health industries and stringent regulations promoting responsible animal farming, also represent significant market shares. Emerging economies in South America and the Middle East & Africa are anticipated to present lucrative opportunities due to expanding livestock populations and increasing investments in animal health solutions.
Veterinary Non Nutritional Additives Company Market Share
Veterinary Non Nutritional Additives Market Dynamics & Structure
The global veterinary non-nutritional additives market exhibits a dynamic and evolving landscape driven by a complex interplay of factors. Market concentration is moderately fragmented, with a few large global players like Zoetis, Cargill, Archer Daniels Midland, Purina Animal Nutrition, Adisseo France, Alltech, and DSM holding significant stakes, while a substantial number of regional and specialized manufacturers contribute to the competitive intensity. Technological innovation is a primary driver, with ongoing research and development focused on novel formulations for enhanced efficacy in growth promotion, disease prevention, and overall animal well-being. Regulatory frameworks, though varying by region, are increasingly emphasizing animal welfare and food safety, indirectly influencing the demand for scientifically validated non-nutritional additives. Competitive product substitutes, such as antibiotics and traditional feed ingredients, pose a challenge, but the growing awareness of antimicrobial resistance and the demand for natural or cleaner alternatives are creating new avenues for non-nutritional additives. End-user demographics are shifting towards larger, more consolidated farming operations in developed nations and a growing middle class in emerging economies demanding higher quality animal protein, thus fueling demand for advanced animal husbandry practices supported by these additives. Mergers and acquisitions (M&A) trends are on the rise as key players seek to expand their product portfolios, geographical reach, and technological capabilities. For instance, recent M&A activities have focused on acquiring specialized additive technologies and expanding into high-growth emerging markets. Barriers to innovation include the stringent regulatory approval processes for new additives and the high cost associated with extensive efficacy and safety testing.
- Market Concentration: Moderately fragmented with key global players and numerous regional manufacturers.
- Technological Innovation: Driven by R&D in novel formulations for growth promotion, disease prevention, and animal welfare.
- Regulatory Frameworks: Increasingly focused on animal welfare and food safety, impacting additive demand.
- Competitive Landscape: Substitutes include antibiotics and traditional feed ingredients, with a growing demand for cleaner alternatives.
- End-User Demographics: Shift towards consolidated farming and rising demand for quality animal protein.
- M&A Trends: Increasing consolidation for portfolio expansion and market reach.
- Innovation Barriers: Stringent regulatory approvals and high R&D costs.
Veterinary Non Nutritional Additives Growth Trends & Insights
The veterinary non-nutritional additives market is poised for robust growth, projected to reach an estimated USD XXX million in 2025 and expand at a significant Compound Annual Growth Rate (CAGR) of approximately XX% during the forecast period of 2025–2033. This expansion is underpinned by a confluence of evolving industry dynamics and shifting consumer preferences. Historically, from 2019 to 2024, the market witnessed steady growth, driven by increased global meat and dairy consumption and a growing awareness among livestock producers about improving animal health and productivity. The base year of 2025 serves as a critical juncture, with projected market size of USD XXX million, setting the stage for accelerated growth in the subsequent years. Adoption rates for advanced veterinary non-nutritional additives are steadily increasing as producers recognize their potential to mitigate the impact of antibiotic reduction strategies and enhance the cost-effectiveness of animal farming. Technological disruptions are playing a pivotal role, with advancements in encapsulation technologies, probiotic and prebiotic development, and immune-modulating compounds leading to more targeted and effective additive solutions. For instance, the development of precision fermentation techniques is enabling the production of highly specific functional ingredients that can address nuanced animal health challenges. Consumer behavior shifts are also profoundly impacting the market; growing consumer demand for antibiotic-free meat and dairy products is a major catalyst, pushing producers to seek viable alternatives like effective non-nutritional additives to maintain herd health and productivity. Furthermore, the increasing focus on sustainability in animal agriculture is driving demand for additives that can improve feed conversion ratios, reduce environmental impact, and enhance the overall efficiency of livestock production. The market penetration of specialized additives, particularly in poultry and aquaculture segments, is expected to rise significantly as their benefits become more widely understood and proven. The global market size evolution is a testament to the increasing recognition of these additives not just as supplements but as essential components of modern, efficient, and sustainable animal husbandry.
Dominant Regions, Countries, or Segments in Veterinary Non Nutritional Additives
The global veterinary non-nutritional additives market is significantly influenced by regional dynamics, with certain segments exhibiting exceptional growth potential. Poultry stands out as the dominant application segment, accounting for an estimated XX% of the market share in the base year 2025. This dominance is attributed to the sheer volume of global poultry production, the rapid growth of the industry driven by high protein demand, and the effectiveness of non-nutritional additives in improving feed conversion ratios, reducing mortality rates, and enhancing immune responses in fast-growing broiler chickens and egg-laying hens. Within the poultry segment, Growth Promoting additives are particularly impactful, contributing an estimated XX% of the total application revenue.
Key Drivers for Poultry Dominance:
- High Global Demand for Poultry Protein: Poultry remains a cost-effective and widely consumed protein source globally.
- Rapid Growth Cycles: Shorter production cycles in poultry necessitate efficient growth promotion and disease prevention.
- Effectiveness of Additives: Non-nutritional additives have proven efficacy in improving feed efficiency, reducing disease incidence, and boosting immune health in poultry.
- Antimicrobial Resistance Concerns: The push to reduce antibiotic use in poultry farming directly benefits the demand for alternative growth promoters and health enhancers.
Regionally, Asia Pacific is emerging as the fastest-growing market, projected to capture an estimated XX% market share by 2033. This growth is propelled by a burgeoning population, increasing disposable incomes, and a rising demand for animal protein. Government initiatives promoting animal husbandry modernization and significant investments in livestock infrastructure further bolster the region's dominance. China, India, and Southeast Asian countries are at the forefront of this expansion, with major players like Biostadt India, Zagro, Hipro Animal Nutrtion, Menon Animal, China National Bluestar, Vtr Bio-Tech, Vland Biotech, Jinhe Biotechnology, Guangdong Drive, China Animal Husbandry Industry, Zhejiang Nhu, NB Group, Baolai-Leelai, XJ Bio, and Lida'er Biological actively contributing to market growth through localized product development and distribution networks. The United States and European Union remain mature but significant markets, driven by stringent quality standards and a strong emphasis on animal welfare and sustainable farming practices.
Dominance Factors in Asia Pacific:
- Economic Policies: Supportive government policies encouraging livestock sector growth.
- Infrastructure Development: Investments in modern farming facilities and supply chains.
- Consumer Preferences: Growing demand for higher quality and safer animal protein.
- Technological Adoption: Increasing uptake of advanced animal husbandry techniques.
Veterinary Non Nutritional Additives Product Landscape
The product landscape of veterinary non-nutritional additives is characterized by innovation and diversification, focusing on enhancing animal health, growth, and resilience. Key product categories include probiotics, prebiotics, essential oils, organic acids, enzymes, and immunostimulants. Companies are increasingly developing synergistic blends of these components to deliver comprehensive solutions for specific animal species and production challenges. Performance metrics are increasingly stringent, with a focus on demonstrable improvements in feed conversion, reduced incidence of specific diseases, enhanced gut health, and improved immune responses, particularly in the context of antibiotic reduction programs. Unique selling propositions often revolve around the natural origin of ingredients, the scientific validation of efficacy through rigorous trials, and the development of novel delivery systems that ensure optimal bioavailability and stability within animal feed. Technological advancements, such as advanced fermentation techniques for probiotic production and improved encapsulation methods for essential oils and organic acids, are critical in this evolving market.
Key Drivers, Barriers & Challenges in Veterinary Non Nutritional Additives
Key Drivers:
- Growing Demand for Animal Protein: A rising global population necessitates increased and efficient animal protein production.
- Antimicrobial Resistance (AMR) Concerns: The global push to reduce antibiotic use in animal agriculture directly fuels demand for effective, non-antibiotic alternatives.
- Increased Focus on Animal Welfare: Producers are investing in solutions to improve animal health, comfort, and longevity.
- Technological Advancements: Innovations in probiotics, prebiotics, phytogenics, and other functional ingredients offer enhanced efficacy.
- Government Support and Regulations: Favorable policies promoting sustainable animal husbandry and stricter regulations on antibiotic use.
Key Barriers & Challenges:
- Stringent Regulatory Approvals: Navigating complex and time-consuming approval processes for new additives can be a significant hurdle.
- Cost of Development and Implementation: High research and development costs, coupled with potential higher initial costs for specialized additives, can deter adoption.
- Consumer Perception and Awareness: Educating consumers and stakeholders about the benefits and safety of non-nutritional additives is crucial.
- Supply Chain Volatility: Ensuring consistent quality and availability of raw materials for additive production can be challenging.
- Resistance to Change: Traditional farming practices and reluctance to adopt new technologies can slow market penetration.
- Competition from Established Products: Overcoming the entrenched use of conventional feed additives and practices requires robust scientific backing and clear value proposition.
Emerging Opportunities in Veterinary Non Nutritional Additives
Emerging opportunities in the veterinary non-nutritional additives market are largely driven by the pursuit of sustainable and welfare-driven animal agriculture. The development of specialized additives targeting specific gut microbiome modulation for improved nutrient absorption and disease resistance presents a significant untapped market. Furthermore, the growing aquaculture sector, with its unique health challenges, offers substantial potential for tailored non-nutritional additive solutions. The increasing consumer demand for transparency and traceability in food production is also creating opportunities for additives that can demonstrably improve animal health and reduce the need for pharmaceuticals. Innovations in novel bioactives derived from plant extracts (phytogenics) and fermentation byproducts are gaining traction, offering natural and effective alternatives to synthetic compounds. The development of cost-effective delivery systems for these additives, ensuring stability and efficacy throughout the feed production and digestion process, is another critical area for future growth.
Growth Accelerators in the Veterinary Non Nutritional Additives Industry
Several key catalysts are accelerating growth in the veterinary non-nutritional additives industry. Technological breakthroughs in areas like precision fermentation for producing highly specific probiotics and prebiotics are enabling the creation of more targeted and potent solutions. Strategic partnerships between additive manufacturers and feed producers are crucial for seamless integration and wider market reach. The ongoing global shift towards antibiotic-free animal production, driven by regulatory pressures and consumer demand, is a primary growth accelerator, creating a significant market gap that non-nutritional additives are poised to fill. Furthermore, market expansion strategies focusing on emerging economies, where the demand for animal protein is rapidly increasing, offer substantial growth potential. Investment in research and development to validate the efficacy and safety of novel additive formulations through rigorous scientific studies is also a critical growth enabler, building trust and driving adoption among livestock producers.
Key Players Shaping the Veterinary Non Nutritional Additives Market
- Zoetis
- Cargill
- Archer Daniels Midland
- Purina Animal Nutrition
- Adisseo France
- Alltech
- DSM
- Biostadt India
- Zagro
- Hipro Animal Nutrtion
- Menon Animal
- China National Bluestar
- Vtr Bio-Tech
- Vland Biotech
- Jinhe Biotechnology
- Guangdong Drive
- China Animal Husbandry Industry
- Zhejiang Nhu
- NB Group
- Baolai-Leelai
- XJ Bio
- Lida'er Biological
Notable Milestones in Veterinary Non Nutritional Additives Sector
- 2019: Increased focus on research and development of novel probiotic strains for enhanced gut health in poultry.
- 2020: Growing market adoption of phytogenic feed additives as natural alternatives to synthetic growth promoters.
- 2021: Significant merger and acquisition activities as larger companies sought to expand their non-nutritional additive portfolios.
- 2022: Accelerated regulatory scrutiny on antibiotic use in animal agriculture across major global markets, boosting demand for alternatives.
- 2023: Advancements in encapsulation technologies leading to more stable and effective delivery of essential oils and organic acids.
- 2024: Emergence of new market entrants focusing on specialized additives for farmed fish and insect farming.
- 2025 (Projected): Continued growth in the adoption of multi-functional additives combining probiotics, prebiotics, and immunomodulators.
In-Depth Veterinary Non Nutritional Additives Market Outlook
The veterinary non-nutritional additives market is set for sustained and accelerated growth, driven by an imperative to produce healthier, more sustainable animal protein. The declining reliance on antibiotics, coupled with a rising global demand for food, positions these additives as indispensable tools for livestock producers. Innovations in areas like gut microbiome manipulation, immune system support, and feed efficiency enhancement will continue to be central to market expansion. Strategic collaborations and a focus on emerging markets will be key for companies to capitalize on the global shift towards enhanced animal welfare and safer food production. The future outlook is characterized by a more sophisticated and scientifically driven approach to animal nutrition, with non-nutritional additives playing a pivotal role in achieving these goals.
Veterinary Non Nutritional Additives Segmentation
-
1. Application
- 1.1. Ruminants
- 1.2. Poultry
- 1.3. Farmed Fish
- 1.4. Others
-
2. Type
- 2.1. Growth Promoting
- 2.2. Deworming Health Care
- 2.3. Others
Veterinary Non Nutritional Additives Segmentation By Geography
-
1. North America
- 1.1. United States
- 1.2. Canada
- 1.3. Mexico
-
2. South America
- 2.1. Brazil
- 2.2. Argentina
- 2.3. Rest of South America
-
3. Europe
- 3.1. United Kingdom
- 3.2. Germany
- 3.3. France
- 3.4. Italy
- 3.5. Spain
- 3.6. Russia
- 3.7. Benelux
- 3.8. Nordics
- 3.9. Rest of Europe
-
4. Middle East & Africa
- 4.1. Turkey
- 4.2. Israel
- 4.3. GCC
- 4.4. North Africa
- 4.5. South Africa
- 4.6. Rest of Middle East & Africa
-
5. Asia Pacific
- 5.1. China
- 5.2. India
- 5.3. Japan
- 5.4. South Korea
- 5.5. ASEAN
- 5.6. Oceania
- 5.7. Rest of Asia Pacific
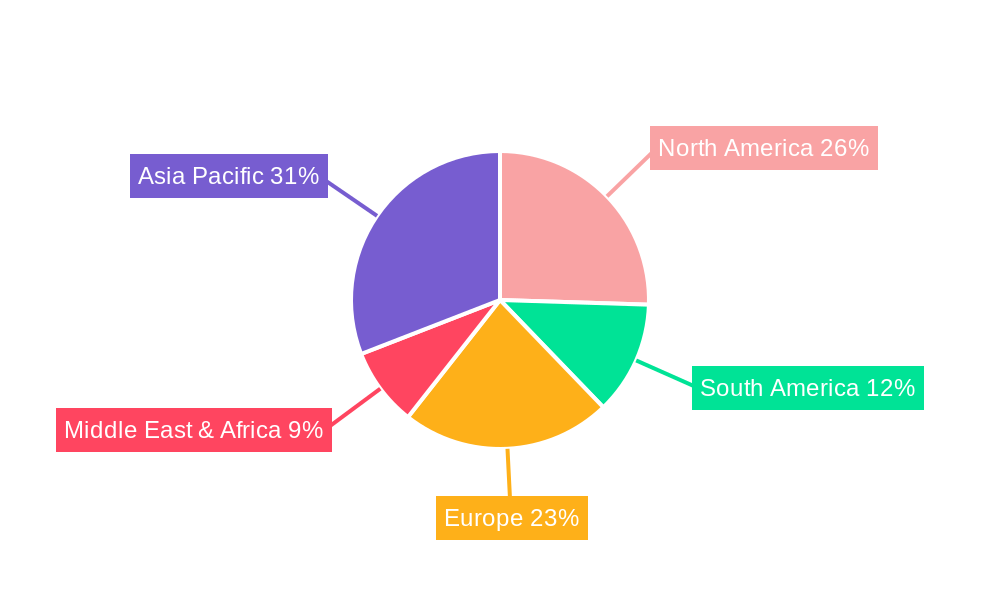
Veterinary Non Nutritional Additives Regional Market Share
Geographic Coverage of Veterinary Non Nutritional Additives
Veterinary Non Nutritional Additives REPORT HIGHLIGHTS
| Aspects | Details |
|---|---|
| Study Period | 2020-2034 |
| Base Year | 2025 |
| Estimated Year | 2026 |
| Forecast Period | 2026-2034 |
| Historical Period | 2020-2025 |
| Growth Rate | CAGR of 6.7% from 2020-2034 |
| Segmentation |
|
Table of Contents
- 1. Introduction
- 1.1. Research Scope
- 1.2. Market Segmentation
- 1.3. Research Methodology
- 1.4. Definitions and Assumptions
- 2. Executive Summary
- 2.1. Introduction
- 3. Market Dynamics
- 3.1. Introduction
- 3.2. Market Drivers
- 3.3. Market Restrains
- 3.4. Market Trends
- 4. Market Factor Analysis
- 4.1. Porters Five Forces
- 4.2. Supply/Value Chain
- 4.3. PESTEL analysis
- 4.4. Market Entropy
- 4.5. Patent/Trademark Analysis
- 5. Global Veterinary Non Nutritional Additives Analysis, Insights and Forecast, 2020-2032
- 5.1. Market Analysis, Insights and Forecast - by Application
- 5.1.1. Ruminants
- 5.1.2. Poultry
- 5.1.3. Farmed Fish
- 5.1.4. Others
- 5.2. Market Analysis, Insights and Forecast - by Type
- 5.2.1. Growth Promoting
- 5.2.2. Deworming Health Care
- 5.2.3. Others
- 5.3. Market Analysis, Insights and Forecast - by Region
- 5.3.1. North America
- 5.3.2. South America
- 5.3.3. Europe
- 5.3.4. Middle East & Africa
- 5.3.5. Asia Pacific
- 5.1. Market Analysis, Insights and Forecast - by Application
- 6. North America Veterinary Non Nutritional Additives Analysis, Insights and Forecast, 2020-2032
- 6.1. Market Analysis, Insights and Forecast - by Application
- 6.1.1. Ruminants
- 6.1.2. Poultry
- 6.1.3. Farmed Fish
- 6.1.4. Others
- 6.2. Market Analysis, Insights and Forecast - by Type
- 6.2.1. Growth Promoting
- 6.2.2. Deworming Health Care
- 6.2.3. Others
- 6.1. Market Analysis, Insights and Forecast - by Application
- 7. South America Veterinary Non Nutritional Additives Analysis, Insights and Forecast, 2020-2032
- 7.1. Market Analysis, Insights and Forecast - by Application
- 7.1.1. Ruminants
- 7.1.2. Poultry
- 7.1.3. Farmed Fish
- 7.1.4. Others
- 7.2. Market Analysis, Insights and Forecast - by Type
- 7.2.1. Growth Promoting
- 7.2.2. Deworming Health Care
- 7.2.3. Others
- 7.1. Market Analysis, Insights and Forecast - by Application
- 8. Europe Veterinary Non Nutritional Additives Analysis, Insights and Forecast, 2020-2032
- 8.1. Market Analysis, Insights and Forecast - by Application
- 8.1.1. Ruminants
- 8.1.2. Poultry
- 8.1.3. Farmed Fish
- 8.1.4. Others
- 8.2. Market Analysis, Insights and Forecast - by Type
- 8.2.1. Growth Promoting
- 8.2.2. Deworming Health Care
- 8.2.3. Others
- 8.1. Market Analysis, Insights and Forecast - by Application
- 9. Middle East & Africa Veterinary Non Nutritional Additives Analysis, Insights and Forecast, 2020-2032
- 9.1. Market Analysis, Insights and Forecast - by Application
- 9.1.1. Ruminants
- 9.1.2. Poultry
- 9.1.3. Farmed Fish
- 9.1.4. Others
- 9.2. Market Analysis, Insights and Forecast - by Type
- 9.2.1. Growth Promoting
- 9.2.2. Deworming Health Care
- 9.2.3. Others
- 9.1. Market Analysis, Insights and Forecast - by Application
- 10. Asia Pacific Veterinary Non Nutritional Additives Analysis, Insights and Forecast, 2020-2032
- 10.1. Market Analysis, Insights and Forecast - by Application
- 10.1.1. Ruminants
- 10.1.2. Poultry
- 10.1.3. Farmed Fish
- 10.1.4. Others
- 10.2. Market Analysis, Insights and Forecast - by Type
- 10.2.1. Growth Promoting
- 10.2.2. Deworming Health Care
- 10.2.3. Others
- 10.1. Market Analysis, Insights and Forecast - by Application
- 11. Competitive Analysis
- 11.1. Global Market Share Analysis 2025
- 11.2. Company Profiles
- 11.2.1 Zoetis
- 11.2.1.1. Overview
- 11.2.1.2. Products
- 11.2.1.3. SWOT Analysis
- 11.2.1.4. Recent Developments
- 11.2.1.5. Financials (Based on Availability)
- 11.2.2 Cargill
- 11.2.2.1. Overview
- 11.2.2.2. Products
- 11.2.2.3. SWOT Analysis
- 11.2.2.4. Recent Developments
- 11.2.2.5. Financials (Based on Availability)
- 11.2.3 Archer Daniels Midland
- 11.2.3.1. Overview
- 11.2.3.2. Products
- 11.2.3.3. SWOT Analysis
- 11.2.3.4. Recent Developments
- 11.2.3.5. Financials (Based on Availability)
- 11.2.4 Purina Animal Nutrition
- 11.2.4.1. Overview
- 11.2.4.2. Products
- 11.2.4.3. SWOT Analysis
- 11.2.4.4. Recent Developments
- 11.2.4.5. Financials (Based on Availability)
- 11.2.5 Adisseo France
- 11.2.5.1. Overview
- 11.2.5.2. Products
- 11.2.5.3. SWOT Analysis
- 11.2.5.4. Recent Developments
- 11.2.5.5. Financials (Based on Availability)
- 11.2.6 Alltech
- 11.2.6.1. Overview
- 11.2.6.2. Products
- 11.2.6.3. SWOT Analysis
- 11.2.6.4. Recent Developments
- 11.2.6.5. Financials (Based on Availability)
- 11.2.7 DSM
- 11.2.7.1. Overview
- 11.2.7.2. Products
- 11.2.7.3. SWOT Analysis
- 11.2.7.4. Recent Developments
- 11.2.7.5. Financials (Based on Availability)
- 11.2.8 Biostadt India
- 11.2.8.1. Overview
- 11.2.8.2. Products
- 11.2.8.3. SWOT Analysis
- 11.2.8.4. Recent Developments
- 11.2.8.5. Financials (Based on Availability)
- 11.2.9 Zagro
- 11.2.9.1. Overview
- 11.2.9.2. Products
- 11.2.9.3. SWOT Analysis
- 11.2.9.4. Recent Developments
- 11.2.9.5. Financials (Based on Availability)
- 11.2.10 Hipro Animal Nutrtion
- 11.2.10.1. Overview
- 11.2.10.2. Products
- 11.2.10.3. SWOT Analysis
- 11.2.10.4. Recent Developments
- 11.2.10.5. Financials (Based on Availability)
- 11.2.11 Menon Animal
- 11.2.11.1. Overview
- 11.2.11.2. Products
- 11.2.11.3. SWOT Analysis
- 11.2.11.4. Recent Developments
- 11.2.11.5. Financials (Based on Availability)
- 11.2.12 China National Bluestar
- 11.2.12.1. Overview
- 11.2.12.2. Products
- 11.2.12.3. SWOT Analysis
- 11.2.12.4. Recent Developments
- 11.2.12.5. Financials (Based on Availability)
- 11.2.13 Vtr Bio-Tech
- 11.2.13.1. Overview
- 11.2.13.2. Products
- 11.2.13.3. SWOT Analysis
- 11.2.13.4. Recent Developments
- 11.2.13.5. Financials (Based on Availability)
- 11.2.14 Vland Biotech
- 11.2.14.1. Overview
- 11.2.14.2. Products
- 11.2.14.3. SWOT Analysis
- 11.2.14.4. Recent Developments
- 11.2.14.5. Financials (Based on Availability)
- 11.2.15 Jinhe Biotechnology
- 11.2.15.1. Overview
- 11.2.15.2. Products
- 11.2.15.3. SWOT Analysis
- 11.2.15.4. Recent Developments
- 11.2.15.5. Financials (Based on Availability)
- 11.2.16 Guangdong Drive
- 11.2.16.1. Overview
- 11.2.16.2. Products
- 11.2.16.3. SWOT Analysis
- 11.2.16.4. Recent Developments
- 11.2.16.5. Financials (Based on Availability)
- 11.2.17 China Animal Husbandry Industry
- 11.2.17.1. Overview
- 11.2.17.2. Products
- 11.2.17.3. SWOT Analysis
- 11.2.17.4. Recent Developments
- 11.2.17.5. Financials (Based on Availability)
- 11.2.18 Zhejiang Nhu
- 11.2.18.1. Overview
- 11.2.18.2. Products
- 11.2.18.3. SWOT Analysis
- 11.2.18.4. Recent Developments
- 11.2.18.5. Financials (Based on Availability)
- 11.2.19 NB Group
- 11.2.19.1. Overview
- 11.2.19.2. Products
- 11.2.19.3. SWOT Analysis
- 11.2.19.4. Recent Developments
- 11.2.19.5. Financials (Based on Availability)
- 11.2.20 Baolai-Leelai
- 11.2.20.1. Overview
- 11.2.20.2. Products
- 11.2.20.3. SWOT Analysis
- 11.2.20.4. Recent Developments
- 11.2.20.5. Financials (Based on Availability)
- 11.2.21 XJ Bio
- 11.2.21.1. Overview
- 11.2.21.2. Products
- 11.2.21.3. SWOT Analysis
- 11.2.21.4. Recent Developments
- 11.2.21.5. Financials (Based on Availability)
- 11.2.22 Lida'er Biological
- 11.2.22.1. Overview
- 11.2.22.2. Products
- 11.2.22.3. SWOT Analysis
- 11.2.22.4. Recent Developments
- 11.2.22.5. Financials (Based on Availability)
- 11.2.1 Zoetis
List of Figures
- Figure 1: Global Veterinary Non Nutritional Additives Revenue Breakdown (million, %) by Region 2025 & 2033
- Figure 2: North America Veterinary Non Nutritional Additives Revenue (million), by Application 2025 & 2033
- Figure 3: North America Veterinary Non Nutritional Additives Revenue Share (%), by Application 2025 & 2033
- Figure 4: North America Veterinary Non Nutritional Additives Revenue (million), by Type 2025 & 2033
- Figure 5: North America Veterinary Non Nutritional Additives Revenue Share (%), by Type 2025 & 2033
- Figure 6: North America Veterinary Non Nutritional Additives Revenue (million), by Country 2025 & 2033
- Figure 7: North America Veterinary Non Nutritional Additives Revenue Share (%), by Country 2025 & 2033
- Figure 8: South America Veterinary Non Nutritional Additives Revenue (million), by Application 2025 & 2033
- Figure 9: South America Veterinary Non Nutritional Additives Revenue Share (%), by Application 2025 & 2033
- Figure 10: South America Veterinary Non Nutritional Additives Revenue (million), by Type 2025 & 2033
- Figure 11: South America Veterinary Non Nutritional Additives Revenue Share (%), by Type 2025 & 2033
- Figure 12: South America Veterinary Non Nutritional Additives Revenue (million), by Country 2025 & 2033
- Figure 13: South America Veterinary Non Nutritional Additives Revenue Share (%), by Country 2025 & 2033
- Figure 14: Europe Veterinary Non Nutritional Additives Revenue (million), by Application 2025 & 2033
- Figure 15: Europe Veterinary Non Nutritional Additives Revenue Share (%), by Application 2025 & 2033
- Figure 16: Europe Veterinary Non Nutritional Additives Revenue (million), by Type 2025 & 2033
- Figure 17: Europe Veterinary Non Nutritional Additives Revenue Share (%), by Type 2025 & 2033
- Figure 18: Europe Veterinary Non Nutritional Additives Revenue (million), by Country 2025 & 2033
- Figure 19: Europe Veterinary Non Nutritional Additives Revenue Share (%), by Country 2025 & 2033
- Figure 20: Middle East & Africa Veterinary Non Nutritional Additives Revenue (million), by Application 2025 & 2033
- Figure 21: Middle East & Africa Veterinary Non Nutritional Additives Revenue Share (%), by Application 2025 & 2033
- Figure 22: Middle East & Africa Veterinary Non Nutritional Additives Revenue (million), by Type 2025 & 2033
- Figure 23: Middle East & Africa Veterinary Non Nutritional Additives Revenue Share (%), by Type 2025 & 2033
- Figure 24: Middle East & Africa Veterinary Non Nutritional Additives Revenue (million), by Country 2025 & 2033
- Figure 25: Middle East & Africa Veterinary Non Nutritional Additives Revenue Share (%), by Country 2025 & 2033
- Figure 26: Asia Pacific Veterinary Non Nutritional Additives Revenue (million), by Application 2025 & 2033
- Figure 27: Asia Pacific Veterinary Non Nutritional Additives Revenue Share (%), by Application 2025 & 2033
- Figure 28: Asia Pacific Veterinary Non Nutritional Additives Revenue (million), by Type 2025 & 2033
- Figure 29: Asia Pacific Veterinary Non Nutritional Additives Revenue Share (%), by Type 2025 & 2033
- Figure 30: Asia Pacific Veterinary Non Nutritional Additives Revenue (million), by Country 2025 & 2033
- Figure 31: Asia Pacific Veterinary Non Nutritional Additives Revenue Share (%), by Country 2025 & 2033
List of Tables
- Table 1: Global Veterinary Non Nutritional Additives Revenue million Forecast, by Application 2020 & 2033
- Table 2: Global Veterinary Non Nutritional Additives Revenue million Forecast, by Type 2020 & 2033
- Table 3: Global Veterinary Non Nutritional Additives Revenue million Forecast, by Region 2020 & 2033
- Table 4: Global Veterinary Non Nutritional Additives Revenue million Forecast, by Application 2020 & 2033
- Table 5: Global Veterinary Non Nutritional Additives Revenue million Forecast, by Type 2020 & 2033
- Table 6: Global Veterinary Non Nutritional Additives Revenue million Forecast, by Country 2020 & 2033
- Table 7: United States Veterinary Non Nutritional Additives Revenue (million) Forecast, by Application 2020 & 2033
- Table 8: Canada Veterinary Non Nutritional Additives Revenue (million) Forecast, by Application 2020 & 2033
- Table 9: Mexico Veterinary Non Nutritional Additives Revenue (million) Forecast, by Application 2020 & 2033
- Table 10: Global Veterinary Non Nutritional Additives Revenue million Forecast, by Application 2020 & 2033
- Table 11: Global Veterinary Non Nutritional Additives Revenue million Forecast, by Type 2020 & 2033
- Table 12: Global Veterinary Non Nutritional Additives Revenue million Forecast, by Country 2020 & 2033
- Table 13: Brazil Veterinary Non Nutritional Additives Revenue (million) Forecast, by Application 2020 & 2033
- Table 14: Argentina Veterinary Non Nutritional Additives Revenue (million) Forecast, by Application 2020 & 2033
- Table 15: Rest of South America Veterinary Non Nutritional Additives Revenue (million) Forecast, by Application 2020 & 2033
- Table 16: Global Veterinary Non Nutritional Additives Revenue million Forecast, by Application 2020 & 2033
- Table 17: Global Veterinary Non Nutritional Additives Revenue million Forecast, by Type 2020 & 2033
- Table 18: Global Veterinary Non Nutritional Additives Revenue million Forecast, by Country 2020 & 2033
- Table 19: United Kingdom Veterinary Non Nutritional Additives Revenue (million) Forecast, by Application 2020 & 2033
- Table 20: Germany Veterinary Non Nutritional Additives Revenue (million) Forecast, by Application 2020 & 2033
- Table 21: France Veterinary Non Nutritional Additives Revenue (million) Forecast, by Application 2020 & 2033
- Table 22: Italy Veterinary Non Nutritional Additives Revenue (million) Forecast, by Application 2020 & 2033
- Table 23: Spain Veterinary Non Nutritional Additives Revenue (million) Forecast, by Application 2020 & 2033
- Table 24: Russia Veterinary Non Nutritional Additives Revenue (million) Forecast, by Application 2020 & 2033
- Table 25: Benelux Veterinary Non Nutritional Additives Revenue (million) Forecast, by Application 2020 & 2033
- Table 26: Nordics Veterinary Non Nutritional Additives Revenue (million) Forecast, by Application 2020 & 2033
- Table 27: Rest of Europe Veterinary Non Nutritional Additives Revenue (million) Forecast, by Application 2020 & 2033
- Table 28: Global Veterinary Non Nutritional Additives Revenue million Forecast, by Application 2020 & 2033
- Table 29: Global Veterinary Non Nutritional Additives Revenue million Forecast, by Type 2020 & 2033
- Table 30: Global Veterinary Non Nutritional Additives Revenue million Forecast, by Country 2020 & 2033
- Table 31: Turkey Veterinary Non Nutritional Additives Revenue (million) Forecast, by Application 2020 & 2033
- Table 32: Israel Veterinary Non Nutritional Additives Revenue (million) Forecast, by Application 2020 & 2033
- Table 33: GCC Veterinary Non Nutritional Additives Revenue (million) Forecast, by Application 2020 & 2033
- Table 34: North Africa Veterinary Non Nutritional Additives Revenue (million) Forecast, by Application 2020 & 2033
- Table 35: South Africa Veterinary Non Nutritional Additives Revenue (million) Forecast, by Application 2020 & 2033
- Table 36: Rest of Middle East & Africa Veterinary Non Nutritional Additives Revenue (million) Forecast, by Application 2020 & 2033
- Table 37: Global Veterinary Non Nutritional Additives Revenue million Forecast, by Application 2020 & 2033
- Table 38: Global Veterinary Non Nutritional Additives Revenue million Forecast, by Type 2020 & 2033
- Table 39: Global Veterinary Non Nutritional Additives Revenue million Forecast, by Country 2020 & 2033
- Table 40: China Veterinary Non Nutritional Additives Revenue (million) Forecast, by Application 2020 & 2033
- Table 41: India Veterinary Non Nutritional Additives Revenue (million) Forecast, by Application 2020 & 2033
- Table 42: Japan Veterinary Non Nutritional Additives Revenue (million) Forecast, by Application 2020 & 2033
- Table 43: South Korea Veterinary Non Nutritional Additives Revenue (million) Forecast, by Application 2020 & 2033
- Table 44: ASEAN Veterinary Non Nutritional Additives Revenue (million) Forecast, by Application 2020 & 2033
- Table 45: Oceania Veterinary Non Nutritional Additives Revenue (million) Forecast, by Application 2020 & 2033
- Table 46: Rest of Asia Pacific Veterinary Non Nutritional Additives Revenue (million) Forecast, by Application 2020 & 2033
Frequently Asked Questions
1. What is the projected Compound Annual Growth Rate (CAGR) of the Veterinary Non Nutritional Additives?
The projected CAGR is approximately 6.7%.
2. Which companies are prominent players in the Veterinary Non Nutritional Additives?
Key companies in the market include Zoetis, Cargill, Archer Daniels Midland, Purina Animal Nutrition, Adisseo France, Alltech, DSM, Biostadt India, Zagro, Hipro Animal Nutrtion, Menon Animal, China National Bluestar, Vtr Bio-Tech, Vland Biotech, Jinhe Biotechnology, Guangdong Drive, China Animal Husbandry Industry, Zhejiang Nhu, NB Group, Baolai-Leelai, XJ Bio, Lida'er Biological.
3. What are the main segments of the Veterinary Non Nutritional Additives?
The market segments include Application, Type.
4. Can you provide details about the market size?
The market size is estimated to be USD 5383 million as of 2022.
5. What are some drivers contributing to market growth?
N/A
6. What are the notable trends driving market growth?
N/A
7. Are there any restraints impacting market growth?
N/A
8. Can you provide examples of recent developments in the market?
N/A
9. What pricing options are available for accessing the report?
Pricing options include single-user, multi-user, and enterprise licenses priced at USD 2900.00, USD 4350.00, and USD 5800.00 respectively.
10. Is the market size provided in terms of value or volume?
The market size is provided in terms of value, measured in million.
11. Are there any specific market keywords associated with the report?
Yes, the market keyword associated with the report is "Veterinary Non Nutritional Additives," which aids in identifying and referencing the specific market segment covered.
12. How do I determine which pricing option suits my needs best?
The pricing options vary based on user requirements and access needs. Individual users may opt for single-user licenses, while businesses requiring broader access may choose multi-user or enterprise licenses for cost-effective access to the report.
13. Are there any additional resources or data provided in the Veterinary Non Nutritional Additives report?
While the report offers comprehensive insights, it's advisable to review the specific contents or supplementary materials provided to ascertain if additional resources or data are available.
14. How can I stay updated on further developments or reports in the Veterinary Non Nutritional Additives?
To stay informed about further developments, trends, and reports in the Veterinary Non Nutritional Additives, consider subscribing to industry newsletters, following relevant companies and organizations, or regularly checking reputable industry news sources and publications.
Methodology
Step 1 - Identification of Relevant Samples Size from Population Database


Step 2 - Approaches for Defining Global Market Size (Value, Volume* & Price*)

Note*: In applicable scenarios
Step 3 - Data Sources
Primary Research
- Web Analytics
- Survey Reports
- Research Institute
- Latest Research Reports
- Opinion Leaders
Secondary Research
- Annual Reports
- White Paper
- Latest Press Release
- Industry Association
- Paid Database
- Investor Presentations

Step 4 - Data Triangulation
Involves using different sources of information in order to increase the validity of a study
These sources are likely to be stakeholders in a program - participants, other researchers, program staff, other community members, and so on.
Then we put all data in single framework & apply various statistical tools to find out the dynamic on the market.
During the analysis stage, feedback from the stakeholder groups would be compared to determine areas of agreement as well as areas of divergence