

Key Insights
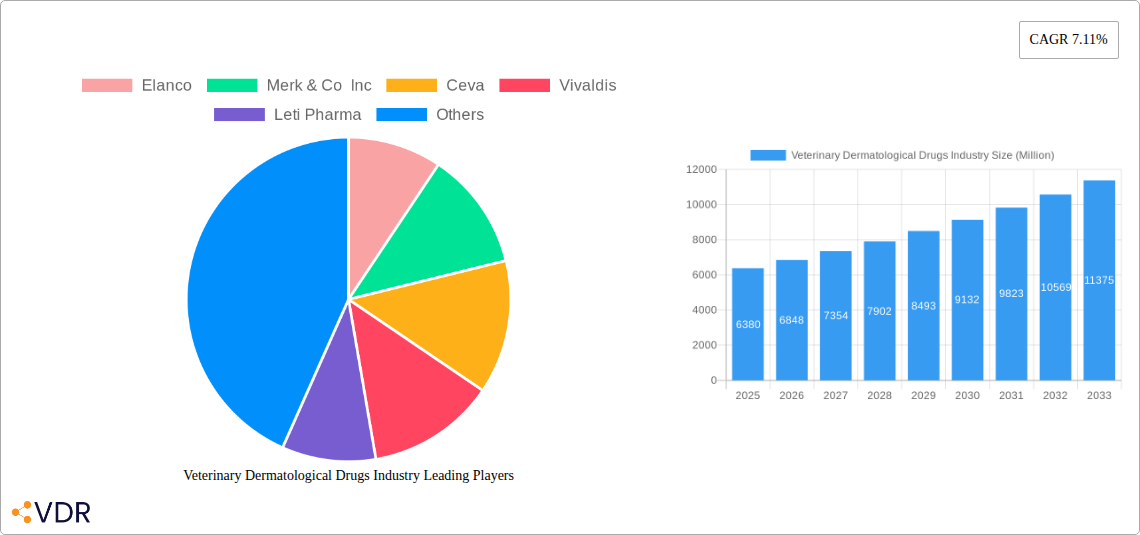
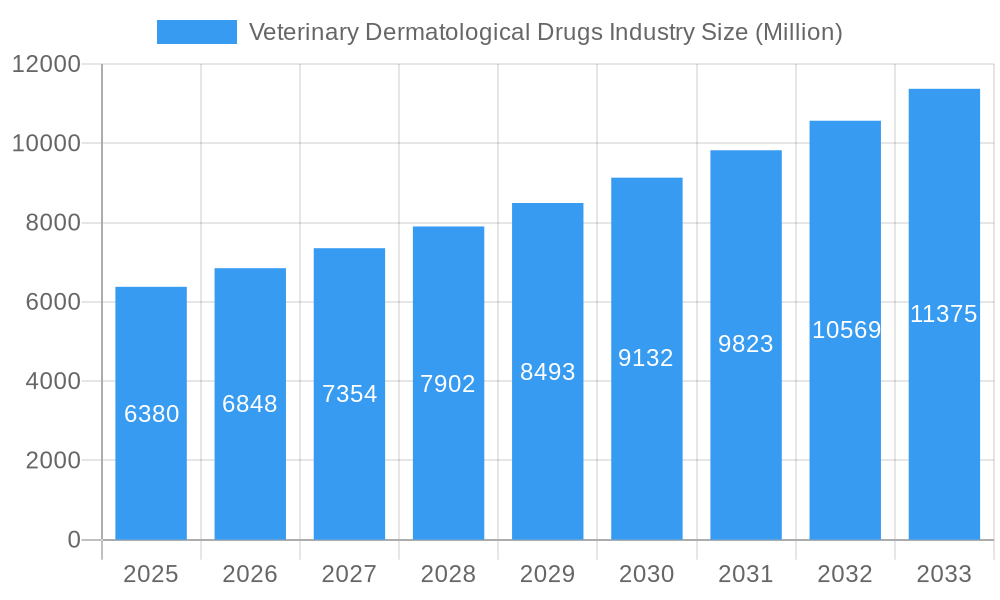
The global veterinary dermatological drugs market, valued at $6.38 billion in 2025, is projected to experience robust growth, driven by rising pet ownership, increasing awareness of animal health, and advancements in drug development. The market's Compound Annual Growth Rate (CAGR) of 7.11% from 2019 to 2024 suggests a continued upward trajectory through 2033. Key growth drivers include the increasing prevalence of skin conditions in companion animals (dogs and cats) such as allergies, bacterial infections, and fungal infections, leading to higher demand for effective treatments. The retail distribution channel currently dominates the market, reflecting the ease of access for pet owners. However, the e-commerce segment is witnessing significant expansion, fueled by the growing online pet product market and increased convenience. Topical applications remain the most widely used route of administration, but the injectable and oral segments are expected to witness growth due to the efficacy of certain treatments. While the companion animal segment holds the largest market share, the livestock animal segment is expected to see moderate growth due to increasing focus on animal welfare and productivity in agricultural practices. Geographical expansion is also anticipated, with North America and Europe currently leading the market, followed by the Asia-Pacific region showcasing high growth potential. Competitive forces are shaped by established pharmaceutical giants like Zoetis and Elanco, as well as smaller specialized companies, fostering innovation and competition in the market.
Veterinary Dermatological Drugs Industry Market Size (In Billion)
Despite this positive outlook, the market faces certain restraints. High treatment costs for advanced dermatological therapies may limit accessibility for some pet owners, particularly in developing economies. Regulatory hurdles and stringent approvals for new drug launches can also present challenges for companies. Moreover, the development of drug resistance necessitates ongoing research and development of novel therapeutic approaches. The market's future success hinges on addressing these challenges through developing affordable and effective treatments, expanding access to veterinary dermatological care, and fostering collaboration among stakeholders across the value chain. This includes educating pet owners and veterinary professionals about the importance of early diagnosis and treatment, thereby significantly impacting the market growth and ensuring improved animal health outcomes.
Veterinary Dermatological Drugs Industry Company Market Share
Veterinary Dermatological Drugs Market Report: 2019-2033
This comprehensive report provides a detailed analysis of the veterinary dermatological drugs market, encompassing market size, growth trends, competitive landscape, and future outlook. The study period covers 2019-2033, with 2025 as the base and estimated year. The report segments the market by animal type (companion animals and livestock animals), distribution channel (retail, hospital pharmacies, e-commerce), route of administration (topical, injectable, oral), and indication (parasitic infections, allergic infections, other indications). Key players analyzed include Elanco, Merk & Co Inc, Ceva, Vivaldis, Leti Pharma, Mars Incorporated, Indian Immunologicals Ltd, Bimeda Inc, Virbac, Bioiberica S A U, and Zoetis Inc. The report is essential for industry professionals, investors, and stakeholders seeking to understand and capitalize on opportunities within this dynamic market.
Veterinary Dermatological Drugs Industry Market Dynamics & Structure
The veterinary dermatological drugs market is characterized by moderate concentration, with a few major players holding significant market share. Technological innovation, particularly in targeted drug delivery systems and novel active ingredients, is a key driver. Stringent regulatory frameworks, including FDA and EMA approvals, impact market entry and product lifecycle. Competitive pressures arise from generic drug manufacturers and the development of alternative treatment modalities. The market is largely driven by the increasing pet ownership globally and rising awareness of animal health, particularly among companion animal owners. M&A activity within the sector is moderate; xx deals were recorded between 2019 and 2024, representing an average of xx deals annually. The increase in companion animal ownership in developing countries is expected to boost demand for veterinary dermatological drugs during the forecast period.
- Market Concentration: Moderately concentrated, with top 5 players holding xx% market share in 2024.
- Technological Innovation: Focus on targeted drug delivery (e.g., topical microemulsions), novel formulations, and improved efficacy.
- Regulatory Framework: Stringent approval processes in major markets impact time to market and cost.
- Competitive Substitutes: Alternative therapies (e.g., herbal remedies) pose a competitive challenge.
- End-User Demographics: Growing pet ownership, particularly in emerging economies, is a key driver.
- M&A Trends: Moderate activity, with a focus on expanding product portfolios and geographical reach.
Veterinary Dermatological Drugs Industry Growth Trends & Insights
The veterinary dermatological drugs market experienced a CAGR of xx% during the historical period (2019-2024), reaching a market size of xx million units in 2024. This growth is attributed to several factors, including the increasing prevalence of dermatological conditions in animals, rising veterinary care expenditure, and the introduction of innovative products. The market is expected to continue its expansion, with a projected CAGR of xx% during the forecast period (2025-2033), driven by factors such as increasing pet humanization, rising disposable incomes in developing countries, and technological advancements in drug delivery systems. Market penetration remains relatively low in emerging markets, offering significant growth potential. Consumer behavior shifts toward premium veterinary products further fuel market expansion.
Dominant Regions, Countries, or Segments in Veterinary Dermatological Drugs Industry
North America holds the largest market share in the veterinary dermatological drugs industry, followed by Europe. The dominance of these regions is attributed to high pet ownership rates, well-developed veterinary infrastructure, and increased awareness of animal health. Within the animal segments, companion animals (dogs and cats) represent the largest market segment, owing to higher per-animal expenditure on veterinary care. Topical administration is the most prevalent route of administration. Allergic infections represent the largest indication segment, reflecting the rising prevalence of atopic dermatitis and other allergic skin conditions.
- Key Drivers:
- High pet ownership in North America and Europe.
- Increasing veterinary care expenditure.
- High prevalence of dermatological conditions.
- Favorable regulatory environment.
- Dominant Segments:
- Region: North America and Europe (xx% combined market share in 2024).
- Animal Type: Companion animals (xx% market share in 2024).
- Route of Administration: Topical (xx% market share in 2024).
- Indication: Allergic infections (xx% market share in 2024).
Veterinary Dermatological Drugs Industry Product Landscape
The veterinary dermatological drug market showcases diverse product offerings, including topical creams, ointments, shampoos, sprays, injectable solutions, and oral medications. Innovation centers on improving drug delivery systems for enhanced efficacy and reduced side effects. Novel formulations using nanotechnology, liposomes, and microemulsions are emerging, offering better penetration and targeted drug release. Unique selling propositions focus on efficacy, safety, convenience of use, and broad-spectrum activity.
Key Drivers, Barriers & Challenges in Veterinary Dermatological Drugs Industry
Key Drivers: Rising pet ownership, increasing awareness of animal health and welfare, advancements in drug delivery systems, and increased veterinary care expenditure are key drivers for market growth.
Challenges & Restraints: Stringent regulatory approvals, high research and development costs, and the potential for generic competition pose significant challenges. Supply chain disruptions, especially in the procurement of raw materials, can impact product availability and market stability. The xx% increase in raw material costs in 2022 impacted profit margins.
Emerging Opportunities in Veterinary Dermatological Drugs Industry
Emerging markets in Asia and Latin America offer significant untapped potential due to increasing pet ownership and rising disposable incomes. Innovation in personalized medicine, leveraging advanced diagnostic tools for precise treatment selection and targeted therapies, represents a key opportunity. E-commerce platforms present an opportunity to enhance access to veterinary dermatological drugs, particularly in remote areas.
Growth Accelerators in the Veterinary Dermatological Drugs Industry
Strategic partnerships between pharmaceutical companies and veterinary clinics can enhance market reach and product distribution. Technological advancements leading to safer, more efficacious formulations will continue to fuel market growth. Expansion into emerging markets, combined with targeted marketing campaigns tailored to specific animal types and indications, will drive sustained growth.
Key Players Shaping the Veterinary Dermatological Drugs Market
- Elanco
- Merk & Co Inc (Merck & Co Inc)
- Ceva
- Vivaldis
- Leti Pharma
- Mars Incorporated (Mars Incorporated)
- Indian Immunologicals Ltd
- Bimeda Inc
- Virbac (Virbac)
- Bioiberica S A U (Bioiberica S A U)
- Zoetis Inc (Zoetis Inc)
Notable Milestones in Veterinary Dermatological Drugs Industry Sector
- June 2023: Zoetis announced FDA approval of Apoquel® Chewable (oclacitinib chewable tablet) for control of pruritus associated with allergic dermatitis and control of atopic dermatitis in dogs. This expanded the market for Apoquel and increased competition in the atopic dermatitis treatment segment.
- April 2023: Bioiberica launched the Atopivet Collar, a novel topical treatment for atopic dermatitis, offering a convenient alternative to oral or topical applications. This new product introduced a novel delivery method into the market.
In-Depth Veterinary Dermatological Drugs Industry Market Outlook
The veterinary dermatological drugs market is poised for sustained growth, driven by technological advancements, increasing pet ownership globally, and a rising awareness of animal health. Strategic partnerships and market expansion into emerging economies will continue to shape the market landscape. The focus on innovative drug delivery systems and personalized medicine will significantly impact market dynamics during the forecast period. The market is expected to reach xx million units by 2033, presenting significant investment opportunities for companies in the sector.
Veterinary Dermatological Drugs Industry Segmentation
-
1. Animal
- 1.1. Companion Animal
- 1.2. Livestock Animal
-
2. Route Of Administration
- 2.1. Topical
- 2.2. Injectable
- 2.3. Oral
-
3. Indication
- 3.1. Parasitic Infections
- 3.2. Allergic Infections
- 3.3. Other Indications
-
4. Distribution Channel
- 4.1. Retail
- 4.2. Hospital Pharmacies
- 4.3. E-commerce
Veterinary Dermatological Drugs Industry Segmentation By Geography
-
1. North America
- 1.1. United States
- 1.2. Canada
- 1.3. Mexico
-
2. Europe
- 2.1. United Kingdom
- 2.2. France
- 2.3. Germany
- 2.4. Italy
- 2.5. Spain
- 2.6. Rest of Europe
-
3. Asia Pacific
- 3.1. India
- 3.2. China
- 3.3. Japan
- 3.4. Australia
- 3.5. South Korea
- 3.6. Rest of Asia Pacific
-
4. Middle East and Africa
- 4.1. GCC
- 4.2. South Africa
- 4.3. Rest of Middle East and Africa
-
5. South America
- 5.1. Brazil
- 5.2. Argentina
- 5.3. Rest of South America
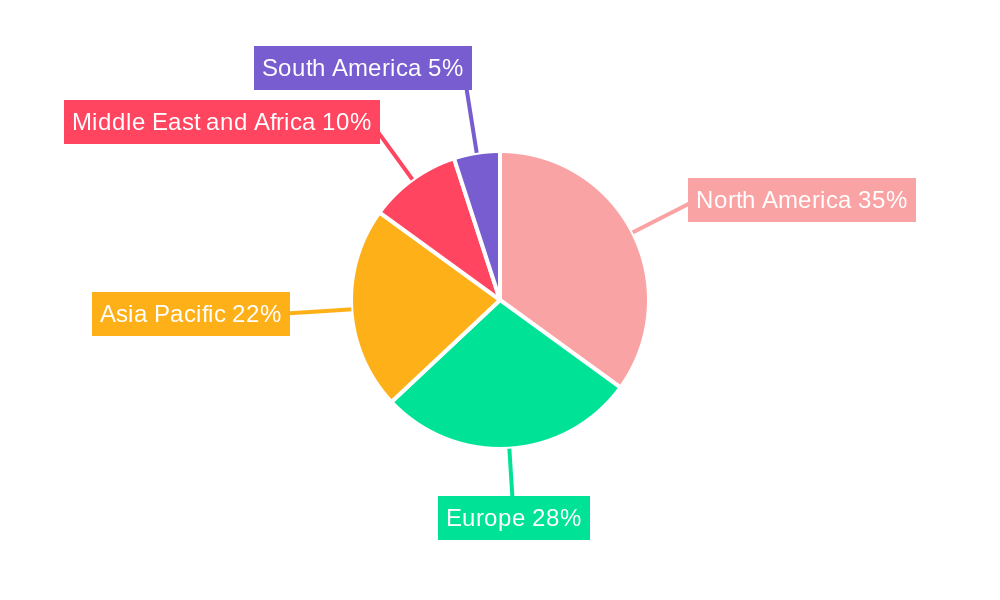
Veterinary Dermatological Drugs Industry Regional Market Share
Geographic Coverage of Veterinary Dermatological Drugs Industry
Veterinary Dermatological Drugs Industry REPORT HIGHLIGHTS
| Aspects | Details |
|---|---|
| Study Period | 2020-2034 |
| Base Year | 2025 |
| Estimated Year | 2026 |
| Forecast Period | 2026-2034 |
| Historical Period | 2020-2025 |
| Growth Rate | CAGR of 7.11% from 2020-2034 |
| Segmentation |
|
Table of Contents
- 1. Introduction
- 1.1. Research Scope
- 1.2. Market Segmentation
- 1.3. Research Objective
- 1.4. Definitions and Assumptions
- 2. Executive Summary
- 2.1. Market Snapshot
- 3. Market Dynamics
- 3.1. Market Drivers
- 3.2. Market Restrains
- 3.3. Market Trends
- 3.4. Market Opportunities
- 4. Market Factor Analysis
- 4.1. Porters Five Forces
- 4.1.1. Bargaining Power of Suppliers
- 4.1.2. Bargaining Power of Buyers
- 4.1.3. Threat of New Entrants
- 4.1.4. Threat of Substitutes
- 4.1.5. Competitive Rivalry
- 4.2. PESTEL analysis
- 4.3. BCG Analysis
- 4.3.1. Stars (High Growth, High Market Share)
- 4.3.2. Cash Cows (Low Growth, High Market Share)
- 4.3.3. Question Mark (High Growth, Low Market Share)
- 4.3.4. Dogs (Low Growth, Low Market Share)
- 4.4. Ansoff Matrix Analysis
- 4.5. Supply Chain Analysis
- 4.6. Regulatory Landscape
- 4.7. Current Market Potential and Opportunity Assessment (TAM–SAM–SOM Framework)
- 4.8. VDR Analyst Note
- 4.1. Porters Five Forces
- 5. Market Analysis, Insights and Forecast 2021-2033
- 5.1. Market Analysis, Insights and Forecast - by Animal
- 5.1.1. Companion Animal
- 5.1.2. Livestock Animal
- 5.2. Market Analysis, Insights and Forecast - by Route Of Administration
- 5.2.1. Topical
- 5.2.2. Injectable
- 5.2.3. Oral
- 5.3. Market Analysis, Insights and Forecast - by Indication
- 5.3.1. Parasitic Infections
- 5.3.2. Allergic Infections
- 5.3.3. Other Indications
- 5.4. Market Analysis, Insights and Forecast - by Distribution Channel
- 5.4.1. Retail
- 5.4.2. Hospital Pharmacies
- 5.4.3. E-commerce
- 5.5. Market Analysis, Insights and Forecast - by Region
- 5.5.1. North America
- 5.5.2. Europe
- 5.5.3. Asia Pacific
- 5.5.4. Middle East and Africa
- 5.5.5. South America
- 5.1. Market Analysis, Insights and Forecast - by Animal
- 6. Global Veterinary Dermatological Drugs Industry Analysis, Insights and Forecast, 2021-2033
- 6.1. Market Analysis, Insights and Forecast - by Animal
- 6.1.1. Companion Animal
- 6.1.2. Livestock Animal
- 6.2. Market Analysis, Insights and Forecast - by Route Of Administration
- 6.2.1. Topical
- 6.2.2. Injectable
- 6.2.3. Oral
- 6.3. Market Analysis, Insights and Forecast - by Indication
- 6.3.1. Parasitic Infections
- 6.3.2. Allergic Infections
- 6.3.3. Other Indications
- 6.4. Market Analysis, Insights and Forecast - by Distribution Channel
- 6.4.1. Retail
- 6.4.2. Hospital Pharmacies
- 6.4.3. E-commerce
- 6.1. Market Analysis, Insights and Forecast - by Animal
- 7. North America Veterinary Dermatological Drugs Industry Analysis, Insights and Forecast, 2021-2033
- 7.1. Market Analysis, Insights and Forecast - by Animal
- 7.1.1. Companion Animal
- 7.1.2. Livestock Animal
- 7.2. Market Analysis, Insights and Forecast - by Route Of Administration
- 7.2.1. Topical
- 7.2.2. Injectable
- 7.2.3. Oral
- 7.3. Market Analysis, Insights and Forecast - by Indication
- 7.3.1. Parasitic Infections
- 7.3.2. Allergic Infections
- 7.3.3. Other Indications
- 7.4. Market Analysis, Insights and Forecast - by Distribution Channel
- 7.4.1. Retail
- 7.4.2. Hospital Pharmacies
- 7.4.3. E-commerce
- 7.1. Market Analysis, Insights and Forecast - by Animal
- 8. Europe Veterinary Dermatological Drugs Industry Analysis, Insights and Forecast, 2021-2033
- 8.1. Market Analysis, Insights and Forecast - by Animal
- 8.1.1. Companion Animal
- 8.1.2. Livestock Animal
- 8.2. Market Analysis, Insights and Forecast - by Route Of Administration
- 8.2.1. Topical
- 8.2.2. Injectable
- 8.2.3. Oral
- 8.3. Market Analysis, Insights and Forecast - by Indication
- 8.3.1. Parasitic Infections
- 8.3.2. Allergic Infections
- 8.3.3. Other Indications
- 8.4. Market Analysis, Insights and Forecast - by Distribution Channel
- 8.4.1. Retail
- 8.4.2. Hospital Pharmacies
- 8.4.3. E-commerce
- 8.1. Market Analysis, Insights and Forecast - by Animal
- 9. Asia Pacific Veterinary Dermatological Drugs Industry Analysis, Insights and Forecast, 2021-2033
- 9.1. Market Analysis, Insights and Forecast - by Animal
- 9.1.1. Companion Animal
- 9.1.2. Livestock Animal
- 9.2. Market Analysis, Insights and Forecast - by Route Of Administration
- 9.2.1. Topical
- 9.2.2. Injectable
- 9.2.3. Oral
- 9.3. Market Analysis, Insights and Forecast - by Indication
- 9.3.1. Parasitic Infections
- 9.3.2. Allergic Infections
- 9.3.3. Other Indications
- 9.4. Market Analysis, Insights and Forecast - by Distribution Channel
- 9.4.1. Retail
- 9.4.2. Hospital Pharmacies
- 9.4.3. E-commerce
- 9.1. Market Analysis, Insights and Forecast - by Animal
- 10. Middle East and Africa Veterinary Dermatological Drugs Industry Analysis, Insights and Forecast, 2021-2033
- 10.1. Market Analysis, Insights and Forecast - by Animal
- 10.1.1. Companion Animal
- 10.1.2. Livestock Animal
- 10.2. Market Analysis, Insights and Forecast - by Route Of Administration
- 10.2.1. Topical
- 10.2.2. Injectable
- 10.2.3. Oral
- 10.3. Market Analysis, Insights and Forecast - by Indication
- 10.3.1. Parasitic Infections
- 10.3.2. Allergic Infections
- 10.3.3. Other Indications
- 10.4. Market Analysis, Insights and Forecast - by Distribution Channel
- 10.4.1. Retail
- 10.4.2. Hospital Pharmacies
- 10.4.3. E-commerce
- 10.1. Market Analysis, Insights and Forecast - by Animal
- 11. South America Veterinary Dermatological Drugs Industry Analysis, Insights and Forecast, 2021-2033
- 11.1. Market Analysis, Insights and Forecast - by Animal
- 11.1.1. Companion Animal
- 11.1.2. Livestock Animal
- 11.2. Market Analysis, Insights and Forecast - by Route Of Administration
- 11.2.1. Topical
- 11.2.2. Injectable
- 11.2.3. Oral
- 11.3. Market Analysis, Insights and Forecast - by Indication
- 11.3.1. Parasitic Infections
- 11.3.2. Allergic Infections
- 11.3.3. Other Indications
- 11.4. Market Analysis, Insights and Forecast - by Distribution Channel
- 11.4.1. Retail
- 11.4.2. Hospital Pharmacies
- 11.4.3. E-commerce
- 11.1. Market Analysis, Insights and Forecast - by Animal
- 12. Competitive Analysis
- 12.1. Company Profiles
- 12.1.1 Elanco
- 12.1.1.1. Company Overview
- 12.1.1.2. Products
- 12.1.1.3. Company Financials
- 12.1.1.4. SWOT Analysis
- 12.1.2 Merk & Co Inc
- 12.1.2.1. Company Overview
- 12.1.2.2. Products
- 12.1.2.3. Company Financials
- 12.1.2.4. SWOT Analysis
- 12.1.3 Ceva
- 12.1.3.1. Company Overview
- 12.1.3.2. Products
- 12.1.3.3. Company Financials
- 12.1.3.4. SWOT Analysis
- 12.1.4 Vivaldis
- 12.1.4.1. Company Overview
- 12.1.4.2. Products
- 12.1.4.3. Company Financials
- 12.1.4.4. SWOT Analysis
- 12.1.5 Leti Pharma
- 12.1.5.1. Company Overview
- 12.1.5.2. Products
- 12.1.5.3. Company Financials
- 12.1.5.4. SWOT Analysis
- 12.1.6 Mars Incorporated
- 12.1.6.1. Company Overview
- 12.1.6.2. Products
- 12.1.6.3. Company Financials
- 12.1.6.4. SWOT Analysis
- 12.1.7 Indian Immunologicals Ltd
- 12.1.7.1. Company Overview
- 12.1.7.2. Products
- 12.1.7.3. Company Financials
- 12.1.7.4. SWOT Analysis
- 12.1.8 Bimeda Inc
- 12.1.8.1. Company Overview
- 12.1.8.2. Products
- 12.1.8.3. Company Financials
- 12.1.8.4. SWOT Analysis
- 12.1.9 Virbac
- 12.1.9.1. Company Overview
- 12.1.9.2. Products
- 12.1.9.3. Company Financials
- 12.1.9.4. SWOT Analysis
- 12.1.10 Bioiberica S A U
- 12.1.10.1. Company Overview
- 12.1.10.2. Products
- 12.1.10.3. Company Financials
- 12.1.10.4. SWOT Analysis
- 12.1.11 Zoetis Inc
- 12.1.11.1. Company Overview
- 12.1.11.2. Products
- 12.1.11.3. Company Financials
- 12.1.11.4. SWOT Analysis
- 12.1.1 Elanco
- 12.2. Market Entropy
- 12.2.1 Company's Key Areas Served
- 12.2.2 Recent Developments
- 12.3. Company Market Share Analysis 2025
- 12.3.1 Top 5 Companies Market Share Analysis
- 12.3.2 Top 3 Companies Market Share Analysis
- 12.4. List of Potential Customers
- 13. Research Methodology
List of Figures
- Figure 1: Global Veterinary Dermatological Drugs Industry Revenue Breakdown (Million, %) by Region 2025 & 2033
- Figure 2: Global Veterinary Dermatological Drugs Industry Volume Breakdown (Dosage, %) by Region 2025 & 2033
- Figure 3: North America Veterinary Dermatological Drugs Industry Revenue (Million), by Animal 2025 & 2033
- Figure 4: North America Veterinary Dermatological Drugs Industry Volume (Dosage), by Animal 2025 & 2033
- Figure 5: North America Veterinary Dermatological Drugs Industry Revenue Share (%), by Animal 2025 & 2033
- Figure 6: North America Veterinary Dermatological Drugs Industry Volume Share (%), by Animal 2025 & 2033
- Figure 7: North America Veterinary Dermatological Drugs Industry Revenue (Million), by Route Of Administration 2025 & 2033
- Figure 8: North America Veterinary Dermatological Drugs Industry Volume (Dosage), by Route Of Administration 2025 & 2033
- Figure 9: North America Veterinary Dermatological Drugs Industry Revenue Share (%), by Route Of Administration 2025 & 2033
- Figure 10: North America Veterinary Dermatological Drugs Industry Volume Share (%), by Route Of Administration 2025 & 2033
- Figure 11: North America Veterinary Dermatological Drugs Industry Revenue (Million), by Indication 2025 & 2033
- Figure 12: North America Veterinary Dermatological Drugs Industry Volume (Dosage), by Indication 2025 & 2033
- Figure 13: North America Veterinary Dermatological Drugs Industry Revenue Share (%), by Indication 2025 & 2033
- Figure 14: North America Veterinary Dermatological Drugs Industry Volume Share (%), by Indication 2025 & 2033
- Figure 15: North America Veterinary Dermatological Drugs Industry Revenue (Million), by Distribution Channel 2025 & 2033
- Figure 16: North America Veterinary Dermatological Drugs Industry Volume (Dosage), by Distribution Channel 2025 & 2033
- Figure 17: North America Veterinary Dermatological Drugs Industry Revenue Share (%), by Distribution Channel 2025 & 2033
- Figure 18: North America Veterinary Dermatological Drugs Industry Volume Share (%), by Distribution Channel 2025 & 2033
- Figure 19: North America Veterinary Dermatological Drugs Industry Revenue (Million), by Country 2025 & 2033
- Figure 20: North America Veterinary Dermatological Drugs Industry Volume (Dosage), by Country 2025 & 2033
- Figure 21: North America Veterinary Dermatological Drugs Industry Revenue Share (%), by Country 2025 & 2033
- Figure 22: North America Veterinary Dermatological Drugs Industry Volume Share (%), by Country 2025 & 2033
- Figure 23: Europe Veterinary Dermatological Drugs Industry Revenue (Million), by Animal 2025 & 2033
- Figure 24: Europe Veterinary Dermatological Drugs Industry Volume (Dosage), by Animal 2025 & 2033
- Figure 25: Europe Veterinary Dermatological Drugs Industry Revenue Share (%), by Animal 2025 & 2033
- Figure 26: Europe Veterinary Dermatological Drugs Industry Volume Share (%), by Animal 2025 & 2033
- Figure 27: Europe Veterinary Dermatological Drugs Industry Revenue (Million), by Route Of Administration 2025 & 2033
- Figure 28: Europe Veterinary Dermatological Drugs Industry Volume (Dosage), by Route Of Administration 2025 & 2033
- Figure 29: Europe Veterinary Dermatological Drugs Industry Revenue Share (%), by Route Of Administration 2025 & 2033
- Figure 30: Europe Veterinary Dermatological Drugs Industry Volume Share (%), by Route Of Administration 2025 & 2033
- Figure 31: Europe Veterinary Dermatological Drugs Industry Revenue (Million), by Indication 2025 & 2033
- Figure 32: Europe Veterinary Dermatological Drugs Industry Volume (Dosage), by Indication 2025 & 2033
- Figure 33: Europe Veterinary Dermatological Drugs Industry Revenue Share (%), by Indication 2025 & 2033
- Figure 34: Europe Veterinary Dermatological Drugs Industry Volume Share (%), by Indication 2025 & 2033
- Figure 35: Europe Veterinary Dermatological Drugs Industry Revenue (Million), by Distribution Channel 2025 & 2033
- Figure 36: Europe Veterinary Dermatological Drugs Industry Volume (Dosage), by Distribution Channel 2025 & 2033
- Figure 37: Europe Veterinary Dermatological Drugs Industry Revenue Share (%), by Distribution Channel 2025 & 2033
- Figure 38: Europe Veterinary Dermatological Drugs Industry Volume Share (%), by Distribution Channel 2025 & 2033
- Figure 39: Europe Veterinary Dermatological Drugs Industry Revenue (Million), by Country 2025 & 2033
- Figure 40: Europe Veterinary Dermatological Drugs Industry Volume (Dosage), by Country 2025 & 2033
- Figure 41: Europe Veterinary Dermatological Drugs Industry Revenue Share (%), by Country 2025 & 2033
- Figure 42: Europe Veterinary Dermatological Drugs Industry Volume Share (%), by Country 2025 & 2033
- Figure 43: Asia Pacific Veterinary Dermatological Drugs Industry Revenue (Million), by Animal 2025 & 2033
- Figure 44: Asia Pacific Veterinary Dermatological Drugs Industry Volume (Dosage), by Animal 2025 & 2033
- Figure 45: Asia Pacific Veterinary Dermatological Drugs Industry Revenue Share (%), by Animal 2025 & 2033
- Figure 46: Asia Pacific Veterinary Dermatological Drugs Industry Volume Share (%), by Animal 2025 & 2033
- Figure 47: Asia Pacific Veterinary Dermatological Drugs Industry Revenue (Million), by Route Of Administration 2025 & 2033
- Figure 48: Asia Pacific Veterinary Dermatological Drugs Industry Volume (Dosage), by Route Of Administration 2025 & 2033
- Figure 49: Asia Pacific Veterinary Dermatological Drugs Industry Revenue Share (%), by Route Of Administration 2025 & 2033
- Figure 50: Asia Pacific Veterinary Dermatological Drugs Industry Volume Share (%), by Route Of Administration 2025 & 2033
- Figure 51: Asia Pacific Veterinary Dermatological Drugs Industry Revenue (Million), by Indication 2025 & 2033
- Figure 52: Asia Pacific Veterinary Dermatological Drugs Industry Volume (Dosage), by Indication 2025 & 2033
- Figure 53: Asia Pacific Veterinary Dermatological Drugs Industry Revenue Share (%), by Indication 2025 & 2033
- Figure 54: Asia Pacific Veterinary Dermatological Drugs Industry Volume Share (%), by Indication 2025 & 2033
- Figure 55: Asia Pacific Veterinary Dermatological Drugs Industry Revenue (Million), by Distribution Channel 2025 & 2033
- Figure 56: Asia Pacific Veterinary Dermatological Drugs Industry Volume (Dosage), by Distribution Channel 2025 & 2033
- Figure 57: Asia Pacific Veterinary Dermatological Drugs Industry Revenue Share (%), by Distribution Channel 2025 & 2033
- Figure 58: Asia Pacific Veterinary Dermatological Drugs Industry Volume Share (%), by Distribution Channel 2025 & 2033
- Figure 59: Asia Pacific Veterinary Dermatological Drugs Industry Revenue (Million), by Country 2025 & 2033
- Figure 60: Asia Pacific Veterinary Dermatological Drugs Industry Volume (Dosage), by Country 2025 & 2033
- Figure 61: Asia Pacific Veterinary Dermatological Drugs Industry Revenue Share (%), by Country 2025 & 2033
- Figure 62: Asia Pacific Veterinary Dermatological Drugs Industry Volume Share (%), by Country 2025 & 2033
- Figure 63: Middle East and Africa Veterinary Dermatological Drugs Industry Revenue (Million), by Animal 2025 & 2033
- Figure 64: Middle East and Africa Veterinary Dermatological Drugs Industry Volume (Dosage), by Animal 2025 & 2033
- Figure 65: Middle East and Africa Veterinary Dermatological Drugs Industry Revenue Share (%), by Animal 2025 & 2033
- Figure 66: Middle East and Africa Veterinary Dermatological Drugs Industry Volume Share (%), by Animal 2025 & 2033
- Figure 67: Middle East and Africa Veterinary Dermatological Drugs Industry Revenue (Million), by Route Of Administration 2025 & 2033
- Figure 68: Middle East and Africa Veterinary Dermatological Drugs Industry Volume (Dosage), by Route Of Administration 2025 & 2033
- Figure 69: Middle East and Africa Veterinary Dermatological Drugs Industry Revenue Share (%), by Route Of Administration 2025 & 2033
- Figure 70: Middle East and Africa Veterinary Dermatological Drugs Industry Volume Share (%), by Route Of Administration 2025 & 2033
- Figure 71: Middle East and Africa Veterinary Dermatological Drugs Industry Revenue (Million), by Indication 2025 & 2033
- Figure 72: Middle East and Africa Veterinary Dermatological Drugs Industry Volume (Dosage), by Indication 2025 & 2033
- Figure 73: Middle East and Africa Veterinary Dermatological Drugs Industry Revenue Share (%), by Indication 2025 & 2033
- Figure 74: Middle East and Africa Veterinary Dermatological Drugs Industry Volume Share (%), by Indication 2025 & 2033
- Figure 75: Middle East and Africa Veterinary Dermatological Drugs Industry Revenue (Million), by Distribution Channel 2025 & 2033
- Figure 76: Middle East and Africa Veterinary Dermatological Drugs Industry Volume (Dosage), by Distribution Channel 2025 & 2033
- Figure 77: Middle East and Africa Veterinary Dermatological Drugs Industry Revenue Share (%), by Distribution Channel 2025 & 2033
- Figure 78: Middle East and Africa Veterinary Dermatological Drugs Industry Volume Share (%), by Distribution Channel 2025 & 2033
- Figure 79: Middle East and Africa Veterinary Dermatological Drugs Industry Revenue (Million), by Country 2025 & 2033
- Figure 80: Middle East and Africa Veterinary Dermatological Drugs Industry Volume (Dosage), by Country 2025 & 2033
- Figure 81: Middle East and Africa Veterinary Dermatological Drugs Industry Revenue Share (%), by Country 2025 & 2033
- Figure 82: Middle East and Africa Veterinary Dermatological Drugs Industry Volume Share (%), by Country 2025 & 2033
- Figure 83: South America Veterinary Dermatological Drugs Industry Revenue (Million), by Animal 2025 & 2033
- Figure 84: South America Veterinary Dermatological Drugs Industry Volume (Dosage), by Animal 2025 & 2033
- Figure 85: South America Veterinary Dermatological Drugs Industry Revenue Share (%), by Animal 2025 & 2033
- Figure 86: South America Veterinary Dermatological Drugs Industry Volume Share (%), by Animal 2025 & 2033
- Figure 87: South America Veterinary Dermatological Drugs Industry Revenue (Million), by Route Of Administration 2025 & 2033
- Figure 88: South America Veterinary Dermatological Drugs Industry Volume (Dosage), by Route Of Administration 2025 & 2033
- Figure 89: South America Veterinary Dermatological Drugs Industry Revenue Share (%), by Route Of Administration 2025 & 2033
- Figure 90: South America Veterinary Dermatological Drugs Industry Volume Share (%), by Route Of Administration 2025 & 2033
- Figure 91: South America Veterinary Dermatological Drugs Industry Revenue (Million), by Indication 2025 & 2033
- Figure 92: South America Veterinary Dermatological Drugs Industry Volume (Dosage), by Indication 2025 & 2033
- Figure 93: South America Veterinary Dermatological Drugs Industry Revenue Share (%), by Indication 2025 & 2033
- Figure 94: South America Veterinary Dermatological Drugs Industry Volume Share (%), by Indication 2025 & 2033
- Figure 95: South America Veterinary Dermatological Drugs Industry Revenue (Million), by Distribution Channel 2025 & 2033
- Figure 96: South America Veterinary Dermatological Drugs Industry Volume (Dosage), by Distribution Channel 2025 & 2033
- Figure 97: South America Veterinary Dermatological Drugs Industry Revenue Share (%), by Distribution Channel 2025 & 2033
- Figure 98: South America Veterinary Dermatological Drugs Industry Volume Share (%), by Distribution Channel 2025 & 2033
- Figure 99: South America Veterinary Dermatological Drugs Industry Revenue (Million), by Country 2025 & 2033
- Figure 100: South America Veterinary Dermatological Drugs Industry Volume (Dosage), by Country 2025 & 2033
- Figure 101: South America Veterinary Dermatological Drugs Industry Revenue Share (%), by Country 2025 & 2033
- Figure 102: South America Veterinary Dermatological Drugs Industry Volume Share (%), by Country 2025 & 2033
List of Tables
- Table 1: Global Veterinary Dermatological Drugs Industry Revenue Million Forecast, by Animal 2020 & 2033
- Table 2: Global Veterinary Dermatological Drugs Industry Volume Dosage Forecast, by Animal 2020 & 2033
- Table 3: Global Veterinary Dermatological Drugs Industry Revenue Million Forecast, by Route Of Administration 2020 & 2033
- Table 4: Global Veterinary Dermatological Drugs Industry Volume Dosage Forecast, by Route Of Administration 2020 & 2033
- Table 5: Global Veterinary Dermatological Drugs Industry Revenue Million Forecast, by Indication 2020 & 2033
- Table 6: Global Veterinary Dermatological Drugs Industry Volume Dosage Forecast, by Indication 2020 & 2033
- Table 7: Global Veterinary Dermatological Drugs Industry Revenue Million Forecast, by Distribution Channel 2020 & 2033
- Table 8: Global Veterinary Dermatological Drugs Industry Volume Dosage Forecast, by Distribution Channel 2020 & 2033
- Table 9: Global Veterinary Dermatological Drugs Industry Revenue Million Forecast, by Region 2020 & 2033
- Table 10: Global Veterinary Dermatological Drugs Industry Volume Dosage Forecast, by Region 2020 & 2033
- Table 11: Global Veterinary Dermatological Drugs Industry Revenue Million Forecast, by Animal 2020 & 2033
- Table 12: Global Veterinary Dermatological Drugs Industry Volume Dosage Forecast, by Animal 2020 & 2033
- Table 13: Global Veterinary Dermatological Drugs Industry Revenue Million Forecast, by Route Of Administration 2020 & 2033
- Table 14: Global Veterinary Dermatological Drugs Industry Volume Dosage Forecast, by Route Of Administration 2020 & 2033
- Table 15: Global Veterinary Dermatological Drugs Industry Revenue Million Forecast, by Indication 2020 & 2033
- Table 16: Global Veterinary Dermatological Drugs Industry Volume Dosage Forecast, by Indication 2020 & 2033
- Table 17: Global Veterinary Dermatological Drugs Industry Revenue Million Forecast, by Distribution Channel 2020 & 2033
- Table 18: Global Veterinary Dermatological Drugs Industry Volume Dosage Forecast, by Distribution Channel 2020 & 2033
- Table 19: Global Veterinary Dermatological Drugs Industry Revenue Million Forecast, by Country 2020 & 2033
- Table 20: Global Veterinary Dermatological Drugs Industry Volume Dosage Forecast, by Country 2020 & 2033
- Table 21: United States Veterinary Dermatological Drugs Industry Revenue (Million) Forecast, by Application 2020 & 2033
- Table 22: United States Veterinary Dermatological Drugs Industry Volume (Dosage) Forecast, by Application 2020 & 2033
- Table 23: Canada Veterinary Dermatological Drugs Industry Revenue (Million) Forecast, by Application 2020 & 2033
- Table 24: Canada Veterinary Dermatological Drugs Industry Volume (Dosage) Forecast, by Application 2020 & 2033
- Table 25: Mexico Veterinary Dermatological Drugs Industry Revenue (Million) Forecast, by Application 2020 & 2033
- Table 26: Mexico Veterinary Dermatological Drugs Industry Volume (Dosage) Forecast, by Application 2020 & 2033
- Table 27: Global Veterinary Dermatological Drugs Industry Revenue Million Forecast, by Animal 2020 & 2033
- Table 28: Global Veterinary Dermatological Drugs Industry Volume Dosage Forecast, by Animal 2020 & 2033
- Table 29: Global Veterinary Dermatological Drugs Industry Revenue Million Forecast, by Route Of Administration 2020 & 2033
- Table 30: Global Veterinary Dermatological Drugs Industry Volume Dosage Forecast, by Route Of Administration 2020 & 2033
- Table 31: Global Veterinary Dermatological Drugs Industry Revenue Million Forecast, by Indication 2020 & 2033
- Table 32: Global Veterinary Dermatological Drugs Industry Volume Dosage Forecast, by Indication 2020 & 2033
- Table 33: Global Veterinary Dermatological Drugs Industry Revenue Million Forecast, by Distribution Channel 2020 & 2033
- Table 34: Global Veterinary Dermatological Drugs Industry Volume Dosage Forecast, by Distribution Channel 2020 & 2033
- Table 35: Global Veterinary Dermatological Drugs Industry Revenue Million Forecast, by Country 2020 & 2033
- Table 36: Global Veterinary Dermatological Drugs Industry Volume Dosage Forecast, by Country 2020 & 2033
- Table 37: United Kingdom Veterinary Dermatological Drugs Industry Revenue (Million) Forecast, by Application 2020 & 2033
- Table 38: United Kingdom Veterinary Dermatological Drugs Industry Volume (Dosage) Forecast, by Application 2020 & 2033
- Table 39: France Veterinary Dermatological Drugs Industry Revenue (Million) Forecast, by Application 2020 & 2033
- Table 40: France Veterinary Dermatological Drugs Industry Volume (Dosage) Forecast, by Application 2020 & 2033
- Table 41: Germany Veterinary Dermatological Drugs Industry Revenue (Million) Forecast, by Application 2020 & 2033
- Table 42: Germany Veterinary Dermatological Drugs Industry Volume (Dosage) Forecast, by Application 2020 & 2033
- Table 43: Italy Veterinary Dermatological Drugs Industry Revenue (Million) Forecast, by Application 2020 & 2033
- Table 44: Italy Veterinary Dermatological Drugs Industry Volume (Dosage) Forecast, by Application 2020 & 2033
- Table 45: Spain Veterinary Dermatological Drugs Industry Revenue (Million) Forecast, by Application 2020 & 2033
- Table 46: Spain Veterinary Dermatological Drugs Industry Volume (Dosage) Forecast, by Application 2020 & 2033
- Table 47: Rest of Europe Veterinary Dermatological Drugs Industry Revenue (Million) Forecast, by Application 2020 & 2033
- Table 48: Rest of Europe Veterinary Dermatological Drugs Industry Volume (Dosage) Forecast, by Application 2020 & 2033
- Table 49: Global Veterinary Dermatological Drugs Industry Revenue Million Forecast, by Animal 2020 & 2033
- Table 50: Global Veterinary Dermatological Drugs Industry Volume Dosage Forecast, by Animal 2020 & 2033
- Table 51: Global Veterinary Dermatological Drugs Industry Revenue Million Forecast, by Route Of Administration 2020 & 2033
- Table 52: Global Veterinary Dermatological Drugs Industry Volume Dosage Forecast, by Route Of Administration 2020 & 2033
- Table 53: Global Veterinary Dermatological Drugs Industry Revenue Million Forecast, by Indication 2020 & 2033
- Table 54: Global Veterinary Dermatological Drugs Industry Volume Dosage Forecast, by Indication 2020 & 2033
- Table 55: Global Veterinary Dermatological Drugs Industry Revenue Million Forecast, by Distribution Channel 2020 & 2033
- Table 56: Global Veterinary Dermatological Drugs Industry Volume Dosage Forecast, by Distribution Channel 2020 & 2033
- Table 57: Global Veterinary Dermatological Drugs Industry Revenue Million Forecast, by Country 2020 & 2033
- Table 58: Global Veterinary Dermatological Drugs Industry Volume Dosage Forecast, by Country 2020 & 2033
- Table 59: India Veterinary Dermatological Drugs Industry Revenue (Million) Forecast, by Application 2020 & 2033
- Table 60: India Veterinary Dermatological Drugs Industry Volume (Dosage) Forecast, by Application 2020 & 2033
- Table 61: China Veterinary Dermatological Drugs Industry Revenue (Million) Forecast, by Application 2020 & 2033
- Table 62: China Veterinary Dermatological Drugs Industry Volume (Dosage) Forecast, by Application 2020 & 2033
- Table 63: Japan Veterinary Dermatological Drugs Industry Revenue (Million) Forecast, by Application 2020 & 2033
- Table 64: Japan Veterinary Dermatological Drugs Industry Volume (Dosage) Forecast, by Application 2020 & 2033
- Table 65: Australia Veterinary Dermatological Drugs Industry Revenue (Million) Forecast, by Application 2020 & 2033
- Table 66: Australia Veterinary Dermatological Drugs Industry Volume (Dosage) Forecast, by Application 2020 & 2033
- Table 67: South Korea Veterinary Dermatological Drugs Industry Revenue (Million) Forecast, by Application 2020 & 2033
- Table 68: South Korea Veterinary Dermatological Drugs Industry Volume (Dosage) Forecast, by Application 2020 & 2033
- Table 69: Rest of Asia Pacific Veterinary Dermatological Drugs Industry Revenue (Million) Forecast, by Application 2020 & 2033
- Table 70: Rest of Asia Pacific Veterinary Dermatological Drugs Industry Volume (Dosage) Forecast, by Application 2020 & 2033
- Table 71: Global Veterinary Dermatological Drugs Industry Revenue Million Forecast, by Animal 2020 & 2033
- Table 72: Global Veterinary Dermatological Drugs Industry Volume Dosage Forecast, by Animal 2020 & 2033
- Table 73: Global Veterinary Dermatological Drugs Industry Revenue Million Forecast, by Route Of Administration 2020 & 2033
- Table 74: Global Veterinary Dermatological Drugs Industry Volume Dosage Forecast, by Route Of Administration 2020 & 2033
- Table 75: Global Veterinary Dermatological Drugs Industry Revenue Million Forecast, by Indication 2020 & 2033
- Table 76: Global Veterinary Dermatological Drugs Industry Volume Dosage Forecast, by Indication 2020 & 2033
- Table 77: Global Veterinary Dermatological Drugs Industry Revenue Million Forecast, by Distribution Channel 2020 & 2033
- Table 78: Global Veterinary Dermatological Drugs Industry Volume Dosage Forecast, by Distribution Channel 2020 & 2033
- Table 79: Global Veterinary Dermatological Drugs Industry Revenue Million Forecast, by Country 2020 & 2033
- Table 80: Global Veterinary Dermatological Drugs Industry Volume Dosage Forecast, by Country 2020 & 2033
- Table 81: GCC Veterinary Dermatological Drugs Industry Revenue (Million) Forecast, by Application 2020 & 2033
- Table 82: GCC Veterinary Dermatological Drugs Industry Volume (Dosage) Forecast, by Application 2020 & 2033
- Table 83: South Africa Veterinary Dermatological Drugs Industry Revenue (Million) Forecast, by Application 2020 & 2033
- Table 84: South Africa Veterinary Dermatological Drugs Industry Volume (Dosage) Forecast, by Application 2020 & 2033
- Table 85: Rest of Middle East and Africa Veterinary Dermatological Drugs Industry Revenue (Million) Forecast, by Application 2020 & 2033
- Table 86: Rest of Middle East and Africa Veterinary Dermatological Drugs Industry Volume (Dosage) Forecast, by Application 2020 & 2033
- Table 87: Global Veterinary Dermatological Drugs Industry Revenue Million Forecast, by Animal 2020 & 2033
- Table 88: Global Veterinary Dermatological Drugs Industry Volume Dosage Forecast, by Animal 2020 & 2033
- Table 89: Global Veterinary Dermatological Drugs Industry Revenue Million Forecast, by Route Of Administration 2020 & 2033
- Table 90: Global Veterinary Dermatological Drugs Industry Volume Dosage Forecast, by Route Of Administration 2020 & 2033
- Table 91: Global Veterinary Dermatological Drugs Industry Revenue Million Forecast, by Indication 2020 & 2033
- Table 92: Global Veterinary Dermatological Drugs Industry Volume Dosage Forecast, by Indication 2020 & 2033
- Table 93: Global Veterinary Dermatological Drugs Industry Revenue Million Forecast, by Distribution Channel 2020 & 2033
- Table 94: Global Veterinary Dermatological Drugs Industry Volume Dosage Forecast, by Distribution Channel 2020 & 2033
- Table 95: Global Veterinary Dermatological Drugs Industry Revenue Million Forecast, by Country 2020 & 2033
- Table 96: Global Veterinary Dermatological Drugs Industry Volume Dosage Forecast, by Country 2020 & 2033
- Table 97: Brazil Veterinary Dermatological Drugs Industry Revenue (Million) Forecast, by Application 2020 & 2033
- Table 98: Brazil Veterinary Dermatological Drugs Industry Volume (Dosage) Forecast, by Application 2020 & 2033
- Table 99: Argentina Veterinary Dermatological Drugs Industry Revenue (Million) Forecast, by Application 2020 & 2033
- Table 100: Argentina Veterinary Dermatological Drugs Industry Volume (Dosage) Forecast, by Application 2020 & 2033
- Table 101: Rest of South America Veterinary Dermatological Drugs Industry Revenue (Million) Forecast, by Application 2020 & 2033
- Table 102: Rest of South America Veterinary Dermatological Drugs Industry Volume (Dosage) Forecast, by Application 2020 & 2033
Frequently Asked Questions
1. What is the projected Compound Annual Growth Rate (CAGR) of the Veterinary Dermatological Drugs Industry?
The projected CAGR is approximately 7.11%.
2. Which companies are prominent players in the Veterinary Dermatological Drugs Industry?
Key companies in the market include Elanco, Merk & Co Inc, Ceva, Vivaldis, Leti Pharma, Mars Incorporated, Indian Immunologicals Ltd, Bimeda Inc, Virbac, Bioiberica S A U, Zoetis Inc.
3. What are the main segments of the Veterinary Dermatological Drugs Industry?
The market segments include Animal, Route Of Administration, Indication, Distribution Channel.
4. Can you provide details about the market size?
The market size is estimated to be USD 6.38 Million as of 2022.
5. What are some drivers contributing to market growth?
Increasing Burden of Dermatological Diseases in Pets; Increasing Pet adoption and Animal Care.
6. What are the notable trends driving market growth?
Companion Animal Segment is Expected to have Significant Growth Over the Forecast period.
7. Are there any restraints impacting market growth?
Low availability and Lack of awareness of the drugs.
8. Can you provide examples of recent developments in the market?
In June 2023: Zoetis Announced FDA Approval of Apoquel® Chewable (oclacitinib chewable tablet) for Control of Pruritus Associated With Allergic Dermatitis and Control of Atopic Dermatitis in Dogs
9. What pricing options are available for accessing the report?
Pricing options include single-user, multi-user, and enterprise licenses priced at USD 4750, USD 5250, and USD 8750 respectively.
10. Is the market size provided in terms of value or volume?
The market size is provided in terms of value, measured in Million and volume, measured in Dosage.
11. Are there any specific market keywords associated with the report?
Yes, the market keyword associated with the report is "Veterinary Dermatological Drugs Industry," which aids in identifying and referencing the specific market segment covered.
12. How do I determine which pricing option suits my needs best?
The pricing options vary based on user requirements and access needs. Individual users may opt for single-user licenses, while businesses requiring broader access may choose multi-user or enterprise licenses for cost-effective access to the report.
13. Are there any additional resources or data provided in the Veterinary Dermatological Drugs Industry report?
While the report offers comprehensive insights, it's advisable to review the specific contents or supplementary materials provided to ascertain if additional resources or data are available.
14. How can I stay updated on further developments or reports in the Veterinary Dermatological Drugs Industry?
To stay informed about further developments, trends, and reports in the Veterinary Dermatological Drugs Industry, consider subscribing to industry newsletters, following relevant companies and organizations, or regularly checking reputable industry news sources and publications.
Methodology
Step 1 - Identification of Relevant Samples Size from Population Database


Step 2 - Approaches for Defining Global Market Size (Value, Volume* & Price*)

Note*: In applicable scenarios
Step 3 - Data Sources
Primary Research
- Web Analytics
- Survey Reports
- Research Institute
- Latest Research Reports
- Opinion Leaders
Secondary Research
- Annual Reports
- White Paper
- Latest Press Release
- Industry Association
- Paid Database
- Investor Presentations

Step 4 - Data Triangulation
Involves using different sources of information in order to increase the validity of a study
These sources are likely to be stakeholders in a program - participants, other researchers, program staff, other community members, and so on.
Then we put all data in single framework & apply various statistical tools to find out the dynamic on the market.
During the analysis stage, feedback from the stakeholder groups would be compared to determine areas of agreement as well as areas of divergence