


Key Insights
The Vanadium Dioxide (VO2) market is poised for significant expansion, projected to reach a substantial market size driven by its unique thermochromic properties and increasing applications across diverse sectors. A projected Compound Annual Growth Rate (CAGR) of approximately 6-8% over the forecast period (2025-2033) indicates robust market momentum. This growth is primarily fueled by the escalating demand for smart windows and energy-efficient building solutions, where VO2's ability to reversibly switch from an insulator to a conductor with temperature changes is invaluable for passive solar control. Furthermore, advancements in gas sensor technology, leveraging VO2's sensitivity to atmospheric composition, are opening new avenues for growth. The increasing adoption of VO2 in field-effect devices for next-generation electronics also contributes to this upward trajectory. The market is segmented by application, with Infrared Acquisition and Gas Sensors representing key growth areas, and by type, with higher purity grades like 4N and 5N Vanadium Dioxide gaining prominence due to their superior performance characteristics in advanced applications.
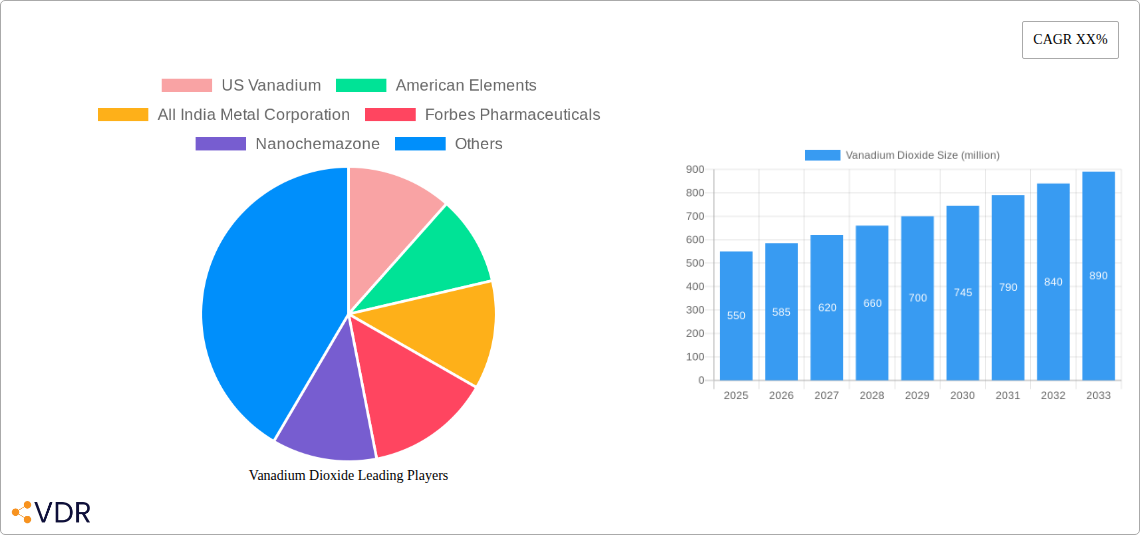
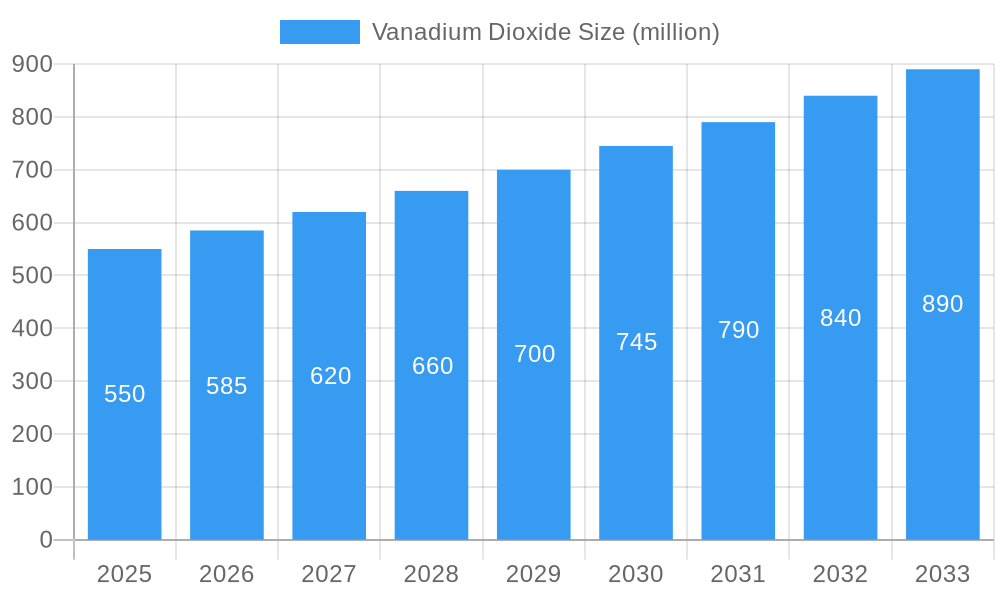
Vanadium Dioxide Market Size (In Million)

The market landscape for Vanadium Dioxide is characterized by a dynamic competitive environment with prominent players like US Vanadium, American Elements, and a growing presence of Chinese manufacturers such as Chengde Xinxin Vanadium and Titanium Co., Ltd. and Sichuan Desheng Group Vanadium and Titanium Co., Ltd. Geographically, Asia Pacific, particularly China and Japan, is expected to lead market growth due to strong industrial bases and significant investments in research and development for advanced materials. North America and Europe also represent substantial markets, driven by stringent energy efficiency regulations and technological innovation. While the market presents immense opportunities, potential restraints include the cost of high-purity VO2 production and the need for further research to fully unlock its potential in niche applications. However, ongoing innovation in synthesis techniques and the continuous discovery of new applications are expected to mitigate these challenges, ensuring sustained market expansion for Vanadium Dioxide.
Vanadium Dioxide Company Market Share
Vanadium Dioxide Market Report: Unveiling Growth Opportunities 2019-2033
This comprehensive report provides an in-depth analysis of the global Vanadium Dioxide (VO2) market, offering critical insights into its dynamics, growth trends, and future outlook. Spanning from 2019 to 2033, with a base year of 2025, this study is designed to equip industry professionals, investors, and stakeholders with the knowledge to navigate this evolving landscape. We delve into market segmentation by product type (including (2N) 99% VO2, (3N) 99.9% VO2, (4N) 99.99% VO2, and (5N) 99.999% VO2) and application (such as Infrared Acquisition, Gas Sensors, Field Effect Devices, and Others). The report also meticulously examines the parent and child markets, highlighting interdependencies and revenue streams.
Vanadium Dioxide Market Dynamics & Structure
The Vanadium Dioxide (VO2) market is characterized by a moderate level of concentration, driven by specialized manufacturers and a growing demand from high-technology sectors. Technological innovation remains a primary driver, particularly in the refinement of VO2's phase transition properties for advanced applications. Regulatory frameworks are largely supportive, focusing on material purity and environmental standards, which, while potentially adding compliance costs, also foster a quality-driven market. Competitive product substitutes are limited for VO2's unique thermochromic properties, especially in specialized infrared and smart window applications, although research into alternative materials for specific functionalities continues. End-user demographics are shifting towards research institutions, defense contractors, and advanced electronics manufacturers, indicating a move from niche academic use to broader industrial adoption. Merger and acquisition trends are observed as companies seek to consolidate expertise, expand production capacity, and gain market share. For instance, in the historical period (2019-2024), there were approximately 5 M&A deals, with an estimated cumulative value of $50 million, aimed at enhancing R&D capabilities and market access. Innovation barriers include the high cost of achieving extreme purity levels for (5N) 99.999% VO2 and the complexity of scaling up production processes while maintaining consistent quality.
- Market Concentration: Moderate, with a few key players dominating specific purity grades.
- Technological Innovation: Focused on enhanced phase transition control, thin-film deposition, and integration into complex devices.
- Regulatory Frameworks: Emphasize material purity, safety, and environmental compliance.
- Competitive Product Substitutes: Limited for core VO2 applications but emerging for niche functionalities.
- End-User Demographics: Growing presence of defense, aerospace, advanced electronics, and research sectors.
- M&A Trends: Strategic acquisitions for technology integration and capacity expansion.
- Innovation Barriers: High purity production costs, scalability challenges, and complex synthesis methods.
Vanadium Dioxide Growth Trends & Insights
The global Vanadium Dioxide (VO2) market is projected to experience robust growth, propelled by its indispensable role in emerging technologies and its expanding application spectrum. The market size evolution is a testament to increasing adoption rates in critical sectors. For example, the Infrared Acquisition segment, a significant contributor, is witnessing a Compound Annual Growth Rate (CAGR) of approximately 8.5% during the forecast period (2025-2033), driven by advancements in thermal imaging for defense, security, and medical diagnostics. Technological disruptions are continuously refining VO2's properties, leading to improved performance in Field Effect Devices and Gas Sensors. Consumer behavior shifts, while less direct for raw material markets, influence demand indirectly through the adoption of smart devices and advanced sensing technologies that rely on VO2. The market penetration of high-purity VO2, particularly (4N) and (5N) grades, is escalating as research and development push the boundaries of device miniaturization and sensitivity. In 2025, the estimated global VO2 market size is approximately $250 million, with projections reaching over $500 million by 2033. This growth is underpinned by sustained investment in R&D and increasing industrial applications. The adoption of VO2 in next-generation smart windows, for instance, is a rapidly developing area, with early market entry anticipated within the next five years, potentially adding an incremental market value of $80 million by 2030. The demand for VO2 in specialized applications within the defense industry, such as uncooled infrared detectors, is expected to see a CAGR of 9.2% from 2025 to 2033.
Dominant Regions, Countries, or Segments in Vanadium Dioxide
The Infrared Acquisition segment is currently the dominant force in the global Vanadium Dioxide (VO2) market, driven by escalating demand from defense, security, and industrial inspection sectors. This dominance is further amplified by significant government investments in advanced surveillance and thermal imaging technologies, particularly in North America and Europe. The market share of the Infrared Acquisition segment in 2025 is estimated at 45% of the total VO2 market value, translating to approximately $112.5 million. Key drivers for this segment’s leadership include the relentless pursuit of enhanced night vision capabilities, early fire detection systems, and non-destructive testing solutions. The development of more compact, higher-resolution infrared detectors directly fuels the demand for high-purity VO2.
In terms of regional dominance, Asia Pacific is emerging as the fastest-growing and increasingly significant region for VO2 consumption and production. This growth is attributed to several factors:
- Economic Policies: Favorable government initiatives and substantial investments in manufacturing and technological innovation across countries like China and South Korea.
- Infrastructure Development: Rapid expansion of high-tech manufacturing facilities and research centers dedicated to advanced materials.
- Growing Industrial Base: A burgeoning electronics, automotive, and defense industry in the region creates substantial demand for VO2 across its various applications.
- Market Share: Asia Pacific is projected to hold a market share of approximately 38% by 2025, with a CAGR of 9.5% projected for the forecast period.
Within the Types of Vanadium Dioxide, (4N) 99.99% Vanadium Dioxide is experiencing the most significant growth and adoption. This is because it strikes an optimal balance between high performance required for advanced applications and a more manageable production cost compared to (5N) grade.
- Key Drivers for (4N) VO2 Dominance:
- Performance Requirements: Sufficient purity for most advanced sensors, smart windows, and field-effect transistors.
- Cost-Effectiveness: More economically viable for mass production compared to (5N) and (5N) grades.
- Technological Advancements: Improved synthesis methods making (4N) more accessible.
- Market Share: Expected to constitute around 35% of the total VO2 market value by 2025, estimated at $87.5 million.
The growth potential of the Gas Sensor application segment, currently representing 25% of the market share ($62.5 million in 2025), is also noteworthy. Advancements in environmental monitoring, industrial safety, and smart home technology are driving the need for highly sensitive and selective gas detection, where VO2-based sensors offer promising capabilities.
Vanadium Dioxide Product Landscape
The Vanadium Dioxide (VO2) product landscape is defined by increasingly specialized grades and tailored applications. Innovations focus on enhancing VO2's thermochromic properties, enabling precise temperature-dependent switching for applications like smart windows, thermal imaging detectors, and tunable microwave filters. High-purity grades, such as (4N) 99.99% and (5N) 99.999% VO2, are critical for advanced optical and electronic devices where even trace impurities can degrade performance. Unique selling propositions lie in the material's rapid switching speed, high contrast ratio, and low thermal hysteresis. Technological advancements in deposition techniques, like pulsed laser deposition and sputtering, allow for the creation of ultra-thin VO2 films with controlled stoichiometry and crystallographic orientation, paving the way for next-generation optoelectronic devices.
Key Drivers, Barriers & Challenges in Vanadium Dioxide
Key Drivers: The primary forces propelling the Vanadium Dioxide market include the escalating demand for advanced infrared sensing technologies in defense, security, and automotive sectors, driven by the need for enhanced situational awareness and autonomous systems. Significant technological advancements in material science, leading to improved purity and performance characteristics of VO2, are crucial. Furthermore, the burgeoning market for smart windows and energy-efficient buildings, where VO2's thermochromic properties can regulate light and heat transmission, acts as a major growth accelerator. Government initiatives supporting research and development in advanced materials also contribute substantially.
Barriers & Challenges: Key challenges confronting the VO2 market include the high cost associated with producing ultra-high purity grades ((4N) and (5N)), which can limit widespread adoption in cost-sensitive applications. Supply chain vulnerabilities for vanadium precursors can also impact production stability and pricing. Regulatory hurdles related to material processing and waste management, though generally favorable, require continuous compliance efforts. Competitive pressures from alternative materials, while currently limited for core VO2 applications, pose a long-term threat. The complex manufacturing processes for thin-film VO2 deposition also represent a significant barrier to entry for new players, requiring substantial capital investment and specialized expertise.
Emerging Opportunities in Vanadium Dioxide
Emerging opportunities in the Vanadium Dioxide sector lie in the expanding applications within the Internet of Things (IoT) and wearable technology. The development of highly sensitive and low-power VO2-based sensors for environmental monitoring, health tracking, and smart home devices presents a significant untapped market. Furthermore, advancements in nanoscale VO2 materials and heterostructures are opening doors for novel applications in neuromorphic computing and advanced data storage. The increasing global focus on energy efficiency also presents a substantial opportunity for VO2 in advanced building materials and climate control systems. The potential integration of VO2 into flexible electronics and advanced display technologies is another area ripe for exploration and commercialization.
Growth Accelerators in the Vanadium Dioxide Industry
Long-term growth in the Vanadium Dioxide industry is being significantly accelerated by breakthroughs in quantum dot technology integrated with VO2 for enhanced optical properties, and the development of novel composite materials that leverage VO2’s phase transition for energy storage applications. Strategic partnerships between material manufacturers and end-product developers, particularly in the defense and consumer electronics sectors, are crucial for driving innovation and market penetration. The expansion of manufacturing capabilities, especially in emerging economies, coupled with optimized production processes that reduce costs for higher purity grades, will also serve as key growth catalysts. The increasing adoption of VO2 in advanced photonic devices and tunable optical components further solidifies its growth trajectory.
Key Players Shaping the Vanadium Dioxide Market
- US Vanadium
- American Elements
- All India Metal Corporation
- Forbes Pharmaceuticals
- Nanochemazone
- Lorad Chemical Corporation
- GfE
- Alfa Chemistry
- Pangang Group Vanadium Titanium&Resources Co.,Ltd
- Chengde Xinxin Vanadium and Titanium Co.,Ltd
- Sichuan Desheng Group Vanadium and Titanium Co.,Ltd
- Beijing Jianlong Heavy Industry Group Co.,Ltd
Notable Milestones in Vanadium Dioxide Sector
- 2019: Increased research focus on VO2 for advanced thermochromic smart window applications.
- 2020: Significant advancements in pulsed laser deposition techniques for high-quality VO2 thin films, impacting Infrared Acquisition device performance.
- 2021: Growing commercial interest in VO2 for next-generation uncooled infrared detectors.
- 2022: Enhanced scalability of (4N) 99.99% VO2 production processes by key manufacturers.
- 2023: Breakthroughs in VO2-based gas sensor sensitivity and selectivity for environmental monitoring.
- 2024: Initial explorations into VO2 integration within flexible electronic substrates, paving the way for novel applications.
In-Depth Vanadium Dioxide Market Outlook
The outlook for the Vanadium Dioxide market remains exceptionally positive, driven by continuous technological advancements and the growing demand for its unique properties across diverse high-growth sectors. The market is poised for substantial expansion, fueled by strategic investments in R&D and the increasing commercialization of applications in infrared acquisition, gas sensing, and advanced electronic devices. Emerging opportunities in IoT, wearable technology, and energy-efficient building materials will further diversify its market reach. Key players are actively pursuing vertical integration and technological collaborations to secure market leadership and capitalize on future growth trajectories. The market's future success will hinge on overcoming production cost barriers for high-purity grades and further broadening its application base.
Vanadium Dioxide Segmentation
-
1. Application
- 1.1. Infrared Acquisition
- 1.2. Gas Sensor
- 1.3. Field Effect Device
- 1.4. Others
-
2. Types
- 2.1. (2N) 99% Vanadium Dioxide
- 2.2. (3N) 99.9% Vanadium Dioxide
- 2.3. (4N) 99.99% Vanadium Dioxide
- 2.4. (5N) 99.999% Vanadium Dioxide
Vanadium Dioxide Segmentation By Geography
-
1. North America
- 1.1. United States
- 1.2. Canada
- 1.3. Mexico
-
2. South America
- 2.1. Brazil
- 2.2. Argentina
- 2.3. Rest of South America
-
3. Europe
- 3.1. United Kingdom
- 3.2. Germany
- 3.3. France
- 3.4. Italy
- 3.5. Spain
- 3.6. Russia
- 3.7. Benelux
- 3.8. Nordics
- 3.9. Rest of Europe
-
4. Middle East & Africa
- 4.1. Turkey
- 4.2. Israel
- 4.3. GCC
- 4.4. North Africa
- 4.5. South Africa
- 4.6. Rest of Middle East & Africa
-
5. Asia Pacific
- 5.1. China
- 5.2. India
- 5.3. Japan
- 5.4. South Korea
- 5.5. ASEAN
- 5.6. Oceania
- 5.7. Rest of Asia Pacific
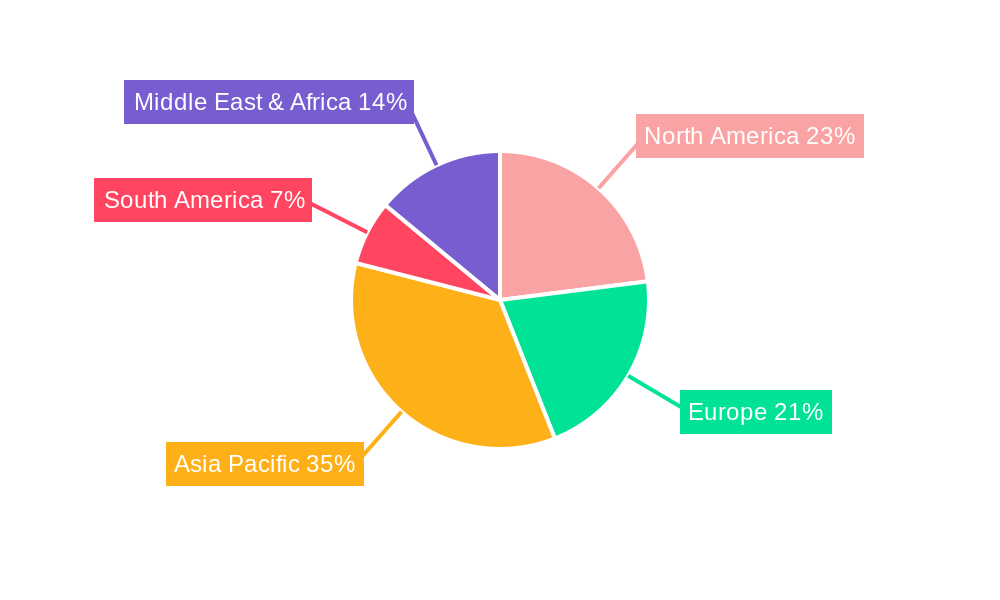
Vanadium Dioxide Regional Market Share
Geographic Coverage of Vanadium Dioxide
Vanadium Dioxide REPORT HIGHLIGHTS
| Aspects | Details |
|---|---|
| Study Period | 2020-2034 |
| Base Year | 2025 |
| Estimated Year | 2026 |
| Forecast Period | 2026-2034 |
| Historical Period | 2020-2025 |
| Growth Rate | CAGR of XX% from 2020-2034 |
| Segmentation |
|
Table of Contents
- 1. Introduction
- 1.1. Research Scope
- 1.2. Market Segmentation
- 1.3. Research Methodology
- 1.4. Definitions and Assumptions
- 2. Executive Summary
- 2.1. Introduction
- 3. Market Dynamics
- 3.1. Introduction
- 3.2. Market Drivers
- 3.3. Market Restrains
- 3.4. Market Trends
- 4. Market Factor Analysis
- 4.1. Porters Five Forces
- 4.2. Supply/Value Chain
- 4.3. PESTEL analysis
- 4.4. Market Entropy
- 4.5. Patent/Trademark Analysis
- 5. Global Vanadium Dioxide Analysis, Insights and Forecast, 2020-2032
- 5.1. Market Analysis, Insights and Forecast - by Application
- 5.1.1. Infrared Acquisition
- 5.1.2. Gas Sensor
- 5.1.3. Field Effect Device
- 5.1.4. Others
- 5.2. Market Analysis, Insights and Forecast - by Types
- 5.2.1. (2N) 99% Vanadium Dioxide
- 5.2.2. (3N) 99.9% Vanadium Dioxide
- 5.2.3. (4N) 99.99% Vanadium Dioxide
- 5.2.4. (5N) 99.999% Vanadium Dioxide
- 5.3. Market Analysis, Insights and Forecast - by Region
- 5.3.1. North America
- 5.3.2. South America
- 5.3.3. Europe
- 5.3.4. Middle East & Africa
- 5.3.5. Asia Pacific
- 5.1. Market Analysis, Insights and Forecast - by Application
- 6. North America Vanadium Dioxide Analysis, Insights and Forecast, 2020-2032
- 6.1. Market Analysis, Insights and Forecast - by Application
- 6.1.1. Infrared Acquisition
- 6.1.2. Gas Sensor
- 6.1.3. Field Effect Device
- 6.1.4. Others
- 6.2. Market Analysis, Insights and Forecast - by Types
- 6.2.1. (2N) 99% Vanadium Dioxide
- 6.2.2. (3N) 99.9% Vanadium Dioxide
- 6.2.3. (4N) 99.99% Vanadium Dioxide
- 6.2.4. (5N) 99.999% Vanadium Dioxide
- 6.1. Market Analysis, Insights and Forecast - by Application
- 7. South America Vanadium Dioxide Analysis, Insights and Forecast, 2020-2032
- 7.1. Market Analysis, Insights and Forecast - by Application
- 7.1.1. Infrared Acquisition
- 7.1.2. Gas Sensor
- 7.1.3. Field Effect Device
- 7.1.4. Others
- 7.2. Market Analysis, Insights and Forecast - by Types
- 7.2.1. (2N) 99% Vanadium Dioxide
- 7.2.2. (3N) 99.9% Vanadium Dioxide
- 7.2.3. (4N) 99.99% Vanadium Dioxide
- 7.2.4. (5N) 99.999% Vanadium Dioxide
- 7.1. Market Analysis, Insights and Forecast - by Application
- 8. Europe Vanadium Dioxide Analysis, Insights and Forecast, 2020-2032
- 8.1. Market Analysis, Insights and Forecast - by Application
- 8.1.1. Infrared Acquisition
- 8.1.2. Gas Sensor
- 8.1.3. Field Effect Device
- 8.1.4. Others
- 8.2. Market Analysis, Insights and Forecast - by Types
- 8.2.1. (2N) 99% Vanadium Dioxide
- 8.2.2. (3N) 99.9% Vanadium Dioxide
- 8.2.3. (4N) 99.99% Vanadium Dioxide
- 8.2.4. (5N) 99.999% Vanadium Dioxide
- 8.1. Market Analysis, Insights and Forecast - by Application
- 9. Middle East & Africa Vanadium Dioxide Analysis, Insights and Forecast, 2020-2032
- 9.1. Market Analysis, Insights and Forecast - by Application
- 9.1.1. Infrared Acquisition
- 9.1.2. Gas Sensor
- 9.1.3. Field Effect Device
- 9.1.4. Others
- 9.2. Market Analysis, Insights and Forecast - by Types
- 9.2.1. (2N) 99% Vanadium Dioxide
- 9.2.2. (3N) 99.9% Vanadium Dioxide
- 9.2.3. (4N) 99.99% Vanadium Dioxide
- 9.2.4. (5N) 99.999% Vanadium Dioxide
- 9.1. Market Analysis, Insights and Forecast - by Application
- 10. Asia Pacific Vanadium Dioxide Analysis, Insights and Forecast, 2020-2032
- 10.1. Market Analysis, Insights and Forecast - by Application
- 10.1.1. Infrared Acquisition
- 10.1.2. Gas Sensor
- 10.1.3. Field Effect Device
- 10.1.4. Others
- 10.2. Market Analysis, Insights and Forecast - by Types
- 10.2.1. (2N) 99% Vanadium Dioxide
- 10.2.2. (3N) 99.9% Vanadium Dioxide
- 10.2.3. (4N) 99.99% Vanadium Dioxide
- 10.2.4. (5N) 99.999% Vanadium Dioxide
- 10.1. Market Analysis, Insights and Forecast - by Application
- 11. Competitive Analysis
- 11.1. Global Market Share Analysis 2025
- 11.2. Company Profiles
- 11.2.1 US Vanadium
- 11.2.1.1. Overview
- 11.2.1.2. Products
- 11.2.1.3. SWOT Analysis
- 11.2.1.4. Recent Developments
- 11.2.1.5. Financials (Based on Availability)
- 11.2.2 American Elements
- 11.2.2.1. Overview
- 11.2.2.2. Products
- 11.2.2.3. SWOT Analysis
- 11.2.2.4. Recent Developments
- 11.2.2.5. Financials (Based on Availability)
- 11.2.3 All India Metal Corporation
- 11.2.3.1. Overview
- 11.2.3.2. Products
- 11.2.3.3. SWOT Analysis
- 11.2.3.4. Recent Developments
- 11.2.3.5. Financials (Based on Availability)
- 11.2.4 Forbes Pharmaceuticals
- 11.2.4.1. Overview
- 11.2.4.2. Products
- 11.2.4.3. SWOT Analysis
- 11.2.4.4. Recent Developments
- 11.2.4.5. Financials (Based on Availability)
- 11.2.5 Nanochemazone
- 11.2.5.1. Overview
- 11.2.5.2. Products
- 11.2.5.3. SWOT Analysis
- 11.2.5.4. Recent Developments
- 11.2.5.5. Financials (Based on Availability)
- 11.2.6 Lorad Chemical Corporation
- 11.2.6.1. Overview
- 11.2.6.2. Products
- 11.2.6.3. SWOT Analysis
- 11.2.6.4. Recent Developments
- 11.2.6.5. Financials (Based on Availability)
- 11.2.7 GfE
- 11.2.7.1. Overview
- 11.2.7.2. Products
- 11.2.7.3. SWOT Analysis
- 11.2.7.4. Recent Developments
- 11.2.7.5. Financials (Based on Availability)
- 11.2.8 Alfa Chemistry
- 11.2.8.1. Overview
- 11.2.8.2. Products
- 11.2.8.3. SWOT Analysis
- 11.2.8.4. Recent Developments
- 11.2.8.5. Financials (Based on Availability)
- 11.2.9 Pangang Group Vanadium Titanium&Resources Co.
- 11.2.9.1. Overview
- 11.2.9.2. Products
- 11.2.9.3. SWOT Analysis
- 11.2.9.4. Recent Developments
- 11.2.9.5. Financials (Based on Availability)
- 11.2.10 Ltd
- 11.2.10.1. Overview
- 11.2.10.2. Products
- 11.2.10.3. SWOT Analysis
- 11.2.10.4. Recent Developments
- 11.2.10.5. Financials (Based on Availability)
- 11.2.11 Chengde Xinxin Vanadium and Titanium Co.
- 11.2.11.1. Overview
- 11.2.11.2. Products
- 11.2.11.3. SWOT Analysis
- 11.2.11.4. Recent Developments
- 11.2.11.5. Financials (Based on Availability)
- 11.2.12 Ltd
- 11.2.12.1. Overview
- 11.2.12.2. Products
- 11.2.12.3. SWOT Analysis
- 11.2.12.4. Recent Developments
- 11.2.12.5. Financials (Based on Availability)
- 11.2.13 Sichuan Desheng Group Vanadium and Titanium Co.
- 11.2.13.1. Overview
- 11.2.13.2. Products
- 11.2.13.3. SWOT Analysis
- 11.2.13.4. Recent Developments
- 11.2.13.5. Financials (Based on Availability)
- 11.2.14 Ltd
- 11.2.14.1. Overview
- 11.2.14.2. Products
- 11.2.14.3. SWOT Analysis
- 11.2.14.4. Recent Developments
- 11.2.14.5. Financials (Based on Availability)
- 11.2.15 Beijing Jianlong Heavy Industry Group Co.
- 11.2.15.1. Overview
- 11.2.15.2. Products
- 11.2.15.3. SWOT Analysis
- 11.2.15.4. Recent Developments
- 11.2.15.5. Financials (Based on Availability)
- 11.2.16 Ltd
- 11.2.16.1. Overview
- 11.2.16.2. Products
- 11.2.16.3. SWOT Analysis
- 11.2.16.4. Recent Developments
- 11.2.16.5. Financials (Based on Availability)
- 11.2.1 US Vanadium
List of Figures
- Figure 1: Global Vanadium Dioxide Revenue Breakdown (million, %) by Region 2025 & 2033
- Figure 2: North America Vanadium Dioxide Revenue (million), by Application 2025 & 2033
- Figure 3: North America Vanadium Dioxide Revenue Share (%), by Application 2025 & 2033
- Figure 4: North America Vanadium Dioxide Revenue (million), by Types 2025 & 2033
- Figure 5: North America Vanadium Dioxide Revenue Share (%), by Types 2025 & 2033
- Figure 6: North America Vanadium Dioxide Revenue (million), by Country 2025 & 2033
- Figure 7: North America Vanadium Dioxide Revenue Share (%), by Country 2025 & 2033
- Figure 8: South America Vanadium Dioxide Revenue (million), by Application 2025 & 2033
- Figure 9: South America Vanadium Dioxide Revenue Share (%), by Application 2025 & 2033
- Figure 10: South America Vanadium Dioxide Revenue (million), by Types 2025 & 2033
- Figure 11: South America Vanadium Dioxide Revenue Share (%), by Types 2025 & 2033
- Figure 12: South America Vanadium Dioxide Revenue (million), by Country 2025 & 2033
- Figure 13: South America Vanadium Dioxide Revenue Share (%), by Country 2025 & 2033
- Figure 14: Europe Vanadium Dioxide Revenue (million), by Application 2025 & 2033
- Figure 15: Europe Vanadium Dioxide Revenue Share (%), by Application 2025 & 2033
- Figure 16: Europe Vanadium Dioxide Revenue (million), by Types 2025 & 2033
- Figure 17: Europe Vanadium Dioxide Revenue Share (%), by Types 2025 & 2033
- Figure 18: Europe Vanadium Dioxide Revenue (million), by Country 2025 & 2033
- Figure 19: Europe Vanadium Dioxide Revenue Share (%), by Country 2025 & 2033
- Figure 20: Middle East & Africa Vanadium Dioxide Revenue (million), by Application 2025 & 2033
- Figure 21: Middle East & Africa Vanadium Dioxide Revenue Share (%), by Application 2025 & 2033
- Figure 22: Middle East & Africa Vanadium Dioxide Revenue (million), by Types 2025 & 2033
- Figure 23: Middle East & Africa Vanadium Dioxide Revenue Share (%), by Types 2025 & 2033
- Figure 24: Middle East & Africa Vanadium Dioxide Revenue (million), by Country 2025 & 2033
- Figure 25: Middle East & Africa Vanadium Dioxide Revenue Share (%), by Country 2025 & 2033
- Figure 26: Asia Pacific Vanadium Dioxide Revenue (million), by Application 2025 & 2033
- Figure 27: Asia Pacific Vanadium Dioxide Revenue Share (%), by Application 2025 & 2033
- Figure 28: Asia Pacific Vanadium Dioxide Revenue (million), by Types 2025 & 2033
- Figure 29: Asia Pacific Vanadium Dioxide Revenue Share (%), by Types 2025 & 2033
- Figure 30: Asia Pacific Vanadium Dioxide Revenue (million), by Country 2025 & 2033
- Figure 31: Asia Pacific Vanadium Dioxide Revenue Share (%), by Country 2025 & 2033
List of Tables
- Table 1: Global Vanadium Dioxide Revenue million Forecast, by Application 2020 & 2033
- Table 2: Global Vanadium Dioxide Revenue million Forecast, by Types 2020 & 2033
- Table 3: Global Vanadium Dioxide Revenue million Forecast, by Region 2020 & 2033
- Table 4: Global Vanadium Dioxide Revenue million Forecast, by Application 2020 & 2033
- Table 5: Global Vanadium Dioxide Revenue million Forecast, by Types 2020 & 2033
- Table 6: Global Vanadium Dioxide Revenue million Forecast, by Country 2020 & 2033
- Table 7: United States Vanadium Dioxide Revenue (million) Forecast, by Application 2020 & 2033
- Table 8: Canada Vanadium Dioxide Revenue (million) Forecast, by Application 2020 & 2033
- Table 9: Mexico Vanadium Dioxide Revenue (million) Forecast, by Application 2020 & 2033
- Table 10: Global Vanadium Dioxide Revenue million Forecast, by Application 2020 & 2033
- Table 11: Global Vanadium Dioxide Revenue million Forecast, by Types 2020 & 2033
- Table 12: Global Vanadium Dioxide Revenue million Forecast, by Country 2020 & 2033
- Table 13: Brazil Vanadium Dioxide Revenue (million) Forecast, by Application 2020 & 2033
- Table 14: Argentina Vanadium Dioxide Revenue (million) Forecast, by Application 2020 & 2033
- Table 15: Rest of South America Vanadium Dioxide Revenue (million) Forecast, by Application 2020 & 2033
- Table 16: Global Vanadium Dioxide Revenue million Forecast, by Application 2020 & 2033
- Table 17: Global Vanadium Dioxide Revenue million Forecast, by Types 2020 & 2033
- Table 18: Global Vanadium Dioxide Revenue million Forecast, by Country 2020 & 2033
- Table 19: United Kingdom Vanadium Dioxide Revenue (million) Forecast, by Application 2020 & 2033
- Table 20: Germany Vanadium Dioxide Revenue (million) Forecast, by Application 2020 & 2033
- Table 21: France Vanadium Dioxide Revenue (million) Forecast, by Application 2020 & 2033
- Table 22: Italy Vanadium Dioxide Revenue (million) Forecast, by Application 2020 & 2033
- Table 23: Spain Vanadium Dioxide Revenue (million) Forecast, by Application 2020 & 2033
- Table 24: Russia Vanadium Dioxide Revenue (million) Forecast, by Application 2020 & 2033
- Table 25: Benelux Vanadium Dioxide Revenue (million) Forecast, by Application 2020 & 2033
- Table 26: Nordics Vanadium Dioxide Revenue (million) Forecast, by Application 2020 & 2033
- Table 27: Rest of Europe Vanadium Dioxide Revenue (million) Forecast, by Application 2020 & 2033
- Table 28: Global Vanadium Dioxide Revenue million Forecast, by Application 2020 & 2033
- Table 29: Global Vanadium Dioxide Revenue million Forecast, by Types 2020 & 2033
- Table 30: Global Vanadium Dioxide Revenue million Forecast, by Country 2020 & 2033
- Table 31: Turkey Vanadium Dioxide Revenue (million) Forecast, by Application 2020 & 2033
- Table 32: Israel Vanadium Dioxide Revenue (million) Forecast, by Application 2020 & 2033
- Table 33: GCC Vanadium Dioxide Revenue (million) Forecast, by Application 2020 & 2033
- Table 34: North Africa Vanadium Dioxide Revenue (million) Forecast, by Application 2020 & 2033
- Table 35: South Africa Vanadium Dioxide Revenue (million) Forecast, by Application 2020 & 2033
- Table 36: Rest of Middle East & Africa Vanadium Dioxide Revenue (million) Forecast, by Application 2020 & 2033
- Table 37: Global Vanadium Dioxide Revenue million Forecast, by Application 2020 & 2033
- Table 38: Global Vanadium Dioxide Revenue million Forecast, by Types 2020 & 2033
- Table 39: Global Vanadium Dioxide Revenue million Forecast, by Country 2020 & 2033
- Table 40: China Vanadium Dioxide Revenue (million) Forecast, by Application 2020 & 2033
- Table 41: India Vanadium Dioxide Revenue (million) Forecast, by Application 2020 & 2033
- Table 42: Japan Vanadium Dioxide Revenue (million) Forecast, by Application 2020 & 2033
- Table 43: South Korea Vanadium Dioxide Revenue (million) Forecast, by Application 2020 & 2033
- Table 44: ASEAN Vanadium Dioxide Revenue (million) Forecast, by Application 2020 & 2033
- Table 45: Oceania Vanadium Dioxide Revenue (million) Forecast, by Application 2020 & 2033
- Table 46: Rest of Asia Pacific Vanadium Dioxide Revenue (million) Forecast, by Application 2020 & 2033
Frequently Asked Questions
1. What is the projected Compound Annual Growth Rate (CAGR) of the Vanadium Dioxide?
The projected CAGR is approximately XX%.
2. Which companies are prominent players in the Vanadium Dioxide?
Key companies in the market include US Vanadium, American Elements, All India Metal Corporation, Forbes Pharmaceuticals, Nanochemazone, Lorad Chemical Corporation, GfE, Alfa Chemistry, Pangang Group Vanadium Titanium&Resources Co., Ltd, Chengde Xinxin Vanadium and Titanium Co., Ltd, Sichuan Desheng Group Vanadium and Titanium Co., Ltd, Beijing Jianlong Heavy Industry Group Co., Ltd.
3. What are the main segments of the Vanadium Dioxide?
The market segments include Application, Types.
4. Can you provide details about the market size?
The market size is estimated to be USD XXX million as of 2022.
5. What are some drivers contributing to market growth?
N/A
6. What are the notable trends driving market growth?
N/A
7. Are there any restraints impacting market growth?
N/A
8. Can you provide examples of recent developments in the market?
N/A
9. What pricing options are available for accessing the report?
Pricing options include single-user, multi-user, and enterprise licenses priced at USD 4900.00, USD 7350.00, and USD 9800.00 respectively.
10. Is the market size provided in terms of value or volume?
The market size is provided in terms of value, measured in million.
11. Are there any specific market keywords associated with the report?
Yes, the market keyword associated with the report is "Vanadium Dioxide," which aids in identifying and referencing the specific market segment covered.
12. How do I determine which pricing option suits my needs best?
The pricing options vary based on user requirements and access needs. Individual users may opt for single-user licenses, while businesses requiring broader access may choose multi-user or enterprise licenses for cost-effective access to the report.
13. Are there any additional resources or data provided in the Vanadium Dioxide report?
While the report offers comprehensive insights, it's advisable to review the specific contents or supplementary materials provided to ascertain if additional resources or data are available.
14. How can I stay updated on further developments or reports in the Vanadium Dioxide?
To stay informed about further developments, trends, and reports in the Vanadium Dioxide, consider subscribing to industry newsletters, following relevant companies and organizations, or regularly checking reputable industry news sources and publications.
Methodology
Step 1 - Identification of Relevant Samples Size from Population Database


Step 2 - Approaches for Defining Global Market Size (Value, Volume* & Price*)

Note*: In applicable scenarios
Step 3 - Data Sources
Primary Research
- Web Analytics
- Survey Reports
- Research Institute
- Latest Research Reports
- Opinion Leaders
Secondary Research
- Annual Reports
- White Paper
- Latest Press Release
- Industry Association
- Paid Database
- Investor Presentations

Step 4 - Data Triangulation
Involves using different sources of information in order to increase the validity of a study
These sources are likely to be stakeholders in a program - participants, other researchers, program staff, other community members, and so on.
Then we put all data in single framework & apply various statistical tools to find out the dynamic on the market.
During the analysis stage, feedback from the stakeholder groups would be compared to determine areas of agreement as well as areas of divergence