

Key Insights
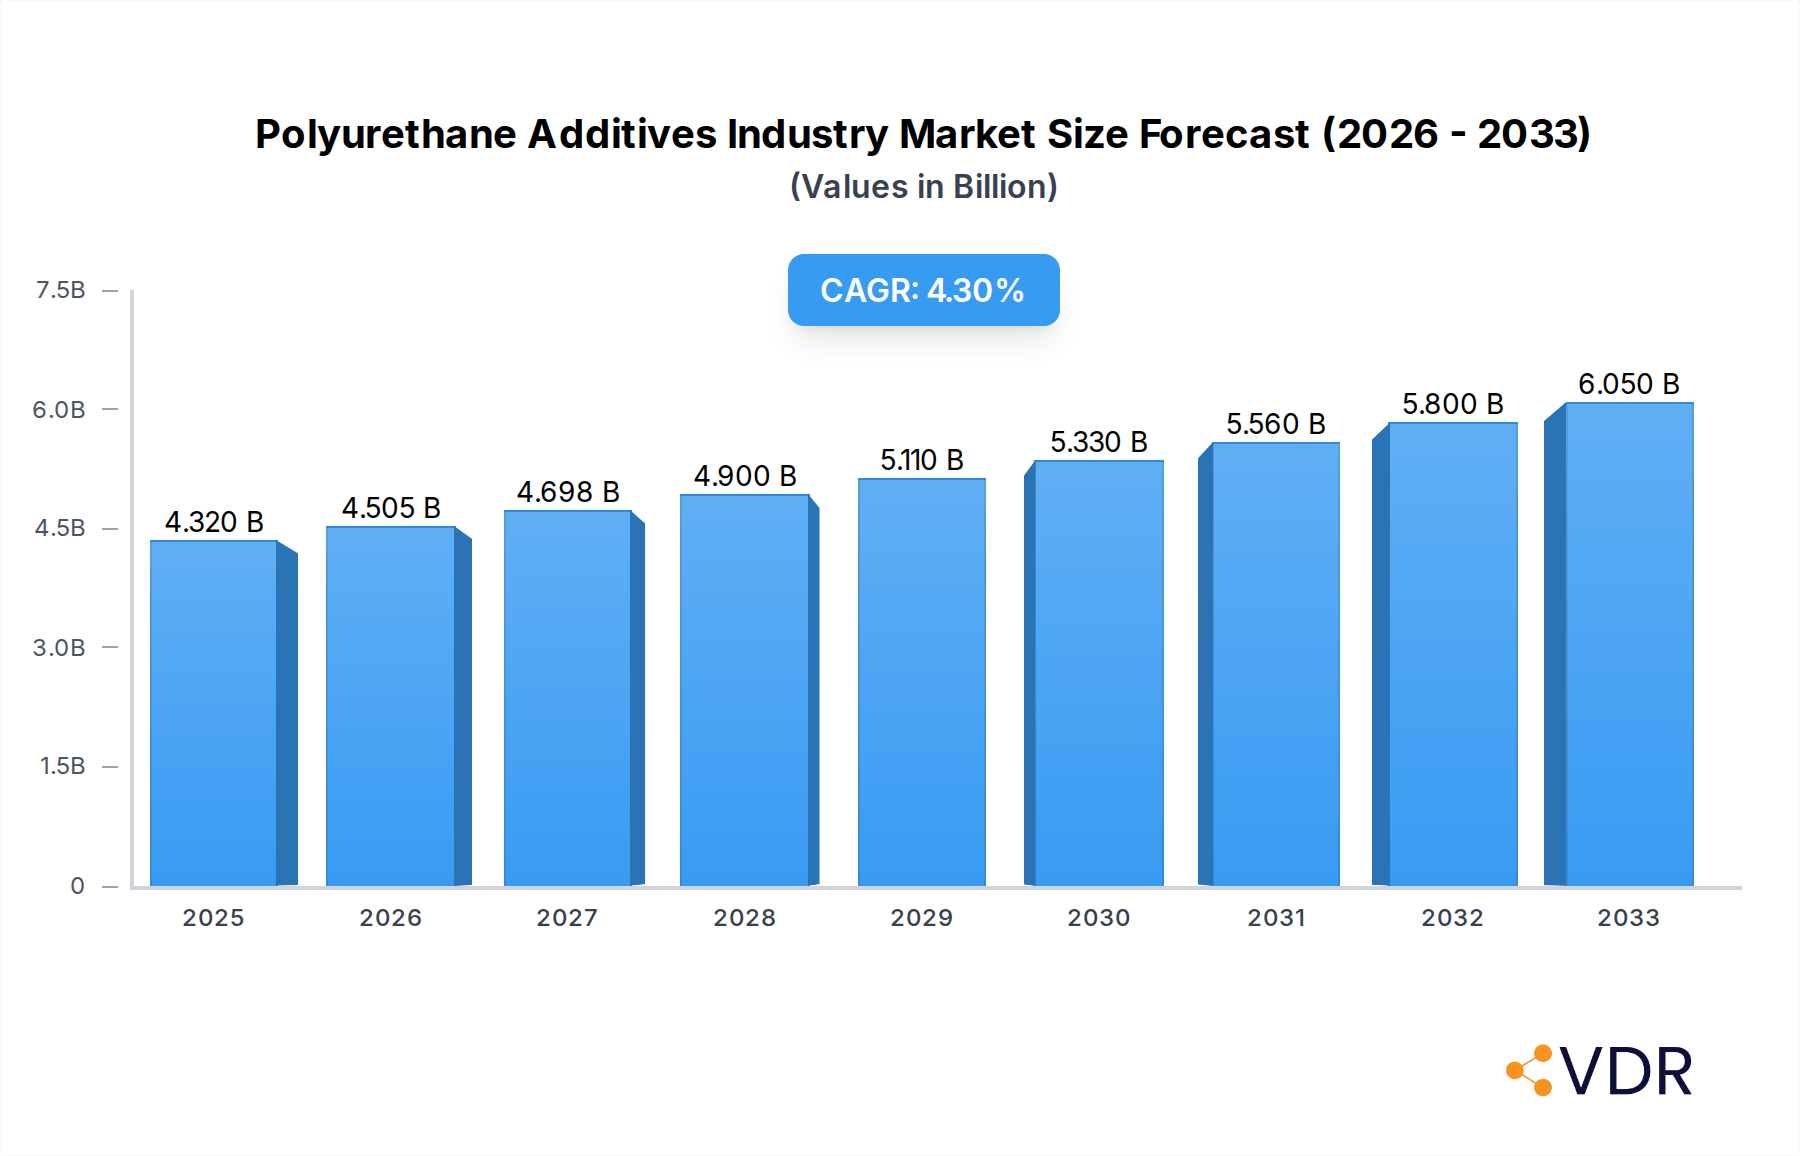
The global Polyurethane Additives market is poised for robust expansion, projected to reach approximately $4,320 million by 2025, with an impressive Compound Annual Growth Rate (CAGR) exceeding 4.50% during the forecast period of 2025-2033. This significant growth is primarily fueled by the increasing demand for lightweight and durable materials across various end-use industries, including automotive, construction, furniture, and electronics. The versatility of polyurethane, enhanced by specialized additives, makes it a preferred material for applications ranging from flexible molded foams in seating and bedding to rigid foams for insulation in buildings and appliances. Furthermore, the growing emphasis on sustainability and eco-friendly manufacturing processes is driving innovation in the development of bio-based and low-VOC (Volatile Organic Compound) polyurethane additives, presenting new avenues for market participants. Emerging economies, particularly in the Asia Pacific region, are expected to be key growth engines due to rapid industrialization and infrastructure development.

Polyurethane Additives Industry Market Size (In Billion)
The market's dynamic is shaped by a strategic interplay of several factors. Key drivers include the escalating adoption of advanced insulation solutions in the construction sector to improve energy efficiency, and the rising popularity of high-performance coatings and adhesives that offer superior durability and protection. The automotive industry's continuous pursuit of weight reduction for enhanced fuel efficiency and performance also contributes significantly to the demand for specialized polyurethane additives. However, the market faces certain restraints, such as the fluctuating prices of raw materials, which can impact manufacturing costs and profit margins. Stringent environmental regulations concerning the production and use of certain chemical additives also necessitate continuous research and development for compliant alternatives. Key players in the Polyurethane Additives market, including KAO Corporation, Air Products Inc., Evonik Industries AG, and BASF SE, are actively investing in R&D and strategic collaborations to expand their product portfolios and geographical reach, thereby capitalizing on emerging opportunities and navigating market challenges.
Polyurethane Additives Industry Company Market Share
Unlock the strategic insights into the dynamic global Polyurethane Additives market. This comprehensive report provides an in-depth analysis of market drivers, growth trends, competitive landscape, and future opportunities, essential for stakeholders navigating the evolving polyurethane ecosystem.
This report offers a granular examination of the Polyurethane Additives market, including its parent and child market dynamics, from 2019 to 2033, with a base year of 2025. Dive into detailed segmentation by type and application, analyze regional dominance, and understand the impact of key industry developments and players.
Polyurethane Additives Industry Market Dynamics & Structure
The Polyurethane Additives market is characterized by a moderately concentrated landscape, with key players like BASF SE, Covestro AG, Huntsman International LLC, and Dow holding significant market share. Technological innovation remains a primary driver, fueled by the demand for enhanced material performance, sustainability, and compliance with evolving environmental regulations. The development of bio-based and low-VOC (Volatile Organic Compound) additives is a prominent trend, responding to increasing consumer and regulatory pressure.
- Market Concentration: The top players collectively account for approximately 55-60% of the global market revenue, indicating a competitive yet consolidated industry structure.
- Technological Innovation: Focus areas include fire retardancy, improved foam properties, and enhanced adhesion characteristics, driving R&D investments.
- Regulatory Frameworks: Stringent regulations concerning emissions and hazardous substances are shaping product development and market entry strategies.
- Competitive Product Substitutes: While direct substitutes for specialized polyurethane additives are limited, alternative materials in end-use applications can indirectly impact demand.
- End-User Demographics: The automotive, construction, furniture, and appliance industries represent the largest consumer segments, each with specific additive requirements.
- M&A Trends: Strategic acquisitions and partnerships are prevalent, aimed at expanding product portfolios, geographical reach, and technological capabilities. In July 2023, Everchem Specialty Chemicals' acquisition of Specialty Products Inc. underscores this trend, aiming to bolster solutions for the polyurethane market.
- Innovation Barriers: High R&D costs, complex formulation challenges, and the need for extensive testing and certification can pose significant barriers to entry for new entrants.
Polyurethane Additives Industry Growth Trends & Insights
The global Polyurethane Additives market is poised for substantial growth, driven by the expanding applications of polyurethanes across diverse industries and increasing demand for high-performance, sustainable materials. The market size is projected to expand from approximately USD 8,500 million in the base year 2025 to over USD 13,000 million by 2033, exhibiting a Compound Annual Growth Rate (CAGR) of approximately 5.5% during the forecast period (2025-2033). This growth is underpinned by escalating adoption rates in emerging economies, coupled with technological advancements that enhance the functionalities and environmental profiles of polyurethane additives.
The automotive sector, with its continuous push for lightweighting and improved safety, represents a significant growth engine, increasing the demand for specialized catalysts and flame retardants. Similarly, the booming construction industry, particularly in developing regions, fuels the demand for rigid and flexible foams used in insulation and structural applications, thereby driving the consumption of blowing agents and surfactants. Consumer preferences are also shifting towards eco-friendly products, prompting manufacturers to invest heavily in developing bio-based and low-emission polyurethane additives. This evolution in consumer behavior is a critical factor influencing market penetration and product innovation. Technological disruptions, such as the development of advanced catalysts that enable faster curing times and lower energy consumption, are further accelerating market adoption. The integration of smart materials and additives that provide enhanced functionalities like self-healing or improved thermal management is also emerging, promising to redefine the performance benchmarks for polyurethane-based products. The overall market trajectory is thus characterized by robust expansion, driven by a confluence of industrial demand, environmental consciousness, and relentless technological progress.
Dominant Regions, Countries, or Segments in Polyurethane Additives Industry
The Asia Pacific region is projected to be the dominant force in the global Polyurethane Additives market, driven by rapid industrialization, robust manufacturing activities, and significant infrastructure development. Countries like China and India are at the forefront, benefiting from government initiatives promoting domestic production and favorable economic policies.
Dominant Region: Asia Pacific, holding an estimated market share of over 35% in 2025.
- Key Drivers:
- Manufacturing Hub: Asia Pacific serves as a global manufacturing hub for sectors like automotive, electronics, and furniture, all significant consumers of polyurethanes.
- Infrastructure Development: Extensive investments in construction and infrastructure projects, particularly in China and Southeast Asia, create substantial demand for rigid and flexible polyurethane foams used in insulation, coatings, and sealants.
- Growing Middle Class: An expanding middle class fuels demand for consumer goods and improved housing, indirectly boosting the polyurethane additives market.
- Government Support: Favorable government policies, including industrial incentives and foreign direct investment, further accelerate market growth.
- Market Share & Growth Potential: The region is expected to maintain its dominance throughout the forecast period, with an estimated CAGR of around 6.0% due to its vast market size and ongoing economic expansion.
- Key Drivers:
Dominant Segment (Type): Blowing Agents are anticipated to be the largest segment by type, driven by the extensive use of polyurethane foams in insulation and construction applications.
- Key Drivers:
- Energy Efficiency Mandates: Increasing global focus on energy conservation and stricter building codes for thermal insulation are major catalysts for blowing agent demand.
- Growth in Rigid Foams: Rigid polyurethane foams, utilizing blowing agents, are extensively used in refrigerators, freezers, and building insulation, contributing to segment dominance.
- Technological Advancements: Development of more environmentally friendly blowing agents, such as hydrofluoroolefins (HFOs) and water-based systems, is expanding their application scope.
- Market Share & Growth Potential: This segment is estimated to hold over 30% of the total market in 2025 and is expected to grow at a healthy CAGR of approximately 5.8% during the forecast period.
- Key Drivers:
Dominant Segment (Application): Rigid Foams are expected to be the largest application segment due to their widespread use in construction and appliances.
- Key Drivers:
- Construction Industry Growth: The demand for energy-efficient buildings and infrastructure projects directly translates to increased consumption of rigid polyurethane foams for insulation.
- Appliance Insulation: Refrigerators, freezers, and water heaters heavily rely on rigid PU foams for their insulating properties, ensuring energy efficiency.
- Lightweighting in Automotive: While flexible foams are also used, rigid foams contribute to structural integrity and lightweighting in certain automotive components.
- Market Share & Growth Potential: This segment is projected to account for approximately 30% of the market in 2025, with a projected CAGR of around 5.9% during the forecast period.
- Key Drivers:
Polyurethane Additives Industry Product Landscape
The Polyurethane Additives market is characterized by a diverse and innovative product landscape, crucial for tailoring the properties of polyurethane materials. Key product types include blowing agents, catalysts, flame retardants, and surfactants, each serving distinct functions. Blowing agents are vital for creating foam structures, with ongoing innovation focused on environmentally benign options like HFOs and CO2-based systems. Catalysts are essential for controlling reaction kinetics, with advancements leading to faster cure times and improved processing efficiencies. Flame retardants are increasingly developed to meet stringent safety standards across automotive, construction, and furniture applications, with a growing emphasis on halogen-free formulations. Surfactants ensure foam stability and cell structure uniformity. Companies are continually introducing specialized additives that offer enhanced performance metrics such as improved durability, UV resistance, and bio-compatibility, catering to evolving end-user demands for high-performance and sustainable polyurethane solutions.
Key Drivers, Barriers & Challenges in Polyurethane Additives Industry
Key Drivers:
- Growing Demand for Polyurethane Foams: Expansion in construction, automotive, and furniture industries worldwide fuels the need for polyurethane additives.
- Sustainability Initiatives: Increasing demand for eco-friendly and bio-based additives, alongside regulations promoting lower VOC emissions.
- Technological Advancements: Development of high-performance additives offering improved properties like fire resistance, durability, and faster curing.
- Energy Efficiency Focus: Demand for insulation materials in buildings and appliances drives the consumption of blowing agents and other foam-enhancing additives.
Barriers & Challenges:
- Raw Material Price Volatility: Fluctuations in the prices of petrochemical-based raw materials can impact production costs and market stability.
- Stringent Environmental Regulations: Compliance with evolving global environmental standards and the phase-out of certain traditional additives pose R&D and market entry challenges.
- High R&D Investment: Developing novel, sustainable, and high-performance additives requires significant investment in research and development.
- Supply Chain Disruptions: Geopolitical factors and logistical challenges can affect the availability and cost of raw materials and finished products.
- Competition from Alternative Materials: In some applications, alternative materials may offer competitive pricing or performance, posing a threat to polyurethane adoption.
Emerging Opportunities in Polyurethane Additives Industry
Emerging opportunities in the Polyurethane Additives industry lie in the development of advanced, sustainable solutions. The increasing focus on circular economy principles is driving innovation in biodegradable and recyclable additives. The demand for bio-based polyurethane additives derived from renewable resources presents a significant untapped market. Furthermore, the burgeoning electric vehicle (EV) sector offers new avenues for high-performance additives in lightweight components, thermal management systems, and battery encapsulation. The growing emphasis on smart materials and functional additives, such as self-healing polymers and conductive polyurethanes, also represents a promising growth area, catering to niche but high-value applications in electronics and aerospace.
Growth Accelerators in the Polyurethane Additives Industry Industry
Several factors are accelerating the growth of the Polyurethane Additives industry. Technological breakthroughs in catalyst design are enabling more efficient and environmentally friendly polymerization processes, leading to faster production cycles and reduced energy consumption. Strategic partnerships and collaborations between additive manufacturers and polyurethane producers are fostering innovation and accelerating the adoption of new additive technologies. The expansion of the polyurethane market into emerging economies, driven by industrial growth and infrastructure development, provides a significant platform for additive sales. Furthermore, increasing government support for green technologies and sustainable manufacturing practices is creating a favorable environment for eco-friendly additives, acting as a major growth catalyst.
Key Players Shaping the Polyurethane Additives Industry Market
- KAO Corporation
- Air Products Inc
- Evonik Industries AG
- Momentive Performance Materials Inc
- Specialty Products Inc
- BASF SE
- Huntsman International LLC
- GEO Specialty Chemicals Inc
- Dow
- Eastman Chemical Company
- Covestro AG
- Tosoh Corporation
Notable Milestones in Polyurethane Additives Industry Sector
- August 2023: Marelli developed a new lightweight polyurethane foam for all foam-in-place (FIP) applications, particularly the main dashboard panel, in collaboration with Covestro AG. This innovation enhances lightweighting potential in automotive interiors.
- July 2023: Everchem Specialty Chemicals acquired Specialty Products Inc. This acquisition aims to bolster the provision of valued, solutions-based chemical technology to the vast polyurethane markets, expected to significantly drive the PU additive market.
- September 2022: LANXESS expanded its LF urethane prepolymer range for adhesives with bio-based raw materials. These prepolymers enhance performance, processing, and productivity while enabling companies to reduce CO2 emissions, aligning with climate-neutral goals.
In-Depth Polyurethane Additives Industry Market Outlook
The outlook for the Polyurethane Additives industry is exceptionally promising, driven by an unwavering demand for advanced materials across key sectors. Future market potential is significantly enhanced by the continuous innovation in sustainability, with a strong shift towards bio-based, recyclable, and low-VOC additives. Strategic opportunities abound in addressing the evolving needs of the automotive industry, particularly in the realm of electric vehicles, for lightweighting and thermal management solutions. The construction sector's persistent need for energy-efficient insulation will continue to bolster demand for blowing agents and related additives. Collaboration between additive manufacturers and end-users will be crucial for co-creating tailored solutions that meet stringent performance and environmental requirements, thereby unlocking new market segments and driving sustained, robust growth throughout the forecast period.
Polyurethane Additives Industry Segmentation
-
1. Type
- 1.1. Blowing Agents
- 1.2. Catalysts
- 1.3. Flame Retardants
- 1.4. Surfactants
- 1.5. Other Ad
-
2. Application
- 2.1. Adhesives and Sealants
- 2.2. Coatings
- 2.3. Flexible Molded Foams
- 2.4. Rigid Foams
- 2.5. Other Ap
Polyurethane Additives Industry Segmentation By Geography
-
1. Asia Pacific
- 1.1. China
- 1.2. India
- 1.3. Japan
- 1.4. South Korea
- 1.5. ASEAN Countries
- 1.6. Rest of Asia Pacific
-
2. North America
- 2.1. United States
- 2.2. Canada
- 2.3. Mexico
-
3. Europe
- 3.1. Germany
- 3.2. United Kingdom
- 3.3. Italy
- 3.4. France
- 3.5. Rest of Europe
-
4. South America
- 4.1. Brazil
- 4.2. Argentina
- 4.3. Rest of South America
-
5. Middle East and Africa
- 5.1. Saudi Arabia
- 5.2. South Africa
- 5.3. Rest of Middle East and Africa

Polyurethane Additives Industry Regional Market Share
Geographic Coverage of Polyurethane Additives Industry
Polyurethane Additives Industry REPORT HIGHLIGHTS
| Aspects | Details |
|---|---|
| Study Period | 2020-2034 |
| Base Year | 2025 |
| Estimated Year | 2026 |
| Forecast Period | 2026-2034 |
| Historical Period | 2020-2025 |
| Growth Rate | CAGR of > 4.00% from 2020-2034 |
| Segmentation |
|
Table of Contents
- 1. Introduction
- 1.1. Research Scope
- 1.2. Market Segmentation
- 1.3. Research Objective
- 1.4. Definitions and Assumptions
- 2. Executive Summary
- 2.1. Market Snapshot
- 3. Market Dynamics
- 3.1. Market Drivers
- 3.2. Market Restrains
- 3.3. Market Trends
- 3.4. Market Opportunities
- 4. Market Factor Analysis
- 4.1. Porters Five Forces
- 4.1.1. Bargaining Power of Suppliers
- 4.1.2. Bargaining Power of Buyers
- 4.1.3. Threat of New Entrants
- 4.1.4. Threat of Substitutes
- 4.1.5. Competitive Rivalry
- 4.2. PESTEL analysis
- 4.3. BCG Analysis
- 4.3.1. Stars (High Growth, High Market Share)
- 4.3.2. Cash Cows (Low Growth, High Market Share)
- 4.3.3. Question Mark (High Growth, Low Market Share)
- 4.3.4. Dogs (Low Growth, Low Market Share)
- 4.4. Ansoff Matrix Analysis
- 4.5. Supply Chain Analysis
- 4.6. Regulatory Landscape
- 4.7. Current Market Potential and Opportunity Assessment (TAM–SAM–SOM Framework)
- 4.8. VDR Analyst Note
- 4.1. Porters Five Forces
- 5. Market Analysis, Insights and Forecast 2021-2033
- 5.1. Market Analysis, Insights and Forecast - by Type
- 5.1.1. Blowing Agents
- 5.1.2. Catalysts
- 5.1.3. Flame Retardants
- 5.1.4. Surfactants
- 5.1.5. Other Ad
- 5.2. Market Analysis, Insights and Forecast - by Application
- 5.2.1. Adhesives and Sealants
- 5.2.2. Coatings
- 5.2.3. Flexible Molded Foams
- 5.2.4. Rigid Foams
- 5.2.5. Other Ap
- 5.3. Market Analysis, Insights and Forecast - by Region
- 5.3.1. Asia Pacific
- 5.3.2. North America
- 5.3.3. Europe
- 5.3.4. South America
- 5.3.5. Middle East and Africa
- 5.1. Market Analysis, Insights and Forecast - by Type
- 6. Global Polyurethane Additives Industry Analysis, Insights and Forecast, 2021-2033
- 6.1. Market Analysis, Insights and Forecast - by Type
- 6.1.1. Blowing Agents
- 6.1.2. Catalysts
- 6.1.3. Flame Retardants
- 6.1.4. Surfactants
- 6.1.5. Other Ad
- 6.2. Market Analysis, Insights and Forecast - by Application
- 6.2.1. Adhesives and Sealants
- 6.2.2. Coatings
- 6.2.3. Flexible Molded Foams
- 6.2.4. Rigid Foams
- 6.2.5. Other Ap
- 6.1. Market Analysis, Insights and Forecast - by Type
- 7. Asia Pacific Polyurethane Additives Industry Analysis, Insights and Forecast, 2021-2033
- 7.1. Market Analysis, Insights and Forecast - by Type
- 7.1.1. Blowing Agents
- 7.1.2. Catalysts
- 7.1.3. Flame Retardants
- 7.1.4. Surfactants
- 7.1.5. Other Ad
- 7.2. Market Analysis, Insights and Forecast - by Application
- 7.2.1. Adhesives and Sealants
- 7.2.2. Coatings
- 7.2.3. Flexible Molded Foams
- 7.2.4. Rigid Foams
- 7.2.5. Other Ap
- 7.1. Market Analysis, Insights and Forecast - by Type
- 8. North America Polyurethane Additives Industry Analysis, Insights and Forecast, 2021-2033
- 8.1. Market Analysis, Insights and Forecast - by Type
- 8.1.1. Blowing Agents
- 8.1.2. Catalysts
- 8.1.3. Flame Retardants
- 8.1.4. Surfactants
- 8.1.5. Other Ad
- 8.2. Market Analysis, Insights and Forecast - by Application
- 8.2.1. Adhesives and Sealants
- 8.2.2. Coatings
- 8.2.3. Flexible Molded Foams
- 8.2.4. Rigid Foams
- 8.2.5. Other Ap
- 8.1. Market Analysis, Insights and Forecast - by Type
- 9. Europe Polyurethane Additives Industry Analysis, Insights and Forecast, 2021-2033
- 9.1. Market Analysis, Insights and Forecast - by Type
- 9.1.1. Blowing Agents
- 9.1.2. Catalysts
- 9.1.3. Flame Retardants
- 9.1.4. Surfactants
- 9.1.5. Other Ad
- 9.2. Market Analysis, Insights and Forecast - by Application
- 9.2.1. Adhesives and Sealants
- 9.2.2. Coatings
- 9.2.3. Flexible Molded Foams
- 9.2.4. Rigid Foams
- 9.2.5. Other Ap
- 9.1. Market Analysis, Insights and Forecast - by Type
- 10. South America Polyurethane Additives Industry Analysis, Insights and Forecast, 2021-2033
- 10.1. Market Analysis, Insights and Forecast - by Type
- 10.1.1. Blowing Agents
- 10.1.2. Catalysts
- 10.1.3. Flame Retardants
- 10.1.4. Surfactants
- 10.1.5. Other Ad
- 10.2. Market Analysis, Insights and Forecast - by Application
- 10.2.1. Adhesives and Sealants
- 10.2.2. Coatings
- 10.2.3. Flexible Molded Foams
- 10.2.4. Rigid Foams
- 10.2.5. Other Ap
- 10.1. Market Analysis, Insights and Forecast - by Type
- 11. Middle East and Africa Polyurethane Additives Industry Analysis, Insights and Forecast, 2021-2033
- 11.1. Market Analysis, Insights and Forecast - by Type
- 11.1.1. Blowing Agents
- 11.1.2. Catalysts
- 11.1.3. Flame Retardants
- 11.1.4. Surfactants
- 11.1.5. Other Ad
- 11.2. Market Analysis, Insights and Forecast - by Application
- 11.2.1. Adhesives and Sealants
- 11.2.2. Coatings
- 11.2.3. Flexible Molded Foams
- 11.2.4. Rigid Foams
- 11.2.5. Other Ap
- 11.1. Market Analysis, Insights and Forecast - by Type
- 12. Competitive Analysis
- 12.1. Company Profiles
- 12.1.1 KAO Corporation
- 12.1.1.1. Company Overview
- 12.1.1.2. Products
- 12.1.1.3. Company Financials
- 12.1.1.4. SWOT Analysis
- 12.1.2 Air Products Inc
- 12.1.2.1. Company Overview
- 12.1.2.2. Products
- 12.1.2.3. Company Financials
- 12.1.2.4. SWOT Analysis
- 12.1.3 Evonik Industries AG
- 12.1.3.1. Company Overview
- 12.1.3.2. Products
- 12.1.3.3. Company Financials
- 12.1.3.4. SWOT Analysis
- 12.1.4 Momentive Performance Materials Inc
- 12.1.4.1. Company Overview
- 12.1.4.2. Products
- 12.1.4.3. Company Financials
- 12.1.4.4. SWOT Analysis
- 12.1.5 Specialty Products Inc
- 12.1.5.1. Company Overview
- 12.1.5.2. Products
- 12.1.5.3. Company Financials
- 12.1.5.4. SWOT Analysis
- 12.1.6 BASF SE
- 12.1.6.1. Company Overview
- 12.1.6.2. Products
- 12.1.6.3. Company Financials
- 12.1.6.4. SWOT Analysis
- 12.1.7 Huntsman International LLC
- 12.1.7.1. Company Overview
- 12.1.7.2. Products
- 12.1.7.3. Company Financials
- 12.1.7.4. SWOT Analysis
- 12.1.8 GEO Specialty Chemicals Inc
- 12.1.8.1. Company Overview
- 12.1.8.2. Products
- 12.1.8.3. Company Financials
- 12.1.8.4. SWOT Analysis
- 12.1.9 Dow
- 12.1.9.1. Company Overview
- 12.1.9.2. Products
- 12.1.9.3. Company Financials
- 12.1.9.4. SWOT Analysis
- 12.1.10 Eastman Chemical Company
- 12.1.10.1. Company Overview
- 12.1.10.2. Products
- 12.1.10.3. Company Financials
- 12.1.10.4. SWOT Analysis
- 12.1.11 Covestro AG
- 12.1.11.1. Company Overview
- 12.1.11.2. Products
- 12.1.11.3. Company Financials
- 12.1.11.4. SWOT Analysis
- 12.1.12 Tosoh Corporation*List Not Exhaustive
- 12.1.12.1. Company Overview
- 12.1.12.2. Products
- 12.1.12.3. Company Financials
- 12.1.12.4. SWOT Analysis
- 12.1.1 KAO Corporation
- 12.2. Market Entropy
- 12.2.1 Company's Key Areas Served
- 12.2.2 Recent Developments
- 12.3. Company Market Share Analysis 2025
- 12.3.1 Top 5 Companies Market Share Analysis
- 12.3.2 Top 3 Companies Market Share Analysis
- 12.4. List of Potential Customers
- 13. Research Methodology
List of Figures
- Figure 1: Global Polyurethane Additives Industry Revenue Breakdown (Million, %) by Region 2025 & 2033
- Figure 2: Global Polyurethane Additives Industry Volume Breakdown (K Tons, %) by Region 2025 & 2033
- Figure 3: Asia Pacific Polyurethane Additives Industry Revenue (Million), by Type 2025 & 2033
- Figure 4: Asia Pacific Polyurethane Additives Industry Volume (K Tons), by Type 2025 & 2033
- Figure 5: Asia Pacific Polyurethane Additives Industry Revenue Share (%), by Type 2025 & 2033
- Figure 6: Asia Pacific Polyurethane Additives Industry Volume Share (%), by Type 2025 & 2033
- Figure 7: Asia Pacific Polyurethane Additives Industry Revenue (Million), by Application 2025 & 2033
- Figure 8: Asia Pacific Polyurethane Additives Industry Volume (K Tons), by Application 2025 & 2033
- Figure 9: Asia Pacific Polyurethane Additives Industry Revenue Share (%), by Application 2025 & 2033
- Figure 10: Asia Pacific Polyurethane Additives Industry Volume Share (%), by Application 2025 & 2033
- Figure 11: Asia Pacific Polyurethane Additives Industry Revenue (Million), by Country 2025 & 2033
- Figure 12: Asia Pacific Polyurethane Additives Industry Volume (K Tons), by Country 2025 & 2033
- Figure 13: Asia Pacific Polyurethane Additives Industry Revenue Share (%), by Country 2025 & 2033
- Figure 14: Asia Pacific Polyurethane Additives Industry Volume Share (%), by Country 2025 & 2033
- Figure 15: North America Polyurethane Additives Industry Revenue (Million), by Type 2025 & 2033
- Figure 16: North America Polyurethane Additives Industry Volume (K Tons), by Type 2025 & 2033
- Figure 17: North America Polyurethane Additives Industry Revenue Share (%), by Type 2025 & 2033
- Figure 18: North America Polyurethane Additives Industry Volume Share (%), by Type 2025 & 2033
- Figure 19: North America Polyurethane Additives Industry Revenue (Million), by Application 2025 & 2033
- Figure 20: North America Polyurethane Additives Industry Volume (K Tons), by Application 2025 & 2033
- Figure 21: North America Polyurethane Additives Industry Revenue Share (%), by Application 2025 & 2033
- Figure 22: North America Polyurethane Additives Industry Volume Share (%), by Application 2025 & 2033
- Figure 23: North America Polyurethane Additives Industry Revenue (Million), by Country 2025 & 2033
- Figure 24: North America Polyurethane Additives Industry Volume (K Tons), by Country 2025 & 2033
- Figure 25: North America Polyurethane Additives Industry Revenue Share (%), by Country 2025 & 2033
- Figure 26: North America Polyurethane Additives Industry Volume Share (%), by Country 2025 & 2033
- Figure 27: Europe Polyurethane Additives Industry Revenue (Million), by Type 2025 & 2033
- Figure 28: Europe Polyurethane Additives Industry Volume (K Tons), by Type 2025 & 2033
- Figure 29: Europe Polyurethane Additives Industry Revenue Share (%), by Type 2025 & 2033
- Figure 30: Europe Polyurethane Additives Industry Volume Share (%), by Type 2025 & 2033
- Figure 31: Europe Polyurethane Additives Industry Revenue (Million), by Application 2025 & 2033
- Figure 32: Europe Polyurethane Additives Industry Volume (K Tons), by Application 2025 & 2033
- Figure 33: Europe Polyurethane Additives Industry Revenue Share (%), by Application 2025 & 2033
- Figure 34: Europe Polyurethane Additives Industry Volume Share (%), by Application 2025 & 2033
- Figure 35: Europe Polyurethane Additives Industry Revenue (Million), by Country 2025 & 2033
- Figure 36: Europe Polyurethane Additives Industry Volume (K Tons), by Country 2025 & 2033
- Figure 37: Europe Polyurethane Additives Industry Revenue Share (%), by Country 2025 & 2033
- Figure 38: Europe Polyurethane Additives Industry Volume Share (%), by Country 2025 & 2033
- Figure 39: South America Polyurethane Additives Industry Revenue (Million), by Type 2025 & 2033
- Figure 40: South America Polyurethane Additives Industry Volume (K Tons), by Type 2025 & 2033
- Figure 41: South America Polyurethane Additives Industry Revenue Share (%), by Type 2025 & 2033
- Figure 42: South America Polyurethane Additives Industry Volume Share (%), by Type 2025 & 2033
- Figure 43: South America Polyurethane Additives Industry Revenue (Million), by Application 2025 & 2033
- Figure 44: South America Polyurethane Additives Industry Volume (K Tons), by Application 2025 & 2033
- Figure 45: South America Polyurethane Additives Industry Revenue Share (%), by Application 2025 & 2033
- Figure 46: South America Polyurethane Additives Industry Volume Share (%), by Application 2025 & 2033
- Figure 47: South America Polyurethane Additives Industry Revenue (Million), by Country 2025 & 2033
- Figure 48: South America Polyurethane Additives Industry Volume (K Tons), by Country 2025 & 2033
- Figure 49: South America Polyurethane Additives Industry Revenue Share (%), by Country 2025 & 2033
- Figure 50: South America Polyurethane Additives Industry Volume Share (%), by Country 2025 & 2033
- Figure 51: Middle East and Africa Polyurethane Additives Industry Revenue (Million), by Type 2025 & 2033
- Figure 52: Middle East and Africa Polyurethane Additives Industry Volume (K Tons), by Type 2025 & 2033
- Figure 53: Middle East and Africa Polyurethane Additives Industry Revenue Share (%), by Type 2025 & 2033
- Figure 54: Middle East and Africa Polyurethane Additives Industry Volume Share (%), by Type 2025 & 2033
- Figure 55: Middle East and Africa Polyurethane Additives Industry Revenue (Million), by Application 2025 & 2033
- Figure 56: Middle East and Africa Polyurethane Additives Industry Volume (K Tons), by Application 2025 & 2033
- Figure 57: Middle East and Africa Polyurethane Additives Industry Revenue Share (%), by Application 2025 & 2033
- Figure 58: Middle East and Africa Polyurethane Additives Industry Volume Share (%), by Application 2025 & 2033
- Figure 59: Middle East and Africa Polyurethane Additives Industry Revenue (Million), by Country 2025 & 2033
- Figure 60: Middle East and Africa Polyurethane Additives Industry Volume (K Tons), by Country 2025 & 2033
- Figure 61: Middle East and Africa Polyurethane Additives Industry Revenue Share (%), by Country 2025 & 2033
- Figure 62: Middle East and Africa Polyurethane Additives Industry Volume Share (%), by Country 2025 & 2033
List of Tables
- Table 1: Global Polyurethane Additives Industry Revenue Million Forecast, by Type 2020 & 2033
- Table 2: Global Polyurethane Additives Industry Volume K Tons Forecast, by Type 2020 & 2033
- Table 3: Global Polyurethane Additives Industry Revenue Million Forecast, by Application 2020 & 2033
- Table 4: Global Polyurethane Additives Industry Volume K Tons Forecast, by Application 2020 & 2033
- Table 5: Global Polyurethane Additives Industry Revenue Million Forecast, by Region 2020 & 2033
- Table 6: Global Polyurethane Additives Industry Volume K Tons Forecast, by Region 2020 & 2033
- Table 7: Global Polyurethane Additives Industry Revenue Million Forecast, by Type 2020 & 2033
- Table 8: Global Polyurethane Additives Industry Volume K Tons Forecast, by Type 2020 & 2033
- Table 9: Global Polyurethane Additives Industry Revenue Million Forecast, by Application 2020 & 2033
- Table 10: Global Polyurethane Additives Industry Volume K Tons Forecast, by Application 2020 & 2033
- Table 11: Global Polyurethane Additives Industry Revenue Million Forecast, by Country 2020 & 2033
- Table 12: Global Polyurethane Additives Industry Volume K Tons Forecast, by Country 2020 & 2033
- Table 13: China Polyurethane Additives Industry Revenue (Million) Forecast, by Application 2020 & 2033
- Table 14: China Polyurethane Additives Industry Volume (K Tons) Forecast, by Application 2020 & 2033
- Table 15: India Polyurethane Additives Industry Revenue (Million) Forecast, by Application 2020 & 2033
- Table 16: India Polyurethane Additives Industry Volume (K Tons) Forecast, by Application 2020 & 2033
- Table 17: Japan Polyurethane Additives Industry Revenue (Million) Forecast, by Application 2020 & 2033
- Table 18: Japan Polyurethane Additives Industry Volume (K Tons) Forecast, by Application 2020 & 2033
- Table 19: South Korea Polyurethane Additives Industry Revenue (Million) Forecast, by Application 2020 & 2033
- Table 20: South Korea Polyurethane Additives Industry Volume (K Tons) Forecast, by Application 2020 & 2033
- Table 21: ASEAN Countries Polyurethane Additives Industry Revenue (Million) Forecast, by Application 2020 & 2033
- Table 22: ASEAN Countries Polyurethane Additives Industry Volume (K Tons) Forecast, by Application 2020 & 2033
- Table 23: Rest of Asia Pacific Polyurethane Additives Industry Revenue (Million) Forecast, by Application 2020 & 2033
- Table 24: Rest of Asia Pacific Polyurethane Additives Industry Volume (K Tons) Forecast, by Application 2020 & 2033
- Table 25: Global Polyurethane Additives Industry Revenue Million Forecast, by Type 2020 & 2033
- Table 26: Global Polyurethane Additives Industry Volume K Tons Forecast, by Type 2020 & 2033
- Table 27: Global Polyurethane Additives Industry Revenue Million Forecast, by Application 2020 & 2033
- Table 28: Global Polyurethane Additives Industry Volume K Tons Forecast, by Application 2020 & 2033
- Table 29: Global Polyurethane Additives Industry Revenue Million Forecast, by Country 2020 & 2033
- Table 30: Global Polyurethane Additives Industry Volume K Tons Forecast, by Country 2020 & 2033
- Table 31: United States Polyurethane Additives Industry Revenue (Million) Forecast, by Application 2020 & 2033
- Table 32: United States Polyurethane Additives Industry Volume (K Tons) Forecast, by Application 2020 & 2033
- Table 33: Canada Polyurethane Additives Industry Revenue (Million) Forecast, by Application 2020 & 2033
- Table 34: Canada Polyurethane Additives Industry Volume (K Tons) Forecast, by Application 2020 & 2033
- Table 35: Mexico Polyurethane Additives Industry Revenue (Million) Forecast, by Application 2020 & 2033
- Table 36: Mexico Polyurethane Additives Industry Volume (K Tons) Forecast, by Application 2020 & 2033
- Table 37: Global Polyurethane Additives Industry Revenue Million Forecast, by Type 2020 & 2033
- Table 38: Global Polyurethane Additives Industry Volume K Tons Forecast, by Type 2020 & 2033
- Table 39: Global Polyurethane Additives Industry Revenue Million Forecast, by Application 2020 & 2033
- Table 40: Global Polyurethane Additives Industry Volume K Tons Forecast, by Application 2020 & 2033
- Table 41: Global Polyurethane Additives Industry Revenue Million Forecast, by Country 2020 & 2033
- Table 42: Global Polyurethane Additives Industry Volume K Tons Forecast, by Country 2020 & 2033
- Table 43: Germany Polyurethane Additives Industry Revenue (Million) Forecast, by Application 2020 & 2033
- Table 44: Germany Polyurethane Additives Industry Volume (K Tons) Forecast, by Application 2020 & 2033
- Table 45: United Kingdom Polyurethane Additives Industry Revenue (Million) Forecast, by Application 2020 & 2033
- Table 46: United Kingdom Polyurethane Additives Industry Volume (K Tons) Forecast, by Application 2020 & 2033
- Table 47: Italy Polyurethane Additives Industry Revenue (Million) Forecast, by Application 2020 & 2033
- Table 48: Italy Polyurethane Additives Industry Volume (K Tons) Forecast, by Application 2020 & 2033
- Table 49: France Polyurethane Additives Industry Revenue (Million) Forecast, by Application 2020 & 2033
- Table 50: France Polyurethane Additives Industry Volume (K Tons) Forecast, by Application 2020 & 2033
- Table 51: Rest of Europe Polyurethane Additives Industry Revenue (Million) Forecast, by Application 2020 & 2033
- Table 52: Rest of Europe Polyurethane Additives Industry Volume (K Tons) Forecast, by Application 2020 & 2033
- Table 53: Global Polyurethane Additives Industry Revenue Million Forecast, by Type 2020 & 2033
- Table 54: Global Polyurethane Additives Industry Volume K Tons Forecast, by Type 2020 & 2033
- Table 55: Global Polyurethane Additives Industry Revenue Million Forecast, by Application 2020 & 2033
- Table 56: Global Polyurethane Additives Industry Volume K Tons Forecast, by Application 2020 & 2033
- Table 57: Global Polyurethane Additives Industry Revenue Million Forecast, by Country 2020 & 2033
- Table 58: Global Polyurethane Additives Industry Volume K Tons Forecast, by Country 2020 & 2033
- Table 59: Brazil Polyurethane Additives Industry Revenue (Million) Forecast, by Application 2020 & 2033
- Table 60: Brazil Polyurethane Additives Industry Volume (K Tons) Forecast, by Application 2020 & 2033
- Table 61: Argentina Polyurethane Additives Industry Revenue (Million) Forecast, by Application 2020 & 2033
- Table 62: Argentina Polyurethane Additives Industry Volume (K Tons) Forecast, by Application 2020 & 2033
- Table 63: Rest of South America Polyurethane Additives Industry Revenue (Million) Forecast, by Application 2020 & 2033
- Table 64: Rest of South America Polyurethane Additives Industry Volume (K Tons) Forecast, by Application 2020 & 2033
- Table 65: Global Polyurethane Additives Industry Revenue Million Forecast, by Type 2020 & 2033
- Table 66: Global Polyurethane Additives Industry Volume K Tons Forecast, by Type 2020 & 2033
- Table 67: Global Polyurethane Additives Industry Revenue Million Forecast, by Application 2020 & 2033
- Table 68: Global Polyurethane Additives Industry Volume K Tons Forecast, by Application 2020 & 2033
- Table 69: Global Polyurethane Additives Industry Revenue Million Forecast, by Country 2020 & 2033
- Table 70: Global Polyurethane Additives Industry Volume K Tons Forecast, by Country 2020 & 2033
- Table 71: Saudi Arabia Polyurethane Additives Industry Revenue (Million) Forecast, by Application 2020 & 2033
- Table 72: Saudi Arabia Polyurethane Additives Industry Volume (K Tons) Forecast, by Application 2020 & 2033
- Table 73: South Africa Polyurethane Additives Industry Revenue (Million) Forecast, by Application 2020 & 2033
- Table 74: South Africa Polyurethane Additives Industry Volume (K Tons) Forecast, by Application 2020 & 2033
- Table 75: Rest of Middle East and Africa Polyurethane Additives Industry Revenue (Million) Forecast, by Application 2020 & 2033
- Table 76: Rest of Middle East and Africa Polyurethane Additives Industry Volume (K Tons) Forecast, by Application 2020 & 2033
Frequently Asked Questions
1. What is the projected Compound Annual Growth Rate (CAGR) of the Polyurethane Additives Industry?
The projected CAGR is approximately > 4.00%.
2. Which companies are prominent players in the Polyurethane Additives Industry?
Key companies in the market include KAO Corporation, Air Products Inc, Evonik Industries AG, Momentive Performance Materials Inc, Specialty Products Inc, BASF SE, Huntsman International LLC, GEO Specialty Chemicals Inc, Dow, Eastman Chemical Company, Covestro AG, Tosoh Corporation*List Not Exhaustive.
3. What are the main segments of the Polyurethane Additives Industry?
The market segments include Type, Application.
4. Can you provide details about the market size?
The market size is estimated to be USD 3.64 Million as of 2022.
5. What are some drivers contributing to market growth?
Rising Demand for Polyurethane in the Construction Industry; Increasing Demand from the Automotive Industry; Growing demand for sustainable Polyurethane products.
6. What are the notable trends driving market growth?
Increasing Demand from the Automotive Industry.
7. Are there any restraints impacting market growth?
Availability of Alternative Additives; Stringent Government Regulations.
8. Can you provide examples of recent developments in the market?
August 2023: Marelli has developed a new lightweight polyurethane foam that can be applied to all foam-in-place (FIP) applications, particularly the main dashboard panel. This achievement is the result of a joint development with materials partner Covestro AG.
9. What pricing options are available for accessing the report?
Pricing options include single-user, multi-user, and enterprise licenses priced at USD 4750, USD 5250, and USD 8750 respectively.
10. Is the market size provided in terms of value or volume?
The market size is provided in terms of value, measured in Million and volume, measured in K Tons.
11. Are there any specific market keywords associated with the report?
Yes, the market keyword associated with the report is "Polyurethane Additives Industry," which aids in identifying and referencing the specific market segment covered.
12. How do I determine which pricing option suits my needs best?
The pricing options vary based on user requirements and access needs. Individual users may opt for single-user licenses, while businesses requiring broader access may choose multi-user or enterprise licenses for cost-effective access to the report.
13. Are there any additional resources or data provided in the Polyurethane Additives Industry report?
While the report offers comprehensive insights, it's advisable to review the specific contents or supplementary materials provided to ascertain if additional resources or data are available.
14. How can I stay updated on further developments or reports in the Polyurethane Additives Industry?
To stay informed about further developments, trends, and reports in the Polyurethane Additives Industry, consider subscribing to industry newsletters, following relevant companies and organizations, or regularly checking reputable industry news sources and publications.
Methodology
Step 1 - Identification of Relevant Samples Size from Population Database


Step 2 - Approaches for Defining Global Market Size (Value, Volume* & Price*)

Note*: In applicable scenarios
Step 3 - Data Sources
Primary Research
- Web Analytics
- Survey Reports
- Research Institute
- Latest Research Reports
- Opinion Leaders
Secondary Research
- Annual Reports
- White Paper
- Latest Press Release
- Industry Association
- Paid Database
- Investor Presentations

Step 4 - Data Triangulation
Involves using different sources of information in order to increase the validity of a study
These sources are likely to be stakeholders in a program - participants, other researchers, program staff, other community members, and so on.
Then we put all data in single framework & apply various statistical tools to find out the dynamic on the market.
During the analysis stage, feedback from the stakeholder groups would be compared to determine areas of agreement as well as areas of divergence