
Key Insights
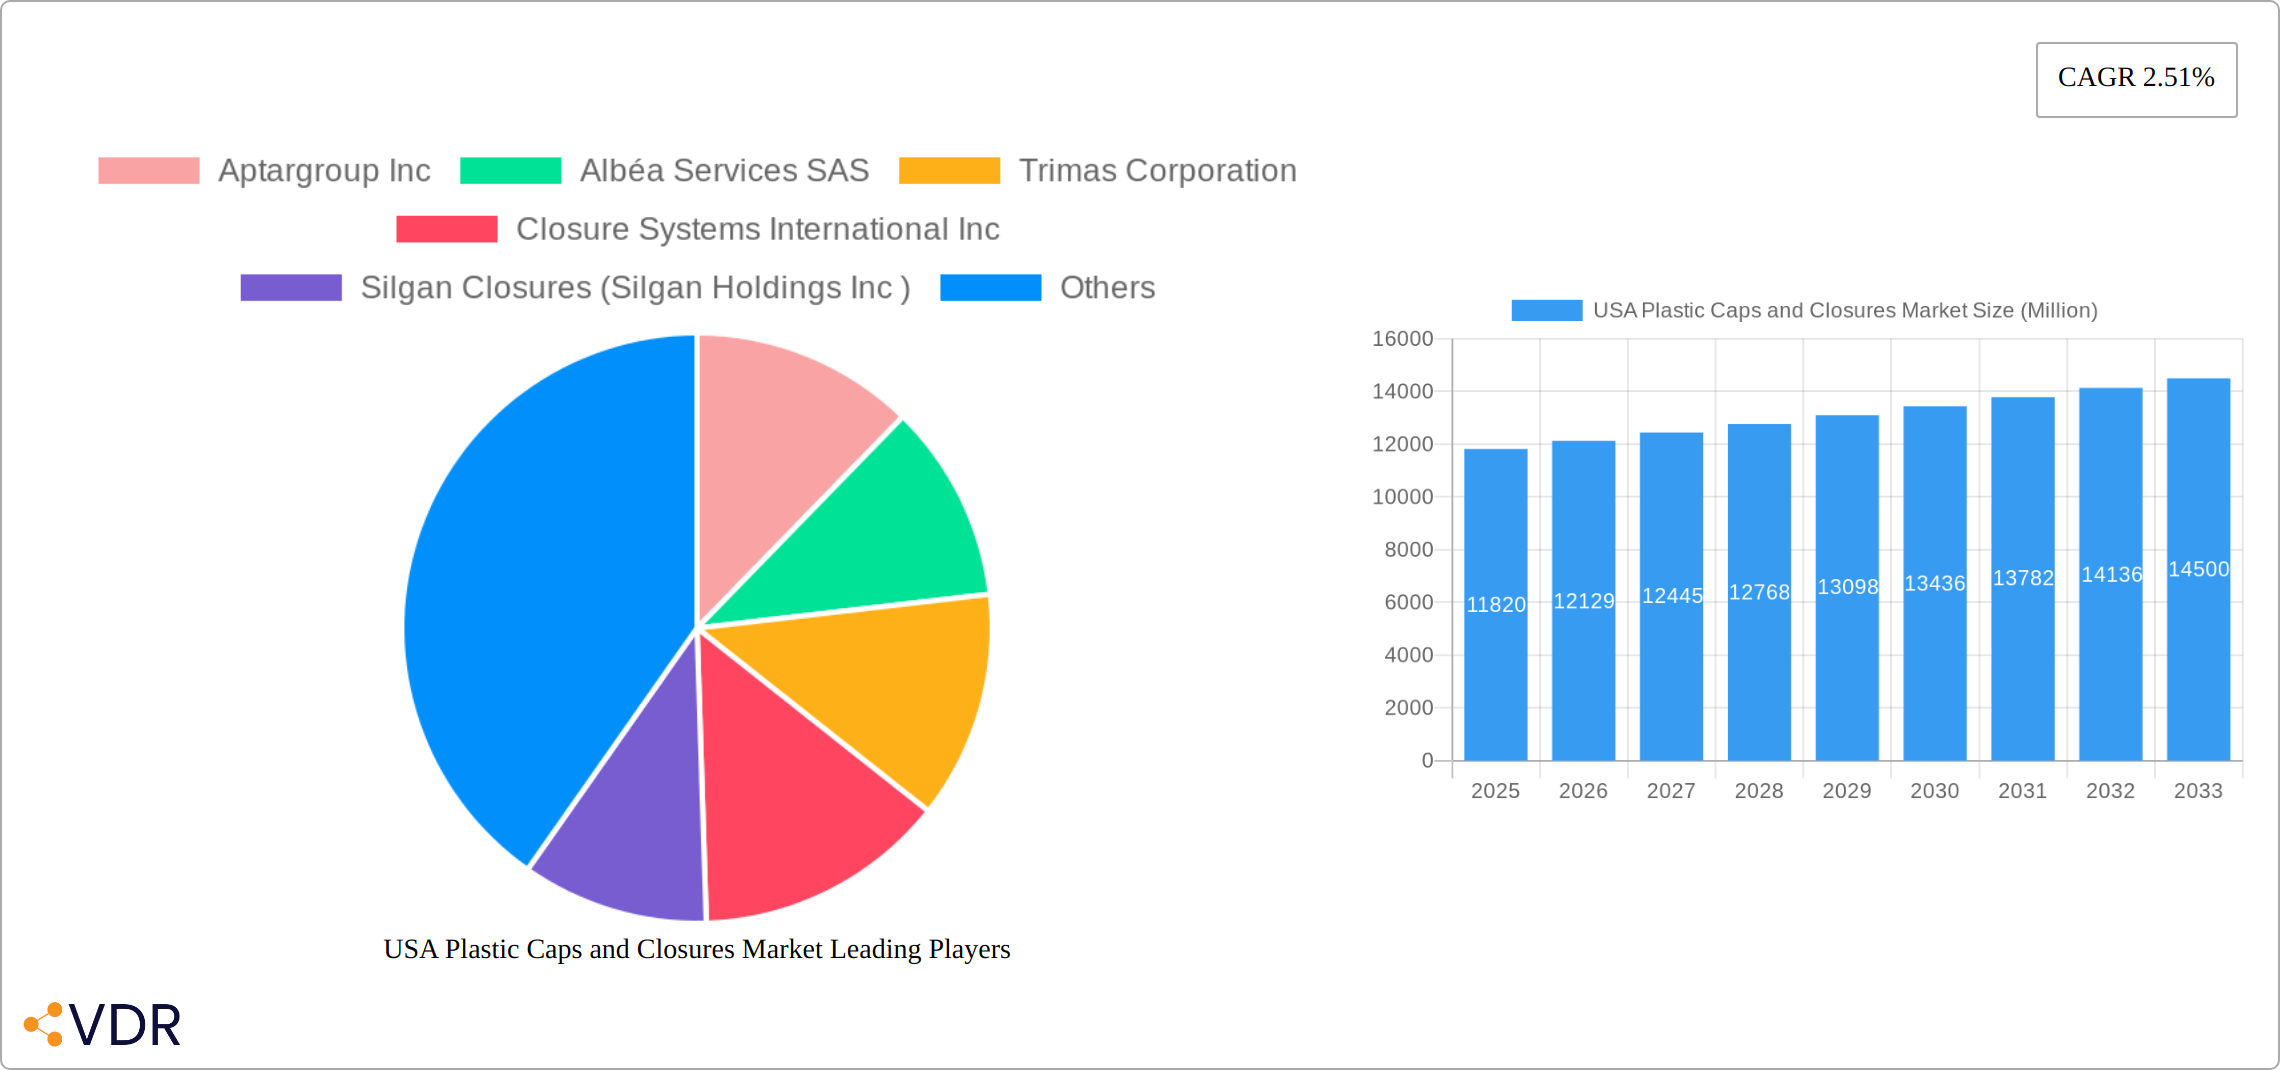
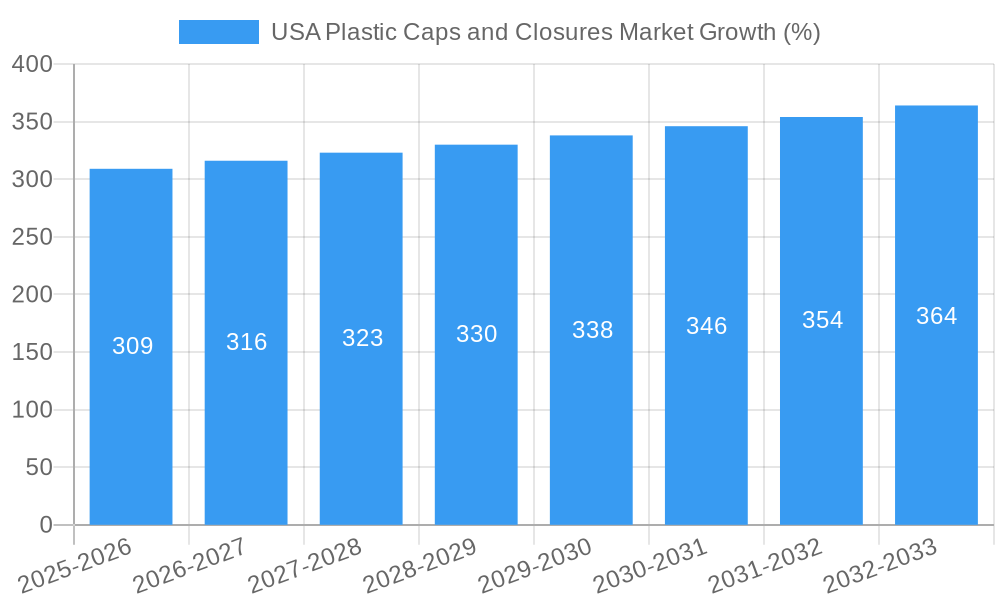
The United States plastic caps and closures market, valued at $11.82 billion in 2025, is projected to experience steady growth, driven by the robust demand across various end-use industries. A compound annual growth rate (CAGR) of 2.51% is anticipated from 2025 to 2033, indicating a market size exceeding $15 billion by the end of the forecast period. This growth is fueled by several key factors. The burgeoning food and beverage industry, coupled with the rising demand for convenient packaging solutions, is a significant driver. The pharmaceutical and healthcare sector also contributes substantially, requiring tamper-evident and child-resistant closures for safety and regulatory compliance. Furthermore, the cosmetics and toiletries industry's continuous innovation and expansion are bolstering demand for aesthetically pleasing and functional closures. Increased consumer preference for single-serve and convenient packaging formats further fuels market expansion. While material price fluctuations and environmental concerns related to plastic waste pose potential restraints, the industry is actively exploring sustainable alternatives, such as biodegradable and recycled plastics, to mitigate these challenges. Segmentation reveals polyethylene (PE), polyethylene terephthalate (PET), and polypropylene (PP) as dominant raw materials, with threaded and dispensing caps leading in the type segment. Key players like Aptargroup Inc., Albéa Services SAS, and Silgan Closures are driving innovation and market competition through product diversification and strategic partnerships.
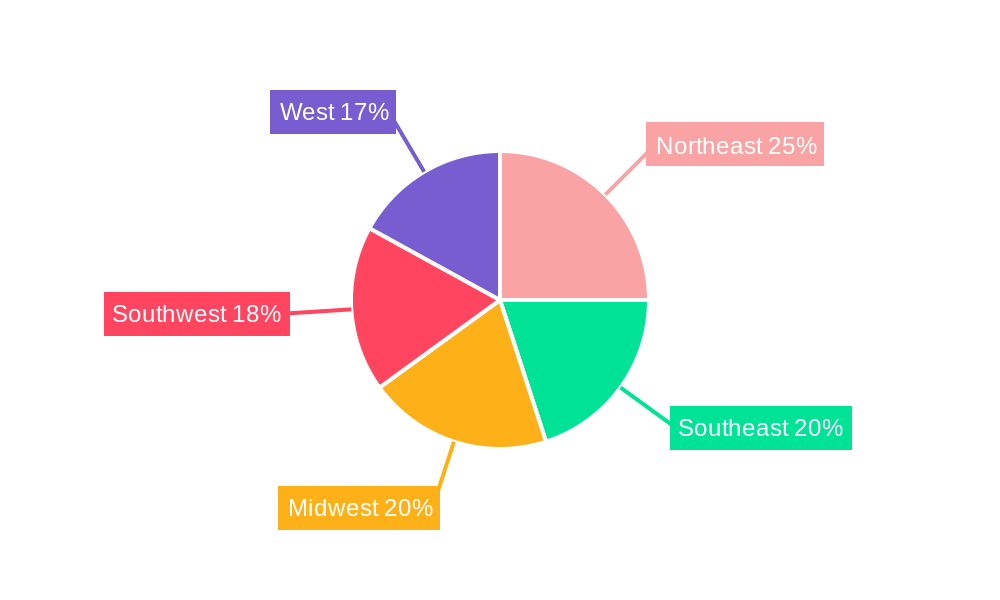
Regional analysis within the US reveals varying market dynamics across different regions. While precise data for individual states (Northeast, Southeast, Midwest, Southwest, West) is unavailable, it is reasonable to assume a concentration in regions with higher population density and robust manufacturing sectors. The Northeast and West Coast, for example, are likely to hold larger market shares due to high concentrations of food and beverage companies and other significant end-use industries. Future growth will be influenced by factors like consumer purchasing patterns, evolving packaging regulations, and advancements in closure technology. The market’s expansion is expected to remain steady, propelled by consistent demand from core sectors and the ongoing development of innovative, sustainable packaging solutions.
USA Plastic Caps and Closures Market: A Comprehensive Report (2019-2033)
This comprehensive report provides an in-depth analysis of the USA plastic caps and closures market, encompassing market dynamics, growth trends, regional performance, product landscape, and key players. With a study period spanning 2019-2033, a base year of 2025, and a forecast period of 2025-2033, this report offers invaluable insights for industry professionals, investors, and strategic decision-makers. The report covers the parent market of packaging and the child market of plastic caps and closures, offering a granular view of this dynamic sector. The market size is projected to reach xx Million units by 2033.
USA Plastic Caps and Closures Market Market Dynamics & Structure
The USA plastic caps and closures market is characterized by a moderately consolidated structure with several major players controlling significant market share. Market concentration is influenced by factors such as economies of scale, technological expertise, and brand recognition. Technological innovation, particularly in sustainable and lightweight materials, is a key driver, while stringent environmental regulations and consumer preference for eco-friendly packaging pose both challenges and opportunities. The market is further shaped by the availability of substitute materials (e.g., metal, glass) and evolving end-user demographics. Mergers and acquisitions (M&A) activity remains a prominent feature, with larger companies seeking to expand their product portfolios and geographical reach.
- Market Concentration: Moderately consolidated, with top 10 players holding approximately xx% market share in 2024.
- Technological Innovation: Focus on lightweight designs, sustainable materials (recycled content), and improved sealing technologies.
- Regulatory Framework: Stringent regulations concerning recyclability, material composition, and food safety are driving innovation.
- Competitive Product Substitutes: Metal and glass closures present competition, particularly in specific applications.
- End-User Demographics: Shifting consumer preferences towards convenience, sustainability, and premium packaging influence demand.
- M&A Trends: Significant M&A activity observed in recent years, with an estimated xx deals completed between 2019 and 2024, driven by consolidation and expansion strategies.
USA Plastic Caps and Closures Market Growth Trends & Insights
The USA plastic caps and closures market experienced steady growth during the historical period (2019-2024), driven by factors such as increasing demand for packaged goods across various end-use sectors. The market is projected to continue its growth trajectory throughout the forecast period (2025-2033), exhibiting a Compound Annual Growth Rate (CAGR) of xx% during this period. This growth is fueled by a combination of factors including rising consumer spending on packaged food, beverages, pharmaceuticals, and personal care products. The adoption rate of innovative closures, such as tamper-evident and child-resistant caps, is also contributing to market expansion. Technological disruptions, such as the introduction of sustainable materials and advanced manufacturing processes, are expected to further accelerate market growth. Changes in consumer behavior, particularly a growing preference for convenience and eco-friendly packaging, are also shaping market trends. Market penetration of specific closure types, such as threaded closures, remains high, while demand for specialized closures, like dispensing caps, is growing rapidly.
Dominant Regions, Countries, or Segments in USA Plastic Caps and Closures Market
The market is geographically diverse, with growth distributed across various regions. However, the [Specific Region - e.g., Northeast] region holds the largest market share due to high population density and established manufacturing hubs. Within the segmentation:
By Raw Material: Polyethylene (PE) dominates the market due to its cost-effectiveness, versatility, and recyclability. Polypropylene (PP) also holds a significant share, particularly in applications requiring higher temperature resistance.
By Type: Threaded closures account for the largest segment share due to their widespread use across various applications. However, the child-resistant and dispensing segments are exhibiting the highest growth rates driven by rising safety concerns and convenience needs.
By Application: The food and beverage sector is the largest end-use segment, followed by pharmaceutical and healthcare, and cosmetics and toiletries. Growth within the food and beverage sector is influenced by increasing demand for convenience foods and beverages in ready-to-eat/drink formats.
- Key Drivers (Regional): Strong manufacturing base, high population density, robust economic activity, and developed infrastructure.
- Key Drivers (Segment): Demand for convenience, safety, and sustainability drives specific segment growth.
USA Plastic Caps and Closures Market Product Landscape
The market offers a wide array of products tailored to diverse applications. Innovation focuses on lightweighting, enhanced barrier properties, improved sealing performance, and sustainable material usage. Many manufacturers are incorporating recycled content into their offerings, while others are developing closures with innovative designs and functionalities. Recent advancements include easy-open features, improved dispensing mechanisms, and tamper-evident designs, adding value for both manufacturers and consumers.
Key Drivers, Barriers & Challenges in USA Plastic Caps and Closures Market
Key Drivers: Growing demand for packaged goods, rising disposable incomes, technological advancements leading to innovative closures, and stringent regulations promoting sustainable practices are key drivers.
Challenges & Restraints: Fluctuations in raw material prices, competition from alternative packaging materials, environmental concerns related to plastic waste, and stringent regulatory compliance requirements present significant challenges. The impact of these challenges varies across segments; for example, the increasing cost of raw materials affects profitability margins, while stringent regulations necessitate investments in R&D for compliant products. Supply chain disruptions and geopolitical factors can also impact market stability.
Emerging Opportunities in USA Plastic Caps and Closures Market
Emerging opportunities lie in developing sustainable and eco-friendly solutions, exploring innovative materials such as bioplastics, catering to niche applications with specialized closures, and tapping into growing markets like personalized packaging. The increasing adoption of e-commerce is also creating opportunities for specialized closures designed for online packaging.
Growth Accelerators in the USA Plastic Caps and Closures Market Industry
Strategic partnerships and collaborations between material suppliers, closure manufacturers, and brand owners are accelerating growth. Technological breakthroughs in material science and manufacturing processes are enabling the development of more sustainable and efficient closures. Market expansion into new geographies and application areas will drive further growth.
Key Players Shaping the USA Plastic Caps and Closures Market Market
- Aptargroup Inc
- Albéa Services SAS
- Trimas Corporation
- Closure Systems International Inc
- Silgan Closures (Silgan Holdings Inc)
- O Berk Company LLC
- Bericap Holding
- Guala Closures Group (Guala Pack SPA)
- Tetra Pak International SA
- Berry Global Inc
- MJS Packaging
- Amcor Ltd
Notable Milestones in USA Plastic Caps and Closures Market Sector
- October 2023: Berry Global launches lightweight PE tube closures, promoting sustainability and driving demand for PE resin.
- May 2023: Closed Loop Partners secures USD 10 million investment to promote PE and PP recycling, boosting the circular economy.
In-Depth USA Plastic Caps and Closures Market Market Outlook
The USA plastic caps and closures market holds significant growth potential driven by continuous innovation, increasing demand from diverse end-use sectors, and the growing emphasis on sustainable packaging solutions. Strategic partnerships, technological advancements, and market expansion into untapped segments present significant opportunities for players in the market. The focus on lightweight, recyclable, and functional closures will continue to shape the future of this dynamic sector.
USA Plastic Caps and Closures Market Segmentation
-
1. Raw Material
- 1.1. Polyethylene (PE)
- 1.2. Polyethylene Terephthalate (PET)
- 1.3. Polypropylene (PP)
- 1.4. Other Materials (Polystyrene and PVC)
-
2. Type
- 2.1. Threaded
- 2.2. Dispensing
- 2.3. Unthreaded
- 2.4. Child-resistant
-
3. Application
- 3.1. Food
- 3.2. Pharmaceutical and Healthcare
- 3.3. Beverage
- 3.4. Cosmetics and Toiletries
- 3.5. Household Chemicals
- 3.6. Other Applications
USA Plastic Caps and Closures Market Segmentation By Geography
-
1. North America
- 1.1. United States
- 1.2. Canada
- 1.3. Mexico
-
2. South America
- 2.1. Brazil
- 2.2. Argentina
- 2.3. Rest of South America
-
3. Europe
- 3.1. United Kingdom
- 3.2. Germany
- 3.3. France
- 3.4. Italy
- 3.5. Spain
- 3.6. Russia
- 3.7. Benelux
- 3.8. Nordics
- 3.9. Rest of Europe
-
4. Middle East & Africa
- 4.1. Turkey
- 4.2. Israel
- 4.3. GCC
- 4.4. North Africa
- 4.5. South Africa
- 4.6. Rest of Middle East & Africa
-
5. Asia Pacific
- 5.1. China
- 5.2. India
- 5.3. Japan
- 5.4. South Korea
- 5.5. ASEAN
- 5.6. Oceania
- 5.7. Rest of Asia Pacific
USA Plastic Caps and Closures Market REPORT HIGHLIGHTS
| Aspects | Details |
|---|---|
| Study Period | 2019-2033 |
| Base Year | 2024 |
| Estimated Year | 2025 |
| Forecast Period | 2025-2033 |
| Historical Period | 2019-2024 |
| Growth Rate | CAGR of 2.51% from 2019-2033 |
| Segmentation |
|
Table of Contents
- 1. Introduction
- 1.1. Research Scope
- 1.2. Market Segmentation
- 1.3. Research Methodology
- 1.4. Definitions and Assumptions
- 2. Executive Summary
- 2.1. Introduction
- 3. Market Dynamics
- 3.1. Introduction
- 3.2. Market Drivers
- 3.2.1. Demand for Packaged Food and Pharmaceutical Drugs; Increasing Demand from Small and Medium-Scale End-user Industries
- 3.3. Market Restrains
- 3.3.1. Increasing Price Volatility of Raw Materials
- 3.4. Market Trends
- 3.4.1. Polyethylene (PE) to be the Fastest Growing Raw Material Segment
- 4. Market Factor Analysis
- 4.1. Porters Five Forces
- 4.2. Supply/Value Chain
- 4.3. PESTEL analysis
- 4.4. Market Entropy
- 4.5. Patent/Trademark Analysis
- 5. Global USA Plastic Caps and Closures Market Analysis, Insights and Forecast, 2019-2031
- 5.1. Market Analysis, Insights and Forecast - by Raw Material
- 5.1.1. Polyethylene (PE)
- 5.1.2. Polyethylene Terephthalate (PET)
- 5.1.3. Polypropylene (PP)
- 5.1.4. Other Materials (Polystyrene and PVC)
- 5.2. Market Analysis, Insights and Forecast - by Type
- 5.2.1. Threaded
- 5.2.2. Dispensing
- 5.2.3. Unthreaded
- 5.2.4. Child-resistant
- 5.3. Market Analysis, Insights and Forecast - by Application
- 5.3.1. Food
- 5.3.2. Pharmaceutical and Healthcare
- 5.3.3. Beverage
- 5.3.4. Cosmetics and Toiletries
- 5.3.5. Household Chemicals
- 5.3.6. Other Applications
- 5.4. Market Analysis, Insights and Forecast - by Region
- 5.4.1. North America
- 5.4.2. South America
- 5.4.3. Europe
- 5.4.4. Middle East & Africa
- 5.4.5. Asia Pacific
- 5.1. Market Analysis, Insights and Forecast - by Raw Material
- 6. North America USA Plastic Caps and Closures Market Analysis, Insights and Forecast, 2019-2031
- 6.1. Market Analysis, Insights and Forecast - by Raw Material
- 6.1.1. Polyethylene (PE)
- 6.1.2. Polyethylene Terephthalate (PET)
- 6.1.3. Polypropylene (PP)
- 6.1.4. Other Materials (Polystyrene and PVC)
- 6.2. Market Analysis, Insights and Forecast - by Type
- 6.2.1. Threaded
- 6.2.2. Dispensing
- 6.2.3. Unthreaded
- 6.2.4. Child-resistant
- 6.3. Market Analysis, Insights and Forecast - by Application
- 6.3.1. Food
- 6.3.2. Pharmaceutical and Healthcare
- 6.3.3. Beverage
- 6.3.4. Cosmetics and Toiletries
- 6.3.5. Household Chemicals
- 6.3.6. Other Applications
- 6.1. Market Analysis, Insights and Forecast - by Raw Material
- 7. South America USA Plastic Caps and Closures Market Analysis, Insights and Forecast, 2019-2031
- 7.1. Market Analysis, Insights and Forecast - by Raw Material
- 7.1.1. Polyethylene (PE)
- 7.1.2. Polyethylene Terephthalate (PET)
- 7.1.3. Polypropylene (PP)
- 7.1.4. Other Materials (Polystyrene and PVC)
- 7.2. Market Analysis, Insights and Forecast - by Type
- 7.2.1. Threaded
- 7.2.2. Dispensing
- 7.2.3. Unthreaded
- 7.2.4. Child-resistant
- 7.3. Market Analysis, Insights and Forecast - by Application
- 7.3.1. Food
- 7.3.2. Pharmaceutical and Healthcare
- 7.3.3. Beverage
- 7.3.4. Cosmetics and Toiletries
- 7.3.5. Household Chemicals
- 7.3.6. Other Applications
- 7.1. Market Analysis, Insights and Forecast - by Raw Material
- 8. Europe USA Plastic Caps and Closures Market Analysis, Insights and Forecast, 2019-2031
- 8.1. Market Analysis, Insights and Forecast - by Raw Material
- 8.1.1. Polyethylene (PE)
- 8.1.2. Polyethylene Terephthalate (PET)
- 8.1.3. Polypropylene (PP)
- 8.1.4. Other Materials (Polystyrene and PVC)
- 8.2. Market Analysis, Insights and Forecast - by Type
- 8.2.1. Threaded
- 8.2.2. Dispensing
- 8.2.3. Unthreaded
- 8.2.4. Child-resistant
- 8.3. Market Analysis, Insights and Forecast - by Application
- 8.3.1. Food
- 8.3.2. Pharmaceutical and Healthcare
- 8.3.3. Beverage
- 8.3.4. Cosmetics and Toiletries
- 8.3.5. Household Chemicals
- 8.3.6. Other Applications
- 8.1. Market Analysis, Insights and Forecast - by Raw Material
- 9. Middle East & Africa USA Plastic Caps and Closures Market Analysis, Insights and Forecast, 2019-2031
- 9.1. Market Analysis, Insights and Forecast - by Raw Material
- 9.1.1. Polyethylene (PE)
- 9.1.2. Polyethylene Terephthalate (PET)
- 9.1.3. Polypropylene (PP)
- 9.1.4. Other Materials (Polystyrene and PVC)
- 9.2. Market Analysis, Insights and Forecast - by Type
- 9.2.1. Threaded
- 9.2.2. Dispensing
- 9.2.3. Unthreaded
- 9.2.4. Child-resistant
- 9.3. Market Analysis, Insights and Forecast - by Application
- 9.3.1. Food
- 9.3.2. Pharmaceutical and Healthcare
- 9.3.3. Beverage
- 9.3.4. Cosmetics and Toiletries
- 9.3.5. Household Chemicals
- 9.3.6. Other Applications
- 9.1. Market Analysis, Insights and Forecast - by Raw Material
- 10. Asia Pacific USA Plastic Caps and Closures Market Analysis, Insights and Forecast, 2019-2031
- 10.1. Market Analysis, Insights and Forecast - by Raw Material
- 10.1.1. Polyethylene (PE)
- 10.1.2. Polyethylene Terephthalate (PET)
- 10.1.3. Polypropylene (PP)
- 10.1.4. Other Materials (Polystyrene and PVC)
- 10.2. Market Analysis, Insights and Forecast - by Type
- 10.2.1. Threaded
- 10.2.2. Dispensing
- 10.2.3. Unthreaded
- 10.2.4. Child-resistant
- 10.3. Market Analysis, Insights and Forecast - by Application
- 10.3.1. Food
- 10.3.2. Pharmaceutical and Healthcare
- 10.3.3. Beverage
- 10.3.4. Cosmetics and Toiletries
- 10.3.5. Household Chemicals
- 10.3.6. Other Applications
- 10.1. Market Analysis, Insights and Forecast - by Raw Material
- 11. Northeast USA Plastic Caps and Closures Market Analysis, Insights and Forecast, 2019-2031
- 12. Southeast USA Plastic Caps and Closures Market Analysis, Insights and Forecast, 2019-2031
- 13. Midwest USA Plastic Caps and Closures Market Analysis, Insights and Forecast, 2019-2031
- 14. Southwest USA Plastic Caps and Closures Market Analysis, Insights and Forecast, 2019-2031
- 15. West USA Plastic Caps and Closures Market Analysis, Insights and Forecast, 2019-2031
- 16. Competitive Analysis
- 16.1. Global Market Share Analysis 2024
- 16.2. Company Profiles
- 16.2.1 Aptargroup Inc
- 16.2.1.1. Overview
- 16.2.1.2. Products
- 16.2.1.3. SWOT Analysis
- 16.2.1.4. Recent Developments
- 16.2.1.5. Financials (Based on Availability)
- 16.2.2 Albéa Services SAS
- 16.2.2.1. Overview
- 16.2.2.2. Products
- 16.2.2.3. SWOT Analysis
- 16.2.2.4. Recent Developments
- 16.2.2.5. Financials (Based on Availability)
- 16.2.3 Trimas Corporation
- 16.2.3.1. Overview
- 16.2.3.2. Products
- 16.2.3.3. SWOT Analysis
- 16.2.3.4. Recent Developments
- 16.2.3.5. Financials (Based on Availability)
- 16.2.4 Closure Systems International Inc
- 16.2.4.1. Overview
- 16.2.4.2. Products
- 16.2.4.3. SWOT Analysis
- 16.2.4.4. Recent Developments
- 16.2.4.5. Financials (Based on Availability)
- 16.2.5 Silgan Closures (Silgan Holdings Inc )
- 16.2.5.1. Overview
- 16.2.5.2. Products
- 16.2.5.3. SWOT Analysis
- 16.2.5.4. Recent Developments
- 16.2.5.5. Financials (Based on Availability)
- 16.2.6 O Berk Company LLC
- 16.2.6.1. Overview
- 16.2.6.2. Products
- 16.2.6.3. SWOT Analysis
- 16.2.6.4. Recent Developments
- 16.2.6.5. Financials (Based on Availability)
- 16.2.7 Bericap Holding*List Not Exhaustive
- 16.2.7.1. Overview
- 16.2.7.2. Products
- 16.2.7.3. SWOT Analysis
- 16.2.7.4. Recent Developments
- 16.2.7.5. Financials (Based on Availability)
- 16.2.8 Guala Closures Group (Guala Pack SPA)
- 16.2.8.1. Overview
- 16.2.8.2. Products
- 16.2.8.3. SWOT Analysis
- 16.2.8.4. Recent Developments
- 16.2.8.5. Financials (Based on Availability)
- 16.2.9 Tetra Pak International SA
- 16.2.9.1. Overview
- 16.2.9.2. Products
- 16.2.9.3. SWOT Analysis
- 16.2.9.4. Recent Developments
- 16.2.9.5. Financials (Based on Availability)
- 16.2.10 Berry Global Inc
- 16.2.10.1. Overview
- 16.2.10.2. Products
- 16.2.10.3. SWOT Analysis
- 16.2.10.4. Recent Developments
- 16.2.10.5. Financials (Based on Availability)
- 16.2.11 MJS Packaging
- 16.2.11.1. Overview
- 16.2.11.2. Products
- 16.2.11.3. SWOT Analysis
- 16.2.11.4. Recent Developments
- 16.2.11.5. Financials (Based on Availability)
- 16.2.12 Amcor Ltd
- 16.2.12.1. Overview
- 16.2.12.2. Products
- 16.2.12.3. SWOT Analysis
- 16.2.12.4. Recent Developments
- 16.2.12.5. Financials (Based on Availability)
- 16.2.1 Aptargroup Inc
List of Figures
- Figure 1: Global USA Plastic Caps and Closures Market Revenue Breakdown (Million, %) by Region 2024 & 2032
- Figure 2: United states USA Plastic Caps and Closures Market Revenue (Million), by Country 2024 & 2032
- Figure 3: United states USA Plastic Caps and Closures Market Revenue Share (%), by Country 2024 & 2032
- Figure 4: North America USA Plastic Caps and Closures Market Revenue (Million), by Raw Material 2024 & 2032
- Figure 5: North America USA Plastic Caps and Closures Market Revenue Share (%), by Raw Material 2024 & 2032
- Figure 6: North America USA Plastic Caps and Closures Market Revenue (Million), by Type 2024 & 2032
- Figure 7: North America USA Plastic Caps and Closures Market Revenue Share (%), by Type 2024 & 2032
- Figure 8: North America USA Plastic Caps and Closures Market Revenue (Million), by Application 2024 & 2032
- Figure 9: North America USA Plastic Caps and Closures Market Revenue Share (%), by Application 2024 & 2032
- Figure 10: North America USA Plastic Caps and Closures Market Revenue (Million), by Country 2024 & 2032
- Figure 11: North America USA Plastic Caps and Closures Market Revenue Share (%), by Country 2024 & 2032
- Figure 12: South America USA Plastic Caps and Closures Market Revenue (Million), by Raw Material 2024 & 2032
- Figure 13: South America USA Plastic Caps and Closures Market Revenue Share (%), by Raw Material 2024 & 2032
- Figure 14: South America USA Plastic Caps and Closures Market Revenue (Million), by Type 2024 & 2032
- Figure 15: South America USA Plastic Caps and Closures Market Revenue Share (%), by Type 2024 & 2032
- Figure 16: South America USA Plastic Caps and Closures Market Revenue (Million), by Application 2024 & 2032
- Figure 17: South America USA Plastic Caps and Closures Market Revenue Share (%), by Application 2024 & 2032
- Figure 18: South America USA Plastic Caps and Closures Market Revenue (Million), by Country 2024 & 2032
- Figure 19: South America USA Plastic Caps and Closures Market Revenue Share (%), by Country 2024 & 2032
- Figure 20: Europe USA Plastic Caps and Closures Market Revenue (Million), by Raw Material 2024 & 2032
- Figure 21: Europe USA Plastic Caps and Closures Market Revenue Share (%), by Raw Material 2024 & 2032
- Figure 22: Europe USA Plastic Caps and Closures Market Revenue (Million), by Type 2024 & 2032
- Figure 23: Europe USA Plastic Caps and Closures Market Revenue Share (%), by Type 2024 & 2032
- Figure 24: Europe USA Plastic Caps and Closures Market Revenue (Million), by Application 2024 & 2032
- Figure 25: Europe USA Plastic Caps and Closures Market Revenue Share (%), by Application 2024 & 2032
- Figure 26: Europe USA Plastic Caps and Closures Market Revenue (Million), by Country 2024 & 2032
- Figure 27: Europe USA Plastic Caps and Closures Market Revenue Share (%), by Country 2024 & 2032
- Figure 28: Middle East & Africa USA Plastic Caps and Closures Market Revenue (Million), by Raw Material 2024 & 2032
- Figure 29: Middle East & Africa USA Plastic Caps and Closures Market Revenue Share (%), by Raw Material 2024 & 2032
- Figure 30: Middle East & Africa USA Plastic Caps and Closures Market Revenue (Million), by Type 2024 & 2032
- Figure 31: Middle East & Africa USA Plastic Caps and Closures Market Revenue Share (%), by Type 2024 & 2032
- Figure 32: Middle East & Africa USA Plastic Caps and Closures Market Revenue (Million), by Application 2024 & 2032
- Figure 33: Middle East & Africa USA Plastic Caps and Closures Market Revenue Share (%), by Application 2024 & 2032
- Figure 34: Middle East & Africa USA Plastic Caps and Closures Market Revenue (Million), by Country 2024 & 2032
- Figure 35: Middle East & Africa USA Plastic Caps and Closures Market Revenue Share (%), by Country 2024 & 2032
- Figure 36: Asia Pacific USA Plastic Caps and Closures Market Revenue (Million), by Raw Material 2024 & 2032
- Figure 37: Asia Pacific USA Plastic Caps and Closures Market Revenue Share (%), by Raw Material 2024 & 2032
- Figure 38: Asia Pacific USA Plastic Caps and Closures Market Revenue (Million), by Type 2024 & 2032
- Figure 39: Asia Pacific USA Plastic Caps and Closures Market Revenue Share (%), by Type 2024 & 2032
- Figure 40: Asia Pacific USA Plastic Caps and Closures Market Revenue (Million), by Application 2024 & 2032
- Figure 41: Asia Pacific USA Plastic Caps and Closures Market Revenue Share (%), by Application 2024 & 2032
- Figure 42: Asia Pacific USA Plastic Caps and Closures Market Revenue (Million), by Country 2024 & 2032
- Figure 43: Asia Pacific USA Plastic Caps and Closures Market Revenue Share (%), by Country 2024 & 2032
List of Tables
- Table 1: Global USA Plastic Caps and Closures Market Revenue Million Forecast, by Region 2019 & 2032
- Table 2: Global USA Plastic Caps and Closures Market Revenue Million Forecast, by Raw Material 2019 & 2032
- Table 3: Global USA Plastic Caps and Closures Market Revenue Million Forecast, by Type 2019 & 2032
- Table 4: Global USA Plastic Caps and Closures Market Revenue Million Forecast, by Application 2019 & 2032
- Table 5: Global USA Plastic Caps and Closures Market Revenue Million Forecast, by Region 2019 & 2032
- Table 6: Global USA Plastic Caps and Closures Market Revenue Million Forecast, by Country 2019 & 2032
- Table 7: Northeast USA Plastic Caps and Closures Market Revenue (Million) Forecast, by Application 2019 & 2032
- Table 8: Southeast USA Plastic Caps and Closures Market Revenue (Million) Forecast, by Application 2019 & 2032
- Table 9: Midwest USA Plastic Caps and Closures Market Revenue (Million) Forecast, by Application 2019 & 2032
- Table 10: Southwest USA Plastic Caps and Closures Market Revenue (Million) Forecast, by Application 2019 & 2032
- Table 11: West USA Plastic Caps and Closures Market Revenue (Million) Forecast, by Application 2019 & 2032
- Table 12: Global USA Plastic Caps and Closures Market Revenue Million Forecast, by Raw Material 2019 & 2032
- Table 13: Global USA Plastic Caps and Closures Market Revenue Million Forecast, by Type 2019 & 2032
- Table 14: Global USA Plastic Caps and Closures Market Revenue Million Forecast, by Application 2019 & 2032
- Table 15: Global USA Plastic Caps and Closures Market Revenue Million Forecast, by Country 2019 & 2032
- Table 16: United States USA Plastic Caps and Closures Market Revenue (Million) Forecast, by Application 2019 & 2032
- Table 17: Canada USA Plastic Caps and Closures Market Revenue (Million) Forecast, by Application 2019 & 2032
- Table 18: Mexico USA Plastic Caps and Closures Market Revenue (Million) Forecast, by Application 2019 & 2032
- Table 19: Global USA Plastic Caps and Closures Market Revenue Million Forecast, by Raw Material 2019 & 2032
- Table 20: Global USA Plastic Caps and Closures Market Revenue Million Forecast, by Type 2019 & 2032
- Table 21: Global USA Plastic Caps and Closures Market Revenue Million Forecast, by Application 2019 & 2032
- Table 22: Global USA Plastic Caps and Closures Market Revenue Million Forecast, by Country 2019 & 2032
- Table 23: Brazil USA Plastic Caps and Closures Market Revenue (Million) Forecast, by Application 2019 & 2032
- Table 24: Argentina USA Plastic Caps and Closures Market Revenue (Million) Forecast, by Application 2019 & 2032
- Table 25: Rest of South America USA Plastic Caps and Closures Market Revenue (Million) Forecast, by Application 2019 & 2032
- Table 26: Global USA Plastic Caps and Closures Market Revenue Million Forecast, by Raw Material 2019 & 2032
- Table 27: Global USA Plastic Caps and Closures Market Revenue Million Forecast, by Type 2019 & 2032
- Table 28: Global USA Plastic Caps and Closures Market Revenue Million Forecast, by Application 2019 & 2032
- Table 29: Global USA Plastic Caps and Closures Market Revenue Million Forecast, by Country 2019 & 2032
- Table 30: United Kingdom USA Plastic Caps and Closures Market Revenue (Million) Forecast, by Application 2019 & 2032
- Table 31: Germany USA Plastic Caps and Closures Market Revenue (Million) Forecast, by Application 2019 & 2032
- Table 32: France USA Plastic Caps and Closures Market Revenue (Million) Forecast, by Application 2019 & 2032
- Table 33: Italy USA Plastic Caps and Closures Market Revenue (Million) Forecast, by Application 2019 & 2032
- Table 34: Spain USA Plastic Caps and Closures Market Revenue (Million) Forecast, by Application 2019 & 2032
- Table 35: Russia USA Plastic Caps and Closures Market Revenue (Million) Forecast, by Application 2019 & 2032
- Table 36: Benelux USA Plastic Caps and Closures Market Revenue (Million) Forecast, by Application 2019 & 2032
- Table 37: Nordics USA Plastic Caps and Closures Market Revenue (Million) Forecast, by Application 2019 & 2032
- Table 38: Rest of Europe USA Plastic Caps and Closures Market Revenue (Million) Forecast, by Application 2019 & 2032
- Table 39: Global USA Plastic Caps and Closures Market Revenue Million Forecast, by Raw Material 2019 & 2032
- Table 40: Global USA Plastic Caps and Closures Market Revenue Million Forecast, by Type 2019 & 2032
- Table 41: Global USA Plastic Caps and Closures Market Revenue Million Forecast, by Application 2019 & 2032
- Table 42: Global USA Plastic Caps and Closures Market Revenue Million Forecast, by Country 2019 & 2032
- Table 43: Turkey USA Plastic Caps and Closures Market Revenue (Million) Forecast, by Application 2019 & 2032
- Table 44: Israel USA Plastic Caps and Closures Market Revenue (Million) Forecast, by Application 2019 & 2032
- Table 45: GCC USA Plastic Caps and Closures Market Revenue (Million) Forecast, by Application 2019 & 2032
- Table 46: North Africa USA Plastic Caps and Closures Market Revenue (Million) Forecast, by Application 2019 & 2032
- Table 47: South Africa USA Plastic Caps and Closures Market Revenue (Million) Forecast, by Application 2019 & 2032
- Table 48: Rest of Middle East & Africa USA Plastic Caps and Closures Market Revenue (Million) Forecast, by Application 2019 & 2032
- Table 49: Global USA Plastic Caps and Closures Market Revenue Million Forecast, by Raw Material 2019 & 2032
- Table 50: Global USA Plastic Caps and Closures Market Revenue Million Forecast, by Type 2019 & 2032
- Table 51: Global USA Plastic Caps and Closures Market Revenue Million Forecast, by Application 2019 & 2032
- Table 52: Global USA Plastic Caps and Closures Market Revenue Million Forecast, by Country 2019 & 2032
- Table 53: China USA Plastic Caps and Closures Market Revenue (Million) Forecast, by Application 2019 & 2032
- Table 54: India USA Plastic Caps and Closures Market Revenue (Million) Forecast, by Application 2019 & 2032
- Table 55: Japan USA Plastic Caps and Closures Market Revenue (Million) Forecast, by Application 2019 & 2032
- Table 56: South Korea USA Plastic Caps and Closures Market Revenue (Million) Forecast, by Application 2019 & 2032
- Table 57: ASEAN USA Plastic Caps and Closures Market Revenue (Million) Forecast, by Application 2019 & 2032
- Table 58: Oceania USA Plastic Caps and Closures Market Revenue (Million) Forecast, by Application 2019 & 2032
- Table 59: Rest of Asia Pacific USA Plastic Caps and Closures Market Revenue (Million) Forecast, by Application 2019 & 2032
Frequently Asked Questions
1. What is the projected Compound Annual Growth Rate (CAGR) of the USA Plastic Caps and Closures Market?
The projected CAGR is approximately 2.51%.
2. Which companies are prominent players in the USA Plastic Caps and Closures Market?
Key companies in the market include Aptargroup Inc, Albéa Services SAS, Trimas Corporation, Closure Systems International Inc, Silgan Closures (Silgan Holdings Inc ), O Berk Company LLC, Bericap Holding*List Not Exhaustive, Guala Closures Group (Guala Pack SPA), Tetra Pak International SA, Berry Global Inc, MJS Packaging, Amcor Ltd.
3. What are the main segments of the USA Plastic Caps and Closures Market?
The market segments include Raw Material, Type, Application.
4. Can you provide details about the market size?
The market size is estimated to be USD 11.82 Million as of 2022.
5. What are some drivers contributing to market growth?
Demand for Packaged Food and Pharmaceutical Drugs; Increasing Demand from Small and Medium-Scale End-user Industries.
6. What are the notable trends driving market growth?
Polyethylene (PE) to be the Fastest Growing Raw Material Segment.
7. Are there any restraints impacting market growth?
Increasing Price Volatility of Raw Materials.
8. Can you provide examples of recent developments in the market?
October 2023: Berry Global launched a solution for lightweight tube closures that integrates cutting-edge design, material versatility, and greenhouse gas reduction. Manufactured from PE, these closures are available in 35 mm and 50 mm diameters, with options for matte or glossy surface finishes and orifice sizes of 3mm or 5mm. Anticipated innovations like this across the market are expected to drive higher demand for Polyethylene (PE) resin across the country in the upcoming years.
9. What pricing options are available for accessing the report?
Pricing options include single-user, multi-user, and enterprise licenses priced at USD 3800, USD 4500, and USD 5800 respectively.
10. Is the market size provided in terms of value or volume?
The market size is provided in terms of value, measured in Million.
11. Are there any specific market keywords associated with the report?
Yes, the market keyword associated with the report is "USA Plastic Caps and Closures Market," which aids in identifying and referencing the specific market segment covered.
12. How do I determine which pricing option suits my needs best?
The pricing options vary based on user requirements and access needs. Individual users may opt for single-user licenses, while businesses requiring broader access may choose multi-user or enterprise licenses for cost-effective access to the report.
13. Are there any additional resources or data provided in the USA Plastic Caps and Closures Market report?
While the report offers comprehensive insights, it's advisable to review the specific contents or supplementary materials provided to ascertain if additional resources or data are available.
14. How can I stay updated on further developments or reports in the USA Plastic Caps and Closures Market?
To stay informed about further developments, trends, and reports in the USA Plastic Caps and Closures Market, consider subscribing to industry newsletters, following relevant companies and organizations, or regularly checking reputable industry news sources and publications.
Methodology
Step 1 - Identification of Relevant Samples Size from Population Database


Step 2 - Approaches for Defining Global Market Size (Value, Volume* & Price*)

Note*: In applicable scenarios
Step 3 - Data Sources
Primary Research
- Web Analytics
- Survey Reports
- Research Institute
- Latest Research Reports
- Opinion Leaders
Secondary Research
- Annual Reports
- White Paper
- Latest Press Release
- Industry Association
- Paid Database
- Investor Presentations

Step 4 - Data Triangulation
Involves using different sources of information in order to increase the validity of a study
These sources are likely to be stakeholders in a program - participants, other researchers, program staff, other community members, and so on.
Then we put all data in single framework & apply various statistical tools to find out the dynamic on the market.
During the analysis stage, feedback from the stakeholder groups would be compared to determine areas of agreement as well as areas of divergence


