

Key Insights
The US automotive collision avoidance systems market is poised for significant expansion, driven by the integration of vehicle automation, stringent safety regulations, and increasing consumer demand for advanced driver-assistance systems (ADAS). The market, currently valued at $15.81 billion, with a projected compound annual growth rate (CAGR) of 10.2% from the base year 2025 through 2033, is experiencing robust growth. Key growth drivers include technological advancements in sensor technologies (radar, LiDAR, camera, ultrasonic), leading to more sophisticated and reliable systems. The widespread adoption across passenger and commercial vehicles, particularly in states like California, Texas, Florida, and New York, further accelerates market expansion. The diverse functionalities, including adaptive cruise control, automated emergency braking, lane departure warnings, and blind-spot monitoring, cater to a broad spectrum of safety needs.
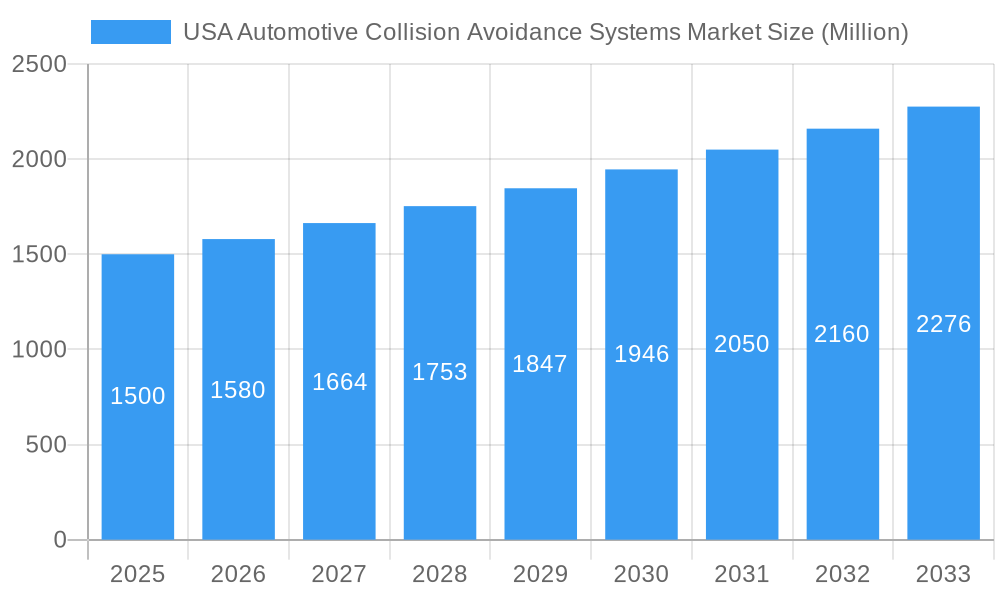
USA Automotive Collision Avoidance Systems Market Market Size (In Billion)
Despite the positive outlook, potential market restraints include the high initial cost of integrating advanced systems, which may deter budget-conscious consumers, and environmental factors like weather conditions that can impact system effectiveness. Nevertheless, the market's long-term growth trajectory remains strong, fueled by continuous innovation, evolving consumer preferences for safer vehicles, and a heightened focus on reducing road accidents. Market segmentation by vehicle type, technology, and functionality presents numerous opportunities for specialization and targeted strategies. Regional adoption variations across the US are influenced by population density, infrastructure, and economic conditions.
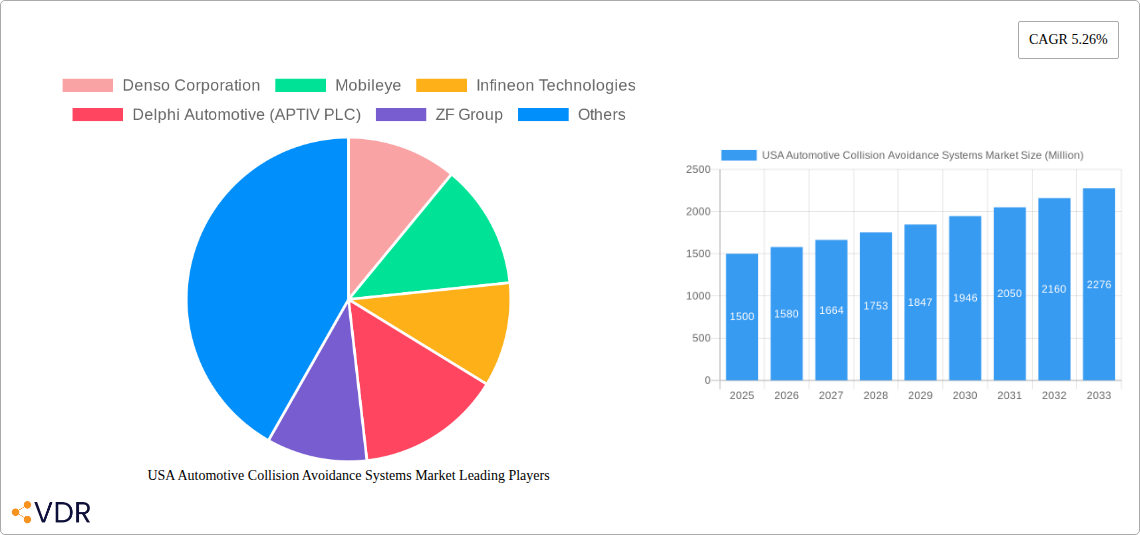
USA Automotive Collision Avoidance Systems Market Company Market Share
This report offers a comprehensive analysis of the US Automotive Collision Avoidance Systems market, covering market dynamics, growth trends, regional insights, competitive landscape, and future projections. The study period spans 2019-2033, with 2025 as the base year and 2025-2033 as the forecast period. Market segmentation includes technology type (Radar, LiDAR, Camera, Ultrasonic), vehicle type (Passenger Cars, Commercial Vehicles), function type (Adaptive, Automated, Monitoring, Warning), and state (California, Texas, Florida, New York, Ohio, Rest of the United States). Leading market players include Denso Corporation, Mobileye, Infineon Technologies, Delphi Automotive (APTIV PLC), ZF Group, Continental AG, Autoliv Inc, Robert Bosch GmbH, Magna International, WABCO Vehicle Control Services, and Panasonic Corporation.
USA Automotive Collision Avoidance Systems Market Market Dynamics & Structure
The USA automotive collision avoidance systems market is characterized by moderate concentration, with several major players holding significant market share. Technological innovation, driven by advancements in sensor technology (LiDAR, radar, camera) and artificial intelligence (AI), is a key driver. Stringent government regulations aimed at improving road safety are further propelling market growth. Competitive substitutes include advanced driver-assistance systems (ADAS) with varying levels of automation. The end-user demographic is expanding to include both individual consumers and fleet operators of commercial vehicles. M&A activity has been relatively high in recent years, with larger players acquiring smaller companies to expand their product portfolios and technological capabilities.
- Market Concentration: Moderately concentrated, with top 5 players holding approximately xx% market share in 2024.
- Technological Innovation: Rapid advancements in sensor fusion, AI-powered algorithms, and improved processing power are key drivers.
- Regulatory Framework: Increasingly stringent safety regulations mandate the adoption of collision avoidance systems in new vehicles.
- Competitive Substitutes: ADAS features such as lane departure warnings and adaptive cruise control offer partial overlap.
- End-User Demographics: Growing adoption among both passenger car owners and commercial fleet operators.
- M&A Trends: Significant M&A activity observed in the past five years, with xx major deals concluded.
USA Automotive Collision Avoidance Systems Market Growth Trends & Insights
The USA automotive collision avoidance systems market experienced robust growth during the historical period (2019-2024), driven by increasing vehicle production, rising consumer awareness of safety features, and favorable government regulations. Adoption rates have been particularly high in passenger cars, with a significant uptake in higher trim levels. Technological advancements, such as the integration of V2X communication and improved sensor fusion techniques, are driving further market expansion. Consumer behavior is shifting towards prioritizing safety features, leading to increased demand for collision avoidance systems. The market is projected to exhibit a CAGR of xx% during the forecast period (2025-2033). Market penetration is expected to reach xx% by 2033.
- Market Size Evolution: The market grew from xx Million units in 2019 to xx Million units in 2024.
- Adoption Rates: High adoption in new vehicles, particularly in luxury and higher trim levels.
- Technological Disruptions: Sensor fusion, AI, and V2X communication are transforming the market landscape.
- Consumer Behavior Shifts: Increasing consumer preference for advanced safety features.
Dominant Regions, Countries, or Segments in USA Automotive Collision Avoidance Systems Market
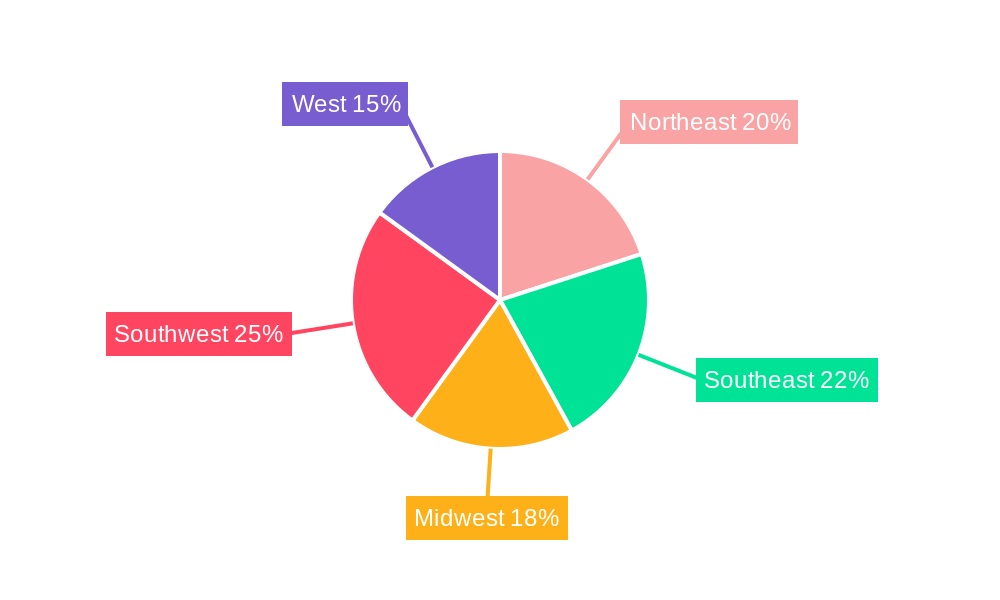
California, Texas, and Florida represent the leading states in the US automotive collision avoidance systems market, driven by higher vehicle registrations, strong economic activity, and a relatively high proportion of new vehicle sales. Within technology types, camera-based systems currently hold the largest market share due to their cost-effectiveness and widespread availability. Passenger cars constitute the dominant segment, owing to higher production volumes compared to commercial vehicles. The Adaptive function type is the leading segment based on its widespread usage and effective features.
- Leading States: California, Texas, and Florida drive the market due to high vehicle density and economic prosperity.
- Dominant Technology Type: Camera-based systems currently dominate due to cost-effectiveness and technological maturity.
- Leading Vehicle Type: Passenger cars represent the largest market segment, driven by higher sales volume.
- Dominant Function Type: Adaptive systems hold the largest market share.
USA Automotive Collision Avoidance Systems Market Product Landscape
The market offers a diverse range of collision avoidance systems, incorporating various sensor technologies and functionalities. Products are differentiated based on their sensor fusion capabilities, detection range, accuracy, and integration with other ADAS features. Technological advancements include improved algorithms, enhanced sensor performance, and the integration of machine learning for improved object recognition and decision-making. Unique selling propositions include features like pedestrian detection, cyclist detection, and automatic emergency braking.
Key Drivers, Barriers & Challenges in USA Automotive Collision Avoidance Systems Market
Key Drivers: Increasing safety regulations, rising consumer demand for advanced safety features, technological advancements in sensor technology and AI, and government incentives promoting the adoption of ADAS are driving market growth.
Challenges: High initial costs of implementation, complexities in system integration, potential for false positives and negatives, and concerns about data privacy and security pose significant challenges to market expansion. Supply chain disruptions might also impact the availability of certain components. These factors could collectively decrease the market growth by xx% in the next five years.
Emerging Opportunities in USA Automotive Collision Avoidance Systems Market
Emerging opportunities lie in the integration of V2X communication, the development of more sophisticated sensor fusion algorithms, and the expansion into autonomous driving systems. Untapped markets include the retrofitting of existing vehicles and the application of collision avoidance systems in off-road vehicles. Evolving consumer preferences toward higher levels of automation present further growth opportunities.
Growth Accelerators in the USA Automotive Collision Avoidance Systems Market Industry
Technological breakthroughs in LiDAR and sensor fusion, strategic partnerships between automotive manufacturers and technology providers, and market expansion into new vehicle segments (e.g., electric vehicles, autonomous vehicles) are accelerating market growth. Government initiatives promoting the adoption of advanced safety technologies also play a crucial role.
Key Players Shaping the USA Automotive Collision Avoidance Systems Market Market
Notable Milestones in USA Automotive Collision Avoidance Systems Market Sector
- 2020: Introduction of new regulations mandating certain collision avoidance features in new vehicles.
- 2021: Launch of several new collision avoidance systems with improved sensor fusion capabilities.
- 2022: Significant increase in M&A activity, consolidating market share among major players.
- 2023: Significant advancements in LiDAR technology, making it more affordable and accessible.
- 2024: Increased focus on V2X technology integration for enhanced safety.
In-Depth USA Automotive Collision Avoidance Systems Market Market Outlook
The USA automotive collision avoidance systems market is poised for continued strong growth, driven by technological advancements, evolving consumer preferences, and supportive government policies. Strategic partnerships and collaborations among industry players will be crucial in driving innovation and market expansion. The increasing integration of collision avoidance systems into autonomous driving technology represents a significant long-term growth opportunity. The market is poised for significant expansion, fueled by continued innovation and evolving safety standards.
USA Automotive Collision Avoidance Systems Market Segmentation
-
1. Function Type
- 1.1. Adaptive
- 1.2. Automated
- 1.3. Monitoring
- 1.4. Warning
-
2. Technology Type
- 2.1. Radar
- 2.2. LiDAR
- 2.3. Camera
- 2.4. Ultrasonic
-
3. Vehicle type
- 3.1. Passenger Cars
- 3.2. Commercial Vehicles
-
4. State
- 4.1. California
- 4.2. Texas
- 4.3. Florida
- 4.4. New York
- 4.5. Ohio
- 4.6. Rest of the United States
USA Automotive Collision Avoidance Systems Market Segmentation By Geography
-
1. North America
- 1.1. United States
- 1.2. Canada
- 1.3. Mexico
-
2. South America
- 2.1. Brazil
- 2.2. Argentina
- 2.3. Rest of South America
-
3. Europe
- 3.1. United Kingdom
- 3.2. Germany
- 3.3. France
- 3.4. Italy
- 3.5. Spain
- 3.6. Russia
- 3.7. Benelux
- 3.8. Nordics
- 3.9. Rest of Europe
-
4. Middle East & Africa
- 4.1. Turkey
- 4.2. Israel
- 4.3. GCC
- 4.4. North Africa
- 4.5. South Africa
- 4.6. Rest of Middle East & Africa
-
5. Asia Pacific
- 5.1. China
- 5.2. India
- 5.3. Japan
- 5.4. South Korea
- 5.5. ASEAN
- 5.6. Oceania
- 5.7. Rest of Asia Pacific
USA Automotive Collision Avoidance Systems Market Regional Market Share
Geographic Coverage of USA Automotive Collision Avoidance Systems Market
USA Automotive Collision Avoidance Systems Market REPORT HIGHLIGHTS
| Aspects | Details |
|---|---|
| Study Period | 2020-2034 |
| Base Year | 2025 |
| Estimated Year | 2026 |
| Forecast Period | 2026-2034 |
| Historical Period | 2020-2025 |
| Growth Rate | CAGR of 10.2% from 2020-2034 |
| Segmentation |
|
Table of Contents
- 1. Introduction
- 1.1. Research Scope
- 1.2. Market Segmentation
- 1.3. Research Objective
- 1.4. Definitions and Assumptions
- 2. Executive Summary
- 2.1. Market Snapshot
- 3. Market Dynamics
- 3.1. Market Drivers
- 3.2. Market Restrains
- 3.3. Market Trends
- 3.4. Market Opportunities
- 4. Market Factor Analysis
- 4.1. Porters Five Forces
- 4.1.1. Bargaining Power of Suppliers
- 4.1.2. Bargaining Power of Buyers
- 4.1.3. Threat of New Entrants
- 4.1.4. Threat of Substitutes
- 4.1.5. Competitive Rivalry
- 4.2. PESTEL analysis
- 4.3. BCG Analysis
- 4.3.1. Stars (High Growth, High Market Share)
- 4.3.2. Cash Cows (Low Growth, High Market Share)
- 4.3.3. Question Mark (High Growth, Low Market Share)
- 4.3.4. Dogs (Low Growth, Low Market Share)
- 4.4. Ansoff Matrix Analysis
- 4.5. Supply Chain Analysis
- 4.6. Regulatory Landscape
- 4.7. Current Market Potential and Opportunity Assessment (TAM–SAM–SOM Framework)
- 4.8. VDR Analyst Note
- 4.1. Porters Five Forces
- 5. Market Analysis, Insights and Forecast 2021-2033
- 5.1. Market Analysis, Insights and Forecast - by Function Type
- 5.1.1. Adaptive
- 5.1.2. Automated
- 5.1.3. Monitoring
- 5.1.4. Warning
- 5.2. Market Analysis, Insights and Forecast - by Technology Type
- 5.2.1. Radar
- 5.2.2. LiDAR
- 5.2.3. Camera
- 5.2.4. Ultrasonic
- 5.3. Market Analysis, Insights and Forecast - by Vehicle type
- 5.3.1. Passenger Cars
- 5.3.2. Commercial Vehicles
- 5.4. Market Analysis, Insights and Forecast - by State
- 5.4.1. California
- 5.4.2. Texas
- 5.4.3. Florida
- 5.4.4. New York
- 5.4.5. Ohio
- 5.4.6. Rest of the United States
- 5.5. Market Analysis, Insights and Forecast - by Region
- 5.5.1. North America
- 5.5.2. South America
- 5.5.3. Europe
- 5.5.4. Middle East & Africa
- 5.5.5. Asia Pacific
- 5.1. Market Analysis, Insights and Forecast - by Function Type
- 6. Global USA Automotive Collision Avoidance Systems Market Analysis, Insights and Forecast, 2021-2033
- 6.1. Market Analysis, Insights and Forecast - by Function Type
- 6.1.1. Adaptive
- 6.1.2. Automated
- 6.1.3. Monitoring
- 6.1.4. Warning
- 6.2. Market Analysis, Insights and Forecast - by Technology Type
- 6.2.1. Radar
- 6.2.2. LiDAR
- 6.2.3. Camera
- 6.2.4. Ultrasonic
- 6.3. Market Analysis, Insights and Forecast - by Vehicle type
- 6.3.1. Passenger Cars
- 6.3.2. Commercial Vehicles
- 6.4. Market Analysis, Insights and Forecast - by State
- 6.4.1. California
- 6.4.2. Texas
- 6.4.3. Florida
- 6.4.4. New York
- 6.4.5. Ohio
- 6.4.6. Rest of the United States
- 6.1. Market Analysis, Insights and Forecast - by Function Type
- 7. North America USA Automotive Collision Avoidance Systems Market Analysis, Insights and Forecast, 2021-2033
- 7.1. Market Analysis, Insights and Forecast - by Function Type
- 7.1.1. Adaptive
- 7.1.2. Automated
- 7.1.3. Monitoring
- 7.1.4. Warning
- 7.2. Market Analysis, Insights and Forecast - by Technology Type
- 7.2.1. Radar
- 7.2.2. LiDAR
- 7.2.3. Camera
- 7.2.4. Ultrasonic
- 7.3. Market Analysis, Insights and Forecast - by Vehicle type
- 7.3.1. Passenger Cars
- 7.3.2. Commercial Vehicles
- 7.4. Market Analysis, Insights and Forecast - by State
- 7.4.1. California
- 7.4.2. Texas
- 7.4.3. Florida
- 7.4.4. New York
- 7.4.5. Ohio
- 7.4.6. Rest of the United States
- 7.1. Market Analysis, Insights and Forecast - by Function Type
- 8. South America USA Automotive Collision Avoidance Systems Market Analysis, Insights and Forecast, 2021-2033
- 8.1. Market Analysis, Insights and Forecast - by Function Type
- 8.1.1. Adaptive
- 8.1.2. Automated
- 8.1.3. Monitoring
- 8.1.4. Warning
- 8.2. Market Analysis, Insights and Forecast - by Technology Type
- 8.2.1. Radar
- 8.2.2. LiDAR
- 8.2.3. Camera
- 8.2.4. Ultrasonic
- 8.3. Market Analysis, Insights and Forecast - by Vehicle type
- 8.3.1. Passenger Cars
- 8.3.2. Commercial Vehicles
- 8.4. Market Analysis, Insights and Forecast - by State
- 8.4.1. California
- 8.4.2. Texas
- 8.4.3. Florida
- 8.4.4. New York
- 8.4.5. Ohio
- 8.4.6. Rest of the United States
- 8.1. Market Analysis, Insights and Forecast - by Function Type
- 9. Europe USA Automotive Collision Avoidance Systems Market Analysis, Insights and Forecast, 2021-2033
- 9.1. Market Analysis, Insights and Forecast - by Function Type
- 9.1.1. Adaptive
- 9.1.2. Automated
- 9.1.3. Monitoring
- 9.1.4. Warning
- 9.2. Market Analysis, Insights and Forecast - by Technology Type
- 9.2.1. Radar
- 9.2.2. LiDAR
- 9.2.3. Camera
- 9.2.4. Ultrasonic
- 9.3. Market Analysis, Insights and Forecast - by Vehicle type
- 9.3.1. Passenger Cars
- 9.3.2. Commercial Vehicles
- 9.4. Market Analysis, Insights and Forecast - by State
- 9.4.1. California
- 9.4.2. Texas
- 9.4.3. Florida
- 9.4.4. New York
- 9.4.5. Ohio
- 9.4.6. Rest of the United States
- 9.1. Market Analysis, Insights and Forecast - by Function Type
- 10. Middle East & Africa USA Automotive Collision Avoidance Systems Market Analysis, Insights and Forecast, 2021-2033
- 10.1. Market Analysis, Insights and Forecast - by Function Type
- 10.1.1. Adaptive
- 10.1.2. Automated
- 10.1.3. Monitoring
- 10.1.4. Warning
- 10.2. Market Analysis, Insights and Forecast - by Technology Type
- 10.2.1. Radar
- 10.2.2. LiDAR
- 10.2.3. Camera
- 10.2.4. Ultrasonic
- 10.3. Market Analysis, Insights and Forecast - by Vehicle type
- 10.3.1. Passenger Cars
- 10.3.2. Commercial Vehicles
- 10.4. Market Analysis, Insights and Forecast - by State
- 10.4.1. California
- 10.4.2. Texas
- 10.4.3. Florida
- 10.4.4. New York
- 10.4.5. Ohio
- 10.4.6. Rest of the United States
- 10.1. Market Analysis, Insights and Forecast - by Function Type
- 11. Asia Pacific USA Automotive Collision Avoidance Systems Market Analysis, Insights and Forecast, 2021-2033
- 11.1. Market Analysis, Insights and Forecast - by Function Type
- 11.1.1. Adaptive
- 11.1.2. Automated
- 11.1.3. Monitoring
- 11.1.4. Warning
- 11.2. Market Analysis, Insights and Forecast - by Technology Type
- 11.2.1. Radar
- 11.2.2. LiDAR
- 11.2.3. Camera
- 11.2.4. Ultrasonic
- 11.3. Market Analysis, Insights and Forecast - by Vehicle type
- 11.3.1. Passenger Cars
- 11.3.2. Commercial Vehicles
- 11.4. Market Analysis, Insights and Forecast - by State
- 11.4.1. California
- 11.4.2. Texas
- 11.4.3. Florida
- 11.4.4. New York
- 11.4.5. Ohio
- 11.4.6. Rest of the United States
- 11.1. Market Analysis, Insights and Forecast - by Function Type
- 12. Competitive Analysis
- 12.1. Company Profiles
- 12.1.1 Denso Corporation
- 12.1.1.1. Company Overview
- 12.1.1.2. Products
- 12.1.1.3. Company Financials
- 12.1.1.4. SWOT Analysis
- 12.1.2 Mobileye
- 12.1.2.1. Company Overview
- 12.1.2.2. Products
- 12.1.2.3. Company Financials
- 12.1.2.4. SWOT Analysis
- 12.1.3 Infineon Technologies
- 12.1.3.1. Company Overview
- 12.1.3.2. Products
- 12.1.3.3. Company Financials
- 12.1.3.4. SWOT Analysis
- 12.1.4 Delphi Automotive (APTIV PLC)
- 12.1.4.1. Company Overview
- 12.1.4.2. Products
- 12.1.4.3. Company Financials
- 12.1.4.4. SWOT Analysis
- 12.1.5 ZF Group
- 12.1.5.1. Company Overview
- 12.1.5.2. Products
- 12.1.5.3. Company Financials
- 12.1.5.4. SWOT Analysis
- 12.1.6 Continental AG
- 12.1.6.1. Company Overview
- 12.1.6.2. Products
- 12.1.6.3. Company Financials
- 12.1.6.4. SWOT Analysis
- 12.1.7 Autoliv Inc
- 12.1.7.1. Company Overview
- 12.1.7.2. Products
- 12.1.7.3. Company Financials
- 12.1.7.4. SWOT Analysis
- 12.1.8 Robert Bosch GmbH
- 12.1.8.1. Company Overview
- 12.1.8.2. Products
- 12.1.8.3. Company Financials
- 12.1.8.4. SWOT Analysis
- 12.1.9 Magna Internationa
- 12.1.9.1. Company Overview
- 12.1.9.2. Products
- 12.1.9.3. Company Financials
- 12.1.9.4. SWOT Analysis
- 12.1.10 WABCO Vehicle Control Services
- 12.1.10.1. Company Overview
- 12.1.10.2. Products
- 12.1.10.3. Company Financials
- 12.1.10.4. SWOT Analysis
- 12.1.11 Panasonic Corporation
- 12.1.11.1. Company Overview
- 12.1.11.2. Products
- 12.1.11.3. Company Financials
- 12.1.11.4. SWOT Analysis
- 12.1.1 Denso Corporation
- 12.2. Market Entropy
- 12.2.1 Company's Key Areas Served
- 12.2.2 Recent Developments
- 12.3. Company Market Share Analysis 2025
- 12.3.1 Top 5 Companies Market Share Analysis
- 12.3.2 Top 3 Companies Market Share Analysis
- 12.4. List of Potential Customers
- 13. Research Methodology
List of Figures
- Figure 1: Global USA Automotive Collision Avoidance Systems Market Revenue Breakdown (billion, %) by Region 2025 & 2033
- Figure 2: North America USA Automotive Collision Avoidance Systems Market Revenue (billion), by Function Type 2025 & 2033
- Figure 3: North America USA Automotive Collision Avoidance Systems Market Revenue Share (%), by Function Type 2025 & 2033
- Figure 4: North America USA Automotive Collision Avoidance Systems Market Revenue (billion), by Technology Type 2025 & 2033
- Figure 5: North America USA Automotive Collision Avoidance Systems Market Revenue Share (%), by Technology Type 2025 & 2033
- Figure 6: North America USA Automotive Collision Avoidance Systems Market Revenue (billion), by Vehicle type 2025 & 2033
- Figure 7: North America USA Automotive Collision Avoidance Systems Market Revenue Share (%), by Vehicle type 2025 & 2033
- Figure 8: North America USA Automotive Collision Avoidance Systems Market Revenue (billion), by State 2025 & 2033
- Figure 9: North America USA Automotive Collision Avoidance Systems Market Revenue Share (%), by State 2025 & 2033
- Figure 10: North America USA Automotive Collision Avoidance Systems Market Revenue (billion), by Country 2025 & 2033
- Figure 11: North America USA Automotive Collision Avoidance Systems Market Revenue Share (%), by Country 2025 & 2033
- Figure 12: South America USA Automotive Collision Avoidance Systems Market Revenue (billion), by Function Type 2025 & 2033
- Figure 13: South America USA Automotive Collision Avoidance Systems Market Revenue Share (%), by Function Type 2025 & 2033
- Figure 14: South America USA Automotive Collision Avoidance Systems Market Revenue (billion), by Technology Type 2025 & 2033
- Figure 15: South America USA Automotive Collision Avoidance Systems Market Revenue Share (%), by Technology Type 2025 & 2033
- Figure 16: South America USA Automotive Collision Avoidance Systems Market Revenue (billion), by Vehicle type 2025 & 2033
- Figure 17: South America USA Automotive Collision Avoidance Systems Market Revenue Share (%), by Vehicle type 2025 & 2033
- Figure 18: South America USA Automotive Collision Avoidance Systems Market Revenue (billion), by State 2025 & 2033
- Figure 19: South America USA Automotive Collision Avoidance Systems Market Revenue Share (%), by State 2025 & 2033
- Figure 20: South America USA Automotive Collision Avoidance Systems Market Revenue (billion), by Country 2025 & 2033
- Figure 21: South America USA Automotive Collision Avoidance Systems Market Revenue Share (%), by Country 2025 & 2033
- Figure 22: Europe USA Automotive Collision Avoidance Systems Market Revenue (billion), by Function Type 2025 & 2033
- Figure 23: Europe USA Automotive Collision Avoidance Systems Market Revenue Share (%), by Function Type 2025 & 2033
- Figure 24: Europe USA Automotive Collision Avoidance Systems Market Revenue (billion), by Technology Type 2025 & 2033
- Figure 25: Europe USA Automotive Collision Avoidance Systems Market Revenue Share (%), by Technology Type 2025 & 2033
- Figure 26: Europe USA Automotive Collision Avoidance Systems Market Revenue (billion), by Vehicle type 2025 & 2033
- Figure 27: Europe USA Automotive Collision Avoidance Systems Market Revenue Share (%), by Vehicle type 2025 & 2033
- Figure 28: Europe USA Automotive Collision Avoidance Systems Market Revenue (billion), by State 2025 & 2033
- Figure 29: Europe USA Automotive Collision Avoidance Systems Market Revenue Share (%), by State 2025 & 2033
- Figure 30: Europe USA Automotive Collision Avoidance Systems Market Revenue (billion), by Country 2025 & 2033
- Figure 31: Europe USA Automotive Collision Avoidance Systems Market Revenue Share (%), by Country 2025 & 2033
- Figure 32: Middle East & Africa USA Automotive Collision Avoidance Systems Market Revenue (billion), by Function Type 2025 & 2033
- Figure 33: Middle East & Africa USA Automotive Collision Avoidance Systems Market Revenue Share (%), by Function Type 2025 & 2033
- Figure 34: Middle East & Africa USA Automotive Collision Avoidance Systems Market Revenue (billion), by Technology Type 2025 & 2033
- Figure 35: Middle East & Africa USA Automotive Collision Avoidance Systems Market Revenue Share (%), by Technology Type 2025 & 2033
- Figure 36: Middle East & Africa USA Automotive Collision Avoidance Systems Market Revenue (billion), by Vehicle type 2025 & 2033
- Figure 37: Middle East & Africa USA Automotive Collision Avoidance Systems Market Revenue Share (%), by Vehicle type 2025 & 2033
- Figure 38: Middle East & Africa USA Automotive Collision Avoidance Systems Market Revenue (billion), by State 2025 & 2033
- Figure 39: Middle East & Africa USA Automotive Collision Avoidance Systems Market Revenue Share (%), by State 2025 & 2033
- Figure 40: Middle East & Africa USA Automotive Collision Avoidance Systems Market Revenue (billion), by Country 2025 & 2033
- Figure 41: Middle East & Africa USA Automotive Collision Avoidance Systems Market Revenue Share (%), by Country 2025 & 2033
- Figure 42: Asia Pacific USA Automotive Collision Avoidance Systems Market Revenue (billion), by Function Type 2025 & 2033
- Figure 43: Asia Pacific USA Automotive Collision Avoidance Systems Market Revenue Share (%), by Function Type 2025 & 2033
- Figure 44: Asia Pacific USA Automotive Collision Avoidance Systems Market Revenue (billion), by Technology Type 2025 & 2033
- Figure 45: Asia Pacific USA Automotive Collision Avoidance Systems Market Revenue Share (%), by Technology Type 2025 & 2033
- Figure 46: Asia Pacific USA Automotive Collision Avoidance Systems Market Revenue (billion), by Vehicle type 2025 & 2033
- Figure 47: Asia Pacific USA Automotive Collision Avoidance Systems Market Revenue Share (%), by Vehicle type 2025 & 2033
- Figure 48: Asia Pacific USA Automotive Collision Avoidance Systems Market Revenue (billion), by State 2025 & 2033
- Figure 49: Asia Pacific USA Automotive Collision Avoidance Systems Market Revenue Share (%), by State 2025 & 2033
- Figure 50: Asia Pacific USA Automotive Collision Avoidance Systems Market Revenue (billion), by Country 2025 & 2033
- Figure 51: Asia Pacific USA Automotive Collision Avoidance Systems Market Revenue Share (%), by Country 2025 & 2033
List of Tables
- Table 1: Global USA Automotive Collision Avoidance Systems Market Revenue billion Forecast, by Function Type 2020 & 2033
- Table 2: Global USA Automotive Collision Avoidance Systems Market Revenue billion Forecast, by Technology Type 2020 & 2033
- Table 3: Global USA Automotive Collision Avoidance Systems Market Revenue billion Forecast, by Vehicle type 2020 & 2033
- Table 4: Global USA Automotive Collision Avoidance Systems Market Revenue billion Forecast, by State 2020 & 2033
- Table 5: Global USA Automotive Collision Avoidance Systems Market Revenue billion Forecast, by Region 2020 & 2033
- Table 6: Global USA Automotive Collision Avoidance Systems Market Revenue billion Forecast, by Function Type 2020 & 2033
- Table 7: Global USA Automotive Collision Avoidance Systems Market Revenue billion Forecast, by Technology Type 2020 & 2033
- Table 8: Global USA Automotive Collision Avoidance Systems Market Revenue billion Forecast, by Vehicle type 2020 & 2033
- Table 9: Global USA Automotive Collision Avoidance Systems Market Revenue billion Forecast, by State 2020 & 2033
- Table 10: Global USA Automotive Collision Avoidance Systems Market Revenue billion Forecast, by Country 2020 & 2033
- Table 11: United States USA Automotive Collision Avoidance Systems Market Revenue (billion) Forecast, by Application 2020 & 2033
- Table 12: Canada USA Automotive Collision Avoidance Systems Market Revenue (billion) Forecast, by Application 2020 & 2033
- Table 13: Mexico USA Automotive Collision Avoidance Systems Market Revenue (billion) Forecast, by Application 2020 & 2033
- Table 14: Global USA Automotive Collision Avoidance Systems Market Revenue billion Forecast, by Function Type 2020 & 2033
- Table 15: Global USA Automotive Collision Avoidance Systems Market Revenue billion Forecast, by Technology Type 2020 & 2033
- Table 16: Global USA Automotive Collision Avoidance Systems Market Revenue billion Forecast, by Vehicle type 2020 & 2033
- Table 17: Global USA Automotive Collision Avoidance Systems Market Revenue billion Forecast, by State 2020 & 2033
- Table 18: Global USA Automotive Collision Avoidance Systems Market Revenue billion Forecast, by Country 2020 & 2033
- Table 19: Brazil USA Automotive Collision Avoidance Systems Market Revenue (billion) Forecast, by Application 2020 & 2033
- Table 20: Argentina USA Automotive Collision Avoidance Systems Market Revenue (billion) Forecast, by Application 2020 & 2033
- Table 21: Rest of South America USA Automotive Collision Avoidance Systems Market Revenue (billion) Forecast, by Application 2020 & 2033
- Table 22: Global USA Automotive Collision Avoidance Systems Market Revenue billion Forecast, by Function Type 2020 & 2033
- Table 23: Global USA Automotive Collision Avoidance Systems Market Revenue billion Forecast, by Technology Type 2020 & 2033
- Table 24: Global USA Automotive Collision Avoidance Systems Market Revenue billion Forecast, by Vehicle type 2020 & 2033
- Table 25: Global USA Automotive Collision Avoidance Systems Market Revenue billion Forecast, by State 2020 & 2033
- Table 26: Global USA Automotive Collision Avoidance Systems Market Revenue billion Forecast, by Country 2020 & 2033
- Table 27: United Kingdom USA Automotive Collision Avoidance Systems Market Revenue (billion) Forecast, by Application 2020 & 2033
- Table 28: Germany USA Automotive Collision Avoidance Systems Market Revenue (billion) Forecast, by Application 2020 & 2033
- Table 29: France USA Automotive Collision Avoidance Systems Market Revenue (billion) Forecast, by Application 2020 & 2033
- Table 30: Italy USA Automotive Collision Avoidance Systems Market Revenue (billion) Forecast, by Application 2020 & 2033
- Table 31: Spain USA Automotive Collision Avoidance Systems Market Revenue (billion) Forecast, by Application 2020 & 2033
- Table 32: Russia USA Automotive Collision Avoidance Systems Market Revenue (billion) Forecast, by Application 2020 & 2033
- Table 33: Benelux USA Automotive Collision Avoidance Systems Market Revenue (billion) Forecast, by Application 2020 & 2033
- Table 34: Nordics USA Automotive Collision Avoidance Systems Market Revenue (billion) Forecast, by Application 2020 & 2033
- Table 35: Rest of Europe USA Automotive Collision Avoidance Systems Market Revenue (billion) Forecast, by Application 2020 & 2033
- Table 36: Global USA Automotive Collision Avoidance Systems Market Revenue billion Forecast, by Function Type 2020 & 2033
- Table 37: Global USA Automotive Collision Avoidance Systems Market Revenue billion Forecast, by Technology Type 2020 & 2033
- Table 38: Global USA Automotive Collision Avoidance Systems Market Revenue billion Forecast, by Vehicle type 2020 & 2033
- Table 39: Global USA Automotive Collision Avoidance Systems Market Revenue billion Forecast, by State 2020 & 2033
- Table 40: Global USA Automotive Collision Avoidance Systems Market Revenue billion Forecast, by Country 2020 & 2033
- Table 41: Turkey USA Automotive Collision Avoidance Systems Market Revenue (billion) Forecast, by Application 2020 & 2033
- Table 42: Israel USA Automotive Collision Avoidance Systems Market Revenue (billion) Forecast, by Application 2020 & 2033
- Table 43: GCC USA Automotive Collision Avoidance Systems Market Revenue (billion) Forecast, by Application 2020 & 2033
- Table 44: North Africa USA Automotive Collision Avoidance Systems Market Revenue (billion) Forecast, by Application 2020 & 2033
- Table 45: South Africa USA Automotive Collision Avoidance Systems Market Revenue (billion) Forecast, by Application 2020 & 2033
- Table 46: Rest of Middle East & Africa USA Automotive Collision Avoidance Systems Market Revenue (billion) Forecast, by Application 2020 & 2033
- Table 47: Global USA Automotive Collision Avoidance Systems Market Revenue billion Forecast, by Function Type 2020 & 2033
- Table 48: Global USA Automotive Collision Avoidance Systems Market Revenue billion Forecast, by Technology Type 2020 & 2033
- Table 49: Global USA Automotive Collision Avoidance Systems Market Revenue billion Forecast, by Vehicle type 2020 & 2033
- Table 50: Global USA Automotive Collision Avoidance Systems Market Revenue billion Forecast, by State 2020 & 2033
- Table 51: Global USA Automotive Collision Avoidance Systems Market Revenue billion Forecast, by Country 2020 & 2033
- Table 52: China USA Automotive Collision Avoidance Systems Market Revenue (billion) Forecast, by Application 2020 & 2033
- Table 53: India USA Automotive Collision Avoidance Systems Market Revenue (billion) Forecast, by Application 2020 & 2033
- Table 54: Japan USA Automotive Collision Avoidance Systems Market Revenue (billion) Forecast, by Application 2020 & 2033
- Table 55: South Korea USA Automotive Collision Avoidance Systems Market Revenue (billion) Forecast, by Application 2020 & 2033
- Table 56: ASEAN USA Automotive Collision Avoidance Systems Market Revenue (billion) Forecast, by Application 2020 & 2033
- Table 57: Oceania USA Automotive Collision Avoidance Systems Market Revenue (billion) Forecast, by Application 2020 & 2033
- Table 58: Rest of Asia Pacific USA Automotive Collision Avoidance Systems Market Revenue (billion) Forecast, by Application 2020 & 2033
Frequently Asked Questions
1. What is the projected Compound Annual Growth Rate (CAGR) of the USA Automotive Collision Avoidance Systems Market?
The projected CAGR is approximately 10.2%.
2. Which companies are prominent players in the USA Automotive Collision Avoidance Systems Market?
Key companies in the market include Denso Corporation, Mobileye, Infineon Technologies, Delphi Automotive (APTIV PLC), ZF Group, Continental AG, Autoliv Inc, Robert Bosch GmbH, Magna Internationa, WABCO Vehicle Control Services, Panasonic Corporation.
3. What are the main segments of the USA Automotive Collision Avoidance Systems Market?
The market segments include Function Type, Technology Type, Vehicle type, State.
4. Can you provide details about the market size?
The market size is estimated to be USD 15.81 billion as of 2022.
5. What are some drivers contributing to market growth?
Warning Function Dominating the Market; Others.
6. What are the notable trends driving market growth?
Warning Function Dominating the Market.
7. Are there any restraints impacting market growth?
Disturbances in Supply Chain due to Chip Shortage; Others.
8. Can you provide examples of recent developments in the market?
N/A
9. What pricing options are available for accessing the report?
Pricing options include single-user, multi-user, and enterprise licenses priced at USD 3800, USD 4500, and USD 5800 respectively.
10. Is the market size provided in terms of value or volume?
The market size is provided in terms of value, measured in billion.
11. Are there any specific market keywords associated with the report?
Yes, the market keyword associated with the report is "USA Automotive Collision Avoidance Systems Market," which aids in identifying and referencing the specific market segment covered.
12. How do I determine which pricing option suits my needs best?
The pricing options vary based on user requirements and access needs. Individual users may opt for single-user licenses, while businesses requiring broader access may choose multi-user or enterprise licenses for cost-effective access to the report.
13. Are there any additional resources or data provided in the USA Automotive Collision Avoidance Systems Market report?
While the report offers comprehensive insights, it's advisable to review the specific contents or supplementary materials provided to ascertain if additional resources or data are available.
14. How can I stay updated on further developments or reports in the USA Automotive Collision Avoidance Systems Market?
To stay informed about further developments, trends, and reports in the USA Automotive Collision Avoidance Systems Market, consider subscribing to industry newsletters, following relevant companies and organizations, or regularly checking reputable industry news sources and publications.
Methodology
Step 1 - Identification of Relevant Samples Size from Population Database


Step 2 - Approaches for Defining Global Market Size (Value, Volume* & Price*)

Note*: In applicable scenarios
Step 3 - Data Sources
Primary Research
- Web Analytics
- Survey Reports
- Research Institute
- Latest Research Reports
- Opinion Leaders
Secondary Research
- Annual Reports
- White Paper
- Latest Press Release
- Industry Association
- Paid Database
- Investor Presentations

Step 4 - Data Triangulation
Involves using different sources of information in order to increase the validity of a study
These sources are likely to be stakeholders in a program - participants, other researchers, program staff, other community members, and so on.
Then we put all data in single framework & apply various statistical tools to find out the dynamic on the market.
During the analysis stage, feedback from the stakeholder groups would be compared to determine areas of agreement as well as areas of divergence