

Key Insights
The U.S. wallcovering market, estimated at 36.54 million in 2024, is poised for robust expansion, with a projected Compound Annual Growth Rate (CAGR) of 4.6% from 2024 to 2033. This sustained growth is propelled by increased investments in home renovation and new residential construction, driving demand for visually appealing and durable wall solutions. Emerging trends such as eco-friendly and sustainable materials, personalized design options, and the integration of smart home technologies are further stimulating market dynamism. The resurgence of wallpaper in interior design, coupled with the enduring appeal of traditional wall paneling and tiles, caters to a broad spectrum of consumer preferences and budgets.
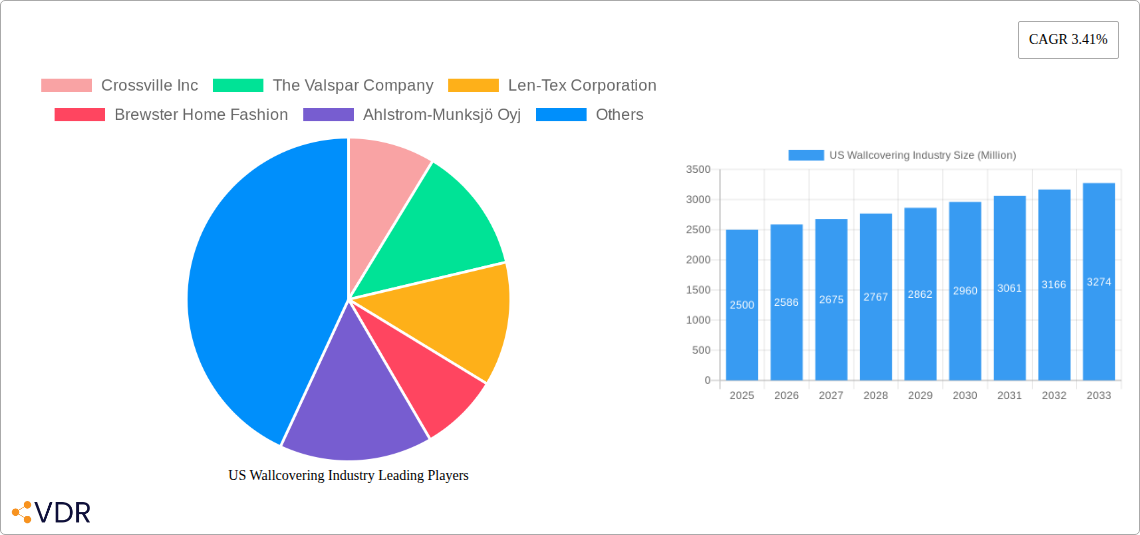
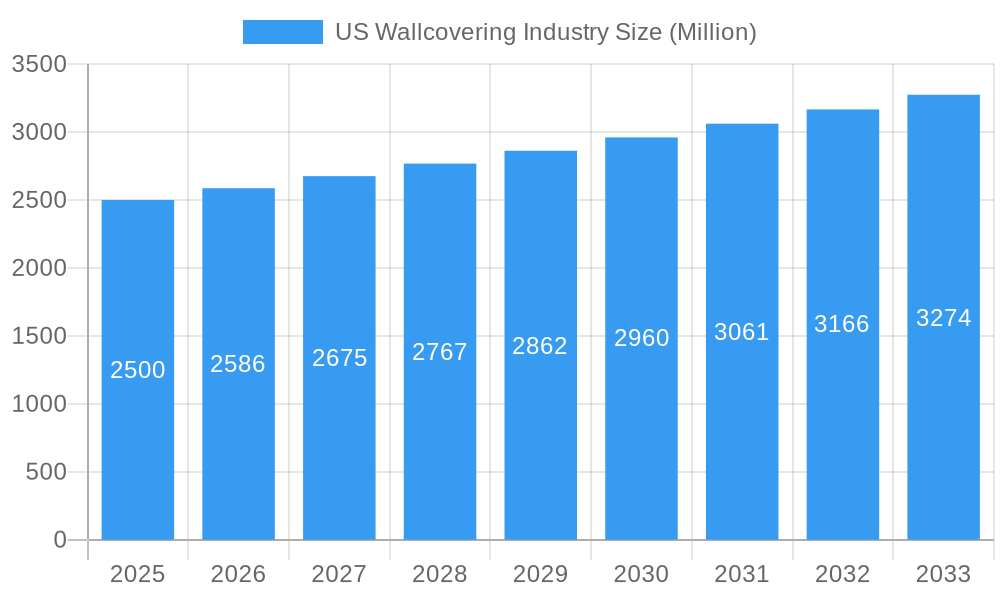
US Wallcovering Industry Market Size (In Million)
The market is segmented by sector, with the residential segment demonstrating significant dominance, while the commercial sector also offers substantial growth opportunities driven by demand for aesthetic and functional wallcoverings in offices, hospitality, and other commercial environments. Product types including wallpaper, wall panels, tiles, and metal wall coverings collectively hold considerable market share, reflecting diverse design needs and functional requirements. Key industry players are actively influencing market dynamics through innovation and strategic acquisitions. Comprehensive regional data will provide granular insights into localized growth patterns and emerging opportunities.
US Wallcovering Industry Company Market Share
US Wallcovering Industry Market Report: 2019-2033
This comprehensive report provides a detailed analysis of the US wallcovering industry, encompassing market dynamics, growth trends, key players, and future outlook. The study period spans from 2019 to 2033, with 2025 serving as the base and estimated year. The report segments the market by application (residential, commercial), end-user (specialty store, home center, furniture store, mass merchandizer, e-commerce, other), and type (wall panel, tiles, metal wall, wallpaper). This in-depth analysis is crucial for industry professionals seeking to navigate the evolving landscape of this dynamic market.
US Wallcovering Industry Market Dynamics & Structure
The US wallcovering market exhibits a moderately fragmented structure, with several key players vying for market share. Market concentration is expected to increase slightly by 2033 due to M&A activity and the expansion of larger players. Technological innovation, driven by advancements in materials science and digital printing, is a key driver, offering improved durability, aesthetics, and installation methods. Stringent environmental regulations regarding VOC emissions and sustainable sourcing are shaping product development and manufacturing processes. Competitive substitutes, such as paint and other wall finishes, present ongoing challenges. The market is influenced by end-user demographics, with trends in home renovation and commercial construction projects impacting demand. M&A activity has been moderate in recent years, with an estimated xx million USD in deal volume between 2019-2024, driven by consolidation efforts and expansion into new segments.
- Market Concentration: Moderately Fragmented (2025), trending towards slightly higher concentration by 2033.
- Technological Innovation: Focus on sustainable materials, digital printing, and improved installation.
- Regulatory Landscape: Increasingly stringent environmental regulations impacting material choices.
- Competitive Substitutes: Paint and other wall finishes pose a significant challenge.
- M&A Activity: Moderate activity observed between 2019-2024, estimated xx million USD in deal volume. xx% of deals involved international acquisitions.
US Wallcovering Industry Growth Trends & Insights
The US wallcovering market experienced steady growth during the historical period (2019-2024), with a CAGR of xx%. The market size in 2024 is estimated at xx million units. This growth is attributed to the increasing popularity of home renovations, commercial construction projects, and the rising demand for aesthetically pleasing and functional wall coverings. Technological advancements such as the introduction of eco-friendly materials and digitally printed wallpapers have boosted market penetration. Consumer behavior shifts towards personalized interiors and a preference for high-quality, durable products further support growth. The forecast period (2025-2033) is projected to witness continued expansion, with a forecasted CAGR of xx%, driven by factors such as increasing disposable incomes, urbanization, and the expansion of the e-commerce sector. The market size is expected to reach xx million units by 2033.
Dominant Regions, Countries, or Segments in US Wallcovering Industry
The residential segment dominates the US wallcovering market, accounting for approximately xx% of total market value in 2025. Growth in this segment is driven by rising homeownership rates, increasing disposable incomes, and a renewed focus on home improvement projects. Within the end-user category, specialty stores and home centers are the leading distribution channels, capturing significant market share. Geographically, the market is concentrated in high-population density areas across the eastern and western coasts of the United States. The commercial segment displays significant growth potential, driven by rising commercial construction activity and the need for durable and aesthetically pleasing wall coverings in office spaces, hospitality settings, and healthcare facilities. E-commerce is experiencing the fastest growth among the distribution channels, demonstrating a high adoption rate.
- Residential Segment: Leading segment, accounting for xx% of market value in 2025. Key drivers include home renovation trends, increasing disposable income, and homeownership rates.
- Specialty Stores and Home Centers: Leading distribution channels.
- Commercial Segment: High growth potential driven by commercial construction and demand for specialized wall coverings in commercial applications.
- E-commerce: Fastest-growing distribution channel.
US Wallcovering Industry Product Landscape
The US wallcovering industry offers a diverse range of products, from traditional wallpapers to innovative wall panels and tiles. Recent innovations focus on sustainable materials, improved durability, and enhanced ease of installation. Digital printing technology allows for customized designs and patterns, catering to individual preferences. High-performance wall coverings, offering features like sound absorption and moisture resistance, are gaining popularity in both residential and commercial applications. Unique selling propositions emphasize both aesthetic appeal and practical functionalities, such as ease of cleaning and maintenance. Technological advancements continuously enhance product performance and broaden application possibilities.
Key Drivers, Barriers & Challenges in US Wallcovering Industry
Key Drivers:
- Increasing disposable incomes and home renovation activities.
- Growing commercial construction sector.
- Advancements in digital printing and material technology.
- Rise of e-commerce platforms.
Challenges & Restraints:
- Competition from alternative wall finishes (paint, etc.).
- Fluctuations in raw material prices and supply chain disruptions.
- Stringent environmental regulations and compliance costs.
- Economic downturns impacting consumer spending. (Quantifiable impact: xx% decrease in sales during recessionary periods).
Emerging Opportunities in US Wallcovering Industry
Emerging trends include the rising demand for eco-friendly and sustainable wall coverings, personalized design options through digital printing, and the growth of smart home technology integration with wall coverings. Untapped markets include the commercial sector, particularly specialized applications such as healthcare and hospitality. Further expansion into online sales channels will be key to growth.
Growth Accelerators in the US Wallcovering Industry Industry
Long-term growth will be fueled by technological advancements in sustainable materials and enhanced installation methods. Strategic partnerships between manufacturers and designers will help develop unique and aesthetically pleasing products. Expansion into new international markets and the growing demand for customization present significant growth opportunities.
Key Players Shaping the US Wallcovering Industry Market
- Crossville Inc
- The Valspar Company
- Len-Tex Corporation
- Brewster Home Fashion
- Ahlstrom-Munksjö Oyj
- Wallquest Inc
- Rust-Oleum Corporation
- Sherwin-Williams Company
- Johns Manville Corporation
- York Wall Coverings
- Benjamin Moore & Co
- Georgia-Pacific
- F Schumacher
- Koroseal Wall Protection
- Mohawk Industries Inc
Notable Milestones in US Wallcovering Industry Sector
- 2020: Increased adoption of eco-friendly wallcoverings by major manufacturers.
- 2021: Launch of several new digitally printed wallpaper lines.
- 2022: Significant M&A activity among mid-sized companies.
- 2023: Introduction of smart wall coverings with integrated technology.
In-Depth US Wallcovering Industry Market Outlook
The US wallcovering market is poised for continued growth over the forecast period (2025-2033), driven by innovation, consumer demand, and the expansion of key market segments. Strategic opportunities lie in capitalizing on emerging trends in sustainability, digital personalization, and specialized applications within both residential and commercial markets. Companies that successfully adapt to evolving consumer preferences and technological advancements will be best positioned to capture market share in the coming years.
US Wallcovering Industry Segmentation
-
1. Type
- 1.1. Wall Panel
- 1.2. Tiles
- 1.3. Metal Wall
-
1.4. Wallpaper
- 1.4.1. Vinyl
- 1.4.2. Non-woven Wallpaper
- 1.4.3. Paper-based Wallpaper
- 1.4.4. Fabric Wallpapers
- 1.4.5. Other Wallpaper Types
-
2. Application
- 2.1. Residential
- 2.2. Commercial
-
3. End User
- 3.1. Specialty Store
- 3.2. Home Center
- 3.3. Furniture Store
- 3.4. Mass Merchandizer
- 3.5. E-commerce
- 3.6. Other End Users
US Wallcovering Industry Segmentation By Geography
-
1. North America
- 1.1. United States
- 1.2. Canada
- 1.3. Mexico
-
2. South America
- 2.1. Brazil
- 2.2. Argentina
- 2.3. Rest of South America
-
3. Europe
- 3.1. United Kingdom
- 3.2. Germany
- 3.3. France
- 3.4. Italy
- 3.5. Spain
- 3.6. Russia
- 3.7. Benelux
- 3.8. Nordics
- 3.9. Rest of Europe
-
4. Middle East & Africa
- 4.1. Turkey
- 4.2. Israel
- 4.3. GCC
- 4.4. North Africa
- 4.5. South Africa
- 4.6. Rest of Middle East & Africa
-
5. Asia Pacific
- 5.1. China
- 5.2. India
- 5.3. Japan
- 5.4. South Korea
- 5.5. ASEAN
- 5.6. Oceania
- 5.7. Rest of Asia Pacific
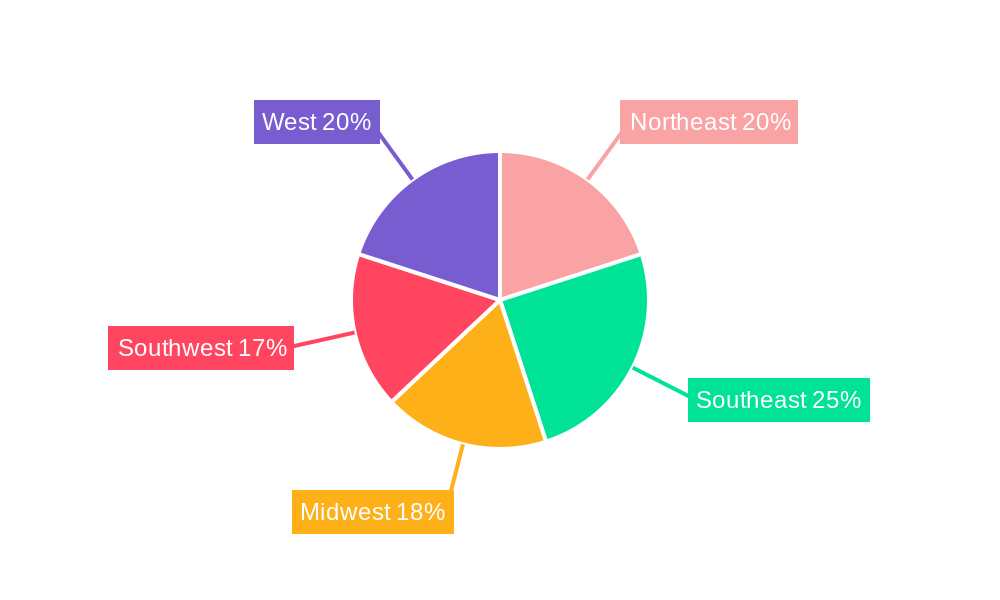
US Wallcovering Industry Regional Market Share
Geographic Coverage of US Wallcovering Industry
US Wallcovering Industry REPORT HIGHLIGHTS
| Aspects | Details |
|---|---|
| Study Period | 2020-2034 |
| Base Year | 2025 |
| Estimated Year | 2026 |
| Forecast Period | 2026-2034 |
| Historical Period | 2020-2025 |
| Growth Rate | CAGR of 4.6% from 2020-2034 |
| Segmentation |
|
Table of Contents
- 1. Introduction
- 1.1. Research Scope
- 1.2. Market Segmentation
- 1.3. Research Objective
- 1.4. Definitions and Assumptions
- 2. Executive Summary
- 2.1. Market Snapshot
- 3. Market Dynamics
- 3.1. Market Drivers
- 3.2. Market Restrains
- 3.3. Market Trends
- 3.4. Market Opportunities
- 4. Market Factor Analysis
- 4.1. Porters Five Forces
- 4.1.1. Bargaining Power of Suppliers
- 4.1.2. Bargaining Power of Buyers
- 4.1.3. Threat of New Entrants
- 4.1.4. Threat of Substitutes
- 4.1.5. Competitive Rivalry
- 4.2. PESTEL analysis
- 4.3. BCG Analysis
- 4.3.1. Stars (High Growth, High Market Share)
- 4.3.2. Cash Cows (Low Growth, High Market Share)
- 4.3.3. Question Mark (High Growth, Low Market Share)
- 4.3.4. Dogs (Low Growth, Low Market Share)
- 4.4. Ansoff Matrix Analysis
- 4.5. Supply Chain Analysis
- 4.6. Regulatory Landscape
- 4.7. Current Market Potential and Opportunity Assessment (TAM–SAM–SOM Framework)
- 4.8. VDR Analyst Note
- 4.1. Porters Five Forces
- 5. Market Analysis, Insights and Forecast 2021-2033
- 5.1. Market Analysis, Insights and Forecast - by Type
- 5.1.1. Wall Panel
- 5.1.2. Tiles
- 5.1.3. Metal Wall
- 5.1.4. Wallpaper
- 5.1.4.1. Vinyl
- 5.1.4.2. Non-woven Wallpaper
- 5.1.4.3. Paper-based Wallpaper
- 5.1.4.4. Fabric Wallpapers
- 5.1.4.5. Other Wallpaper Types
- 5.2. Market Analysis, Insights and Forecast - by Application
- 5.2.1. Residential
- 5.2.2. Commercial
- 5.3. Market Analysis, Insights and Forecast - by End User
- 5.3.1. Specialty Store
- 5.3.2. Home Center
- 5.3.3. Furniture Store
- 5.3.4. Mass Merchandizer
- 5.3.5. E-commerce
- 5.3.6. Other End Users
- 5.4. Market Analysis, Insights and Forecast - by Region
- 5.4.1. North America
- 5.4.2. South America
- 5.4.3. Europe
- 5.4.4. Middle East & Africa
- 5.4.5. Asia Pacific
- 5.1. Market Analysis, Insights and Forecast - by Type
- 6. Global US Wallcovering Industry Analysis, Insights and Forecast, 2021-2033
- 6.1. Market Analysis, Insights and Forecast - by Type
- 6.1.1. Wall Panel
- 6.1.2. Tiles
- 6.1.3. Metal Wall
- 6.1.4. Wallpaper
- 6.1.4.1. Vinyl
- 6.1.4.2. Non-woven Wallpaper
- 6.1.4.3. Paper-based Wallpaper
- 6.1.4.4. Fabric Wallpapers
- 6.1.4.5. Other Wallpaper Types
- 6.2. Market Analysis, Insights and Forecast - by Application
- 6.2.1. Residential
- 6.2.2. Commercial
- 6.3. Market Analysis, Insights and Forecast - by End User
- 6.3.1. Specialty Store
- 6.3.2. Home Center
- 6.3.3. Furniture Store
- 6.3.4. Mass Merchandizer
- 6.3.5. E-commerce
- 6.3.6. Other End Users
- 6.1. Market Analysis, Insights and Forecast - by Type
- 7. North America US Wallcovering Industry Analysis, Insights and Forecast, 2021-2033
- 7.1. Market Analysis, Insights and Forecast - by Type
- 7.1.1. Wall Panel
- 7.1.2. Tiles
- 7.1.3. Metal Wall
- 7.1.4. Wallpaper
- 7.1.4.1. Vinyl
- 7.1.4.2. Non-woven Wallpaper
- 7.1.4.3. Paper-based Wallpaper
- 7.1.4.4. Fabric Wallpapers
- 7.1.4.5. Other Wallpaper Types
- 7.2. Market Analysis, Insights and Forecast - by Application
- 7.2.1. Residential
- 7.2.2. Commercial
- 7.3. Market Analysis, Insights and Forecast - by End User
- 7.3.1. Specialty Store
- 7.3.2. Home Center
- 7.3.3. Furniture Store
- 7.3.4. Mass Merchandizer
- 7.3.5. E-commerce
- 7.3.6. Other End Users
- 7.1. Market Analysis, Insights and Forecast - by Type
- 8. South America US Wallcovering Industry Analysis, Insights and Forecast, 2021-2033
- 8.1. Market Analysis, Insights and Forecast - by Type
- 8.1.1. Wall Panel
- 8.1.2. Tiles
- 8.1.3. Metal Wall
- 8.1.4. Wallpaper
- 8.1.4.1. Vinyl
- 8.1.4.2. Non-woven Wallpaper
- 8.1.4.3. Paper-based Wallpaper
- 8.1.4.4. Fabric Wallpapers
- 8.1.4.5. Other Wallpaper Types
- 8.2. Market Analysis, Insights and Forecast - by Application
- 8.2.1. Residential
- 8.2.2. Commercial
- 8.3. Market Analysis, Insights and Forecast - by End User
- 8.3.1. Specialty Store
- 8.3.2. Home Center
- 8.3.3. Furniture Store
- 8.3.4. Mass Merchandizer
- 8.3.5. E-commerce
- 8.3.6. Other End Users
- 8.1. Market Analysis, Insights and Forecast - by Type
- 9. Europe US Wallcovering Industry Analysis, Insights and Forecast, 2021-2033
- 9.1. Market Analysis, Insights and Forecast - by Type
- 9.1.1. Wall Panel
- 9.1.2. Tiles
- 9.1.3. Metal Wall
- 9.1.4. Wallpaper
- 9.1.4.1. Vinyl
- 9.1.4.2. Non-woven Wallpaper
- 9.1.4.3. Paper-based Wallpaper
- 9.1.4.4. Fabric Wallpapers
- 9.1.4.5. Other Wallpaper Types
- 9.2. Market Analysis, Insights and Forecast - by Application
- 9.2.1. Residential
- 9.2.2. Commercial
- 9.3. Market Analysis, Insights and Forecast - by End User
- 9.3.1. Specialty Store
- 9.3.2. Home Center
- 9.3.3. Furniture Store
- 9.3.4. Mass Merchandizer
- 9.3.5. E-commerce
- 9.3.6. Other End Users
- 9.1. Market Analysis, Insights and Forecast - by Type
- 10. Middle East & Africa US Wallcovering Industry Analysis, Insights and Forecast, 2021-2033
- 10.1. Market Analysis, Insights and Forecast - by Type
- 10.1.1. Wall Panel
- 10.1.2. Tiles
- 10.1.3. Metal Wall
- 10.1.4. Wallpaper
- 10.1.4.1. Vinyl
- 10.1.4.2. Non-woven Wallpaper
- 10.1.4.3. Paper-based Wallpaper
- 10.1.4.4. Fabric Wallpapers
- 10.1.4.5. Other Wallpaper Types
- 10.2. Market Analysis, Insights and Forecast - by Application
- 10.2.1. Residential
- 10.2.2. Commercial
- 10.3. Market Analysis, Insights and Forecast - by End User
- 10.3.1. Specialty Store
- 10.3.2. Home Center
- 10.3.3. Furniture Store
- 10.3.4. Mass Merchandizer
- 10.3.5. E-commerce
- 10.3.6. Other End Users
- 10.1. Market Analysis, Insights and Forecast - by Type
- 11. Asia Pacific US Wallcovering Industry Analysis, Insights and Forecast, 2021-2033
- 11.1. Market Analysis, Insights and Forecast - by Type
- 11.1.1. Wall Panel
- 11.1.2. Tiles
- 11.1.3. Metal Wall
- 11.1.4. Wallpaper
- 11.1.4.1. Vinyl
- 11.1.4.2. Non-woven Wallpaper
- 11.1.4.3. Paper-based Wallpaper
- 11.1.4.4. Fabric Wallpapers
- 11.1.4.5. Other Wallpaper Types
- 11.2. Market Analysis, Insights and Forecast - by Application
- 11.2.1. Residential
- 11.2.2. Commercial
- 11.3. Market Analysis, Insights and Forecast - by End User
- 11.3.1. Specialty Store
- 11.3.2. Home Center
- 11.3.3. Furniture Store
- 11.3.4. Mass Merchandizer
- 11.3.5. E-commerce
- 11.3.6. Other End Users
- 11.1. Market Analysis, Insights and Forecast - by Type
- 12. Competitive Analysis
- 12.1. Company Profiles
- 12.1.1 Crossville Inc
- 12.1.1.1. Company Overview
- 12.1.1.2. Products
- 12.1.1.3. Company Financials
- 12.1.1.4. SWOT Analysis
- 12.1.2 The Valspar Company
- 12.1.2.1. Company Overview
- 12.1.2.2. Products
- 12.1.2.3. Company Financials
- 12.1.2.4. SWOT Analysis
- 12.1.3 Len-Tex Corporation
- 12.1.3.1. Company Overview
- 12.1.3.2. Products
- 12.1.3.3. Company Financials
- 12.1.3.4. SWOT Analysis
- 12.1.4 Brewster Home Fashion
- 12.1.4.1. Company Overview
- 12.1.4.2. Products
- 12.1.4.3. Company Financials
- 12.1.4.4. SWOT Analysis
- 12.1.5 Ahlstrom-Munksjö Oyj
- 12.1.5.1. Company Overview
- 12.1.5.2. Products
- 12.1.5.3. Company Financials
- 12.1.5.4. SWOT Analysis
- 12.1.6 Wallquest Inc *List Not Exhaustive
- 12.1.6.1. Company Overview
- 12.1.6.2. Products
- 12.1.6.3. Company Financials
- 12.1.6.4. SWOT Analysis
- 12.1.7 Rust-Oleum Coproration
- 12.1.7.1. Company Overview
- 12.1.7.2. Products
- 12.1.7.3. Company Financials
- 12.1.7.4. SWOT Analysis
- 12.1.8 Sherwin-Williams Company
- 12.1.8.1. Company Overview
- 12.1.8.2. Products
- 12.1.8.3. Company Financials
- 12.1.8.4. SWOT Analysis
- 12.1.9 Johns Manville Corporation
- 12.1.9.1. Company Overview
- 12.1.9.2. Products
- 12.1.9.3. Company Financials
- 12.1.9.4. SWOT Analysis
- 12.1.10 York Wall Coverings
- 12.1.10.1. Company Overview
- 12.1.10.2. Products
- 12.1.10.3. Company Financials
- 12.1.10.4. SWOT Analysis
- 12.1.11 Benjamin Moore & Co
- 12.1.11.1. Company Overview
- 12.1.11.2. Products
- 12.1.11.3. Company Financials
- 12.1.11.4. SWOT Analysis
- 12.1.12 Georgia-Pacific
- 12.1.12.1. Company Overview
- 12.1.12.2. Products
- 12.1.12.3. Company Financials
- 12.1.12.4. SWOT Analysis
- 12.1.13 F Schumacher
- 12.1.13.1. Company Overview
- 12.1.13.2. Products
- 12.1.13.3. Company Financials
- 12.1.13.4. SWOT Analysis
- 12.1.14 Koroseal Wall Protection
- 12.1.14.1. Company Overview
- 12.1.14.2. Products
- 12.1.14.3. Company Financials
- 12.1.14.4. SWOT Analysis
- 12.1.15 Mohawk Industries Inc
- 12.1.15.1. Company Overview
- 12.1.15.2. Products
- 12.1.15.3. Company Financials
- 12.1.15.4. SWOT Analysis
- 12.1.1 Crossville Inc
- 12.2. Market Entropy
- 12.2.1 Company's Key Areas Served
- 12.2.2 Recent Developments
- 12.3. Company Market Share Analysis 2025
- 12.3.1 Top 5 Companies Market Share Analysis
- 12.3.2 Top 3 Companies Market Share Analysis
- 12.4. List of Potential Customers
- 13. Research Methodology
List of Figures
- Figure 1: Global US Wallcovering Industry Revenue Breakdown (million, %) by Region 2025 & 2033
- Figure 2: North America US Wallcovering Industry Revenue (million), by Type 2025 & 2033
- Figure 3: North America US Wallcovering Industry Revenue Share (%), by Type 2025 & 2033
- Figure 4: North America US Wallcovering Industry Revenue (million), by Application 2025 & 2033
- Figure 5: North America US Wallcovering Industry Revenue Share (%), by Application 2025 & 2033
- Figure 6: North America US Wallcovering Industry Revenue (million), by End User 2025 & 2033
- Figure 7: North America US Wallcovering Industry Revenue Share (%), by End User 2025 & 2033
- Figure 8: North America US Wallcovering Industry Revenue (million), by Country 2025 & 2033
- Figure 9: North America US Wallcovering Industry Revenue Share (%), by Country 2025 & 2033
- Figure 10: South America US Wallcovering Industry Revenue (million), by Type 2025 & 2033
- Figure 11: South America US Wallcovering Industry Revenue Share (%), by Type 2025 & 2033
- Figure 12: South America US Wallcovering Industry Revenue (million), by Application 2025 & 2033
- Figure 13: South America US Wallcovering Industry Revenue Share (%), by Application 2025 & 2033
- Figure 14: South America US Wallcovering Industry Revenue (million), by End User 2025 & 2033
- Figure 15: South America US Wallcovering Industry Revenue Share (%), by End User 2025 & 2033
- Figure 16: South America US Wallcovering Industry Revenue (million), by Country 2025 & 2033
- Figure 17: South America US Wallcovering Industry Revenue Share (%), by Country 2025 & 2033
- Figure 18: Europe US Wallcovering Industry Revenue (million), by Type 2025 & 2033
- Figure 19: Europe US Wallcovering Industry Revenue Share (%), by Type 2025 & 2033
- Figure 20: Europe US Wallcovering Industry Revenue (million), by Application 2025 & 2033
- Figure 21: Europe US Wallcovering Industry Revenue Share (%), by Application 2025 & 2033
- Figure 22: Europe US Wallcovering Industry Revenue (million), by End User 2025 & 2033
- Figure 23: Europe US Wallcovering Industry Revenue Share (%), by End User 2025 & 2033
- Figure 24: Europe US Wallcovering Industry Revenue (million), by Country 2025 & 2033
- Figure 25: Europe US Wallcovering Industry Revenue Share (%), by Country 2025 & 2033
- Figure 26: Middle East & Africa US Wallcovering Industry Revenue (million), by Type 2025 & 2033
- Figure 27: Middle East & Africa US Wallcovering Industry Revenue Share (%), by Type 2025 & 2033
- Figure 28: Middle East & Africa US Wallcovering Industry Revenue (million), by Application 2025 & 2033
- Figure 29: Middle East & Africa US Wallcovering Industry Revenue Share (%), by Application 2025 & 2033
- Figure 30: Middle East & Africa US Wallcovering Industry Revenue (million), by End User 2025 & 2033
- Figure 31: Middle East & Africa US Wallcovering Industry Revenue Share (%), by End User 2025 & 2033
- Figure 32: Middle East & Africa US Wallcovering Industry Revenue (million), by Country 2025 & 2033
- Figure 33: Middle East & Africa US Wallcovering Industry Revenue Share (%), by Country 2025 & 2033
- Figure 34: Asia Pacific US Wallcovering Industry Revenue (million), by Type 2025 & 2033
- Figure 35: Asia Pacific US Wallcovering Industry Revenue Share (%), by Type 2025 & 2033
- Figure 36: Asia Pacific US Wallcovering Industry Revenue (million), by Application 2025 & 2033
- Figure 37: Asia Pacific US Wallcovering Industry Revenue Share (%), by Application 2025 & 2033
- Figure 38: Asia Pacific US Wallcovering Industry Revenue (million), by End User 2025 & 2033
- Figure 39: Asia Pacific US Wallcovering Industry Revenue Share (%), by End User 2025 & 2033
- Figure 40: Asia Pacific US Wallcovering Industry Revenue (million), by Country 2025 & 2033
- Figure 41: Asia Pacific US Wallcovering Industry Revenue Share (%), by Country 2025 & 2033
List of Tables
- Table 1: Global US Wallcovering Industry Revenue million Forecast, by Type 2020 & 2033
- Table 2: Global US Wallcovering Industry Revenue million Forecast, by Application 2020 & 2033
- Table 3: Global US Wallcovering Industry Revenue million Forecast, by End User 2020 & 2033
- Table 4: Global US Wallcovering Industry Revenue million Forecast, by Region 2020 & 2033
- Table 5: Global US Wallcovering Industry Revenue million Forecast, by Type 2020 & 2033
- Table 6: Global US Wallcovering Industry Revenue million Forecast, by Application 2020 & 2033
- Table 7: Global US Wallcovering Industry Revenue million Forecast, by End User 2020 & 2033
- Table 8: Global US Wallcovering Industry Revenue million Forecast, by Country 2020 & 2033
- Table 9: United States US Wallcovering Industry Revenue (million) Forecast, by Application 2020 & 2033
- Table 10: Canada US Wallcovering Industry Revenue (million) Forecast, by Application 2020 & 2033
- Table 11: Mexico US Wallcovering Industry Revenue (million) Forecast, by Application 2020 & 2033
- Table 12: Global US Wallcovering Industry Revenue million Forecast, by Type 2020 & 2033
- Table 13: Global US Wallcovering Industry Revenue million Forecast, by Application 2020 & 2033
- Table 14: Global US Wallcovering Industry Revenue million Forecast, by End User 2020 & 2033
- Table 15: Global US Wallcovering Industry Revenue million Forecast, by Country 2020 & 2033
- Table 16: Brazil US Wallcovering Industry Revenue (million) Forecast, by Application 2020 & 2033
- Table 17: Argentina US Wallcovering Industry Revenue (million) Forecast, by Application 2020 & 2033
- Table 18: Rest of South America US Wallcovering Industry Revenue (million) Forecast, by Application 2020 & 2033
- Table 19: Global US Wallcovering Industry Revenue million Forecast, by Type 2020 & 2033
- Table 20: Global US Wallcovering Industry Revenue million Forecast, by Application 2020 & 2033
- Table 21: Global US Wallcovering Industry Revenue million Forecast, by End User 2020 & 2033
- Table 22: Global US Wallcovering Industry Revenue million Forecast, by Country 2020 & 2033
- Table 23: United Kingdom US Wallcovering Industry Revenue (million) Forecast, by Application 2020 & 2033
- Table 24: Germany US Wallcovering Industry Revenue (million) Forecast, by Application 2020 & 2033
- Table 25: France US Wallcovering Industry Revenue (million) Forecast, by Application 2020 & 2033
- Table 26: Italy US Wallcovering Industry Revenue (million) Forecast, by Application 2020 & 2033
- Table 27: Spain US Wallcovering Industry Revenue (million) Forecast, by Application 2020 & 2033
- Table 28: Russia US Wallcovering Industry Revenue (million) Forecast, by Application 2020 & 2033
- Table 29: Benelux US Wallcovering Industry Revenue (million) Forecast, by Application 2020 & 2033
- Table 30: Nordics US Wallcovering Industry Revenue (million) Forecast, by Application 2020 & 2033
- Table 31: Rest of Europe US Wallcovering Industry Revenue (million) Forecast, by Application 2020 & 2033
- Table 32: Global US Wallcovering Industry Revenue million Forecast, by Type 2020 & 2033
- Table 33: Global US Wallcovering Industry Revenue million Forecast, by Application 2020 & 2033
- Table 34: Global US Wallcovering Industry Revenue million Forecast, by End User 2020 & 2033
- Table 35: Global US Wallcovering Industry Revenue million Forecast, by Country 2020 & 2033
- Table 36: Turkey US Wallcovering Industry Revenue (million) Forecast, by Application 2020 & 2033
- Table 37: Israel US Wallcovering Industry Revenue (million) Forecast, by Application 2020 & 2033
- Table 38: GCC US Wallcovering Industry Revenue (million) Forecast, by Application 2020 & 2033
- Table 39: North Africa US Wallcovering Industry Revenue (million) Forecast, by Application 2020 & 2033
- Table 40: South Africa US Wallcovering Industry Revenue (million) Forecast, by Application 2020 & 2033
- Table 41: Rest of Middle East & Africa US Wallcovering Industry Revenue (million) Forecast, by Application 2020 & 2033
- Table 42: Global US Wallcovering Industry Revenue million Forecast, by Type 2020 & 2033
- Table 43: Global US Wallcovering Industry Revenue million Forecast, by Application 2020 & 2033
- Table 44: Global US Wallcovering Industry Revenue million Forecast, by End User 2020 & 2033
- Table 45: Global US Wallcovering Industry Revenue million Forecast, by Country 2020 & 2033
- Table 46: China US Wallcovering Industry Revenue (million) Forecast, by Application 2020 & 2033
- Table 47: India US Wallcovering Industry Revenue (million) Forecast, by Application 2020 & 2033
- Table 48: Japan US Wallcovering Industry Revenue (million) Forecast, by Application 2020 & 2033
- Table 49: South Korea US Wallcovering Industry Revenue (million) Forecast, by Application 2020 & 2033
- Table 50: ASEAN US Wallcovering Industry Revenue (million) Forecast, by Application 2020 & 2033
- Table 51: Oceania US Wallcovering Industry Revenue (million) Forecast, by Application 2020 & 2033
- Table 52: Rest of Asia Pacific US Wallcovering Industry Revenue (million) Forecast, by Application 2020 & 2033
Frequently Asked Questions
1. What is the projected Compound Annual Growth Rate (CAGR) of the US Wallcovering Industry?
The projected CAGR is approximately 4.6%.
2. Which companies are prominent players in the US Wallcovering Industry?
Key companies in the market include Crossville Inc, The Valspar Company, Len-Tex Corporation, Brewster Home Fashion, Ahlstrom-Munksjö Oyj, Wallquest Inc *List Not Exhaustive, Rust-Oleum Coproration, Sherwin-Williams Company, Johns Manville Corporation, York Wall Coverings, Benjamin Moore & Co, Georgia-Pacific, F Schumacher, Koroseal Wall Protection, Mohawk Industries Inc.
3. What are the main segments of the US Wallcovering Industry?
The market segments include Type, Application, End User.
4. Can you provide details about the market size?
The market size is estimated to be USD 36.54 million as of 2022.
5. What are some drivers contributing to market growth?
; Rebounding Residential Construction Activity; Recovery in Wall Panel Sales Aided by Higher Awareness; Increasing Demand for Digitally Printed Solutions; Growth in Non-woven and Paper-based Wallpapers.
6. What are the notable trends driving market growth?
Rebounding Residential Construction Activity in the USA is Boosting the Market.
7. Are there any restraints impacting market growth?
; Strong Competition from the Paints Segment; Recent Changes in Macro-environment Expected to Impact Customer Spending.
8. Can you provide examples of recent developments in the market?
N/A
9. What pricing options are available for accessing the report?
Pricing options include single-user, multi-user, and enterprise licenses priced at USD 3800, USD 4500, and USD 5800 respectively.
10. Is the market size provided in terms of value or volume?
The market size is provided in terms of value, measured in million.
11. Are there any specific market keywords associated with the report?
Yes, the market keyword associated with the report is "US Wallcovering Industry," which aids in identifying and referencing the specific market segment covered.
12. How do I determine which pricing option suits my needs best?
The pricing options vary based on user requirements and access needs. Individual users may opt for single-user licenses, while businesses requiring broader access may choose multi-user or enterprise licenses for cost-effective access to the report.
13. Are there any additional resources or data provided in the US Wallcovering Industry report?
While the report offers comprehensive insights, it's advisable to review the specific contents or supplementary materials provided to ascertain if additional resources or data are available.
14. How can I stay updated on further developments or reports in the US Wallcovering Industry?
To stay informed about further developments, trends, and reports in the US Wallcovering Industry, consider subscribing to industry newsletters, following relevant companies and organizations, or regularly checking reputable industry news sources and publications.
Methodology
Step 1 - Identification of Relevant Samples Size from Population Database


Step 2 - Approaches for Defining Global Market Size (Value, Volume* & Price*)

Note*: In applicable scenarios
Step 3 - Data Sources
Primary Research
- Web Analytics
- Survey Reports
- Research Institute
- Latest Research Reports
- Opinion Leaders
Secondary Research
- Annual Reports
- White Paper
- Latest Press Release
- Industry Association
- Paid Database
- Investor Presentations

Step 4 - Data Triangulation
Involves using different sources of information in order to increase the validity of a study
These sources are likely to be stakeholders in a program - participants, other researchers, program staff, other community members, and so on.
Then we put all data in single framework & apply various statistical tools to find out the dynamic on the market.
During the analysis stage, feedback from the stakeholder groups would be compared to determine areas of agreement as well as areas of divergence