

Key Insights
The U.S. wall covering and wall décor market, featuring products such as wall panels, tiles, wallpaper, and metal wall coverings, is poised for robust expansion. The market size is projected to reach $66.89 billion by 2025, with a Compound Annual Growth Rate (CAGR) of 8.55% anticipated from 2025 to 2033. This growth trajectory is propelled by escalating home improvement initiatives and a heightened demand for aesthetically appealing interiors, driven by increasing disposable incomes. Commercial and institutional sectors also contribute significantly through interior upgrades for enhanced branding and visual appeal. The market's expansion is further supported by the growing preference for eco-friendly and sustainable wall covering solutions, alongside the increasing adoption of removable wall coverings due to their ease of installation and versatility. Potential headwinds include fluctuations in raw material costs and economic volatility.
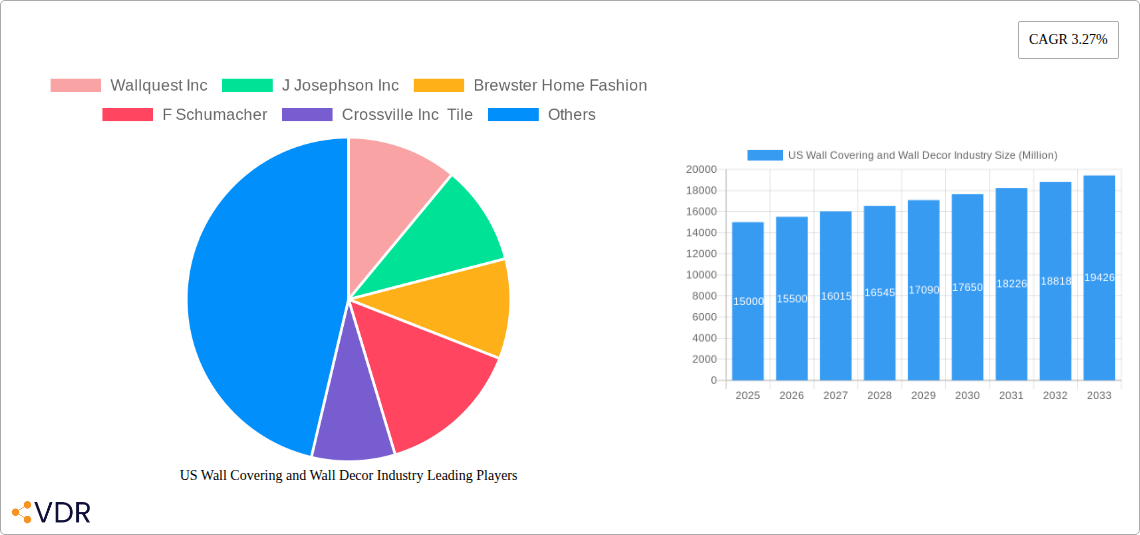
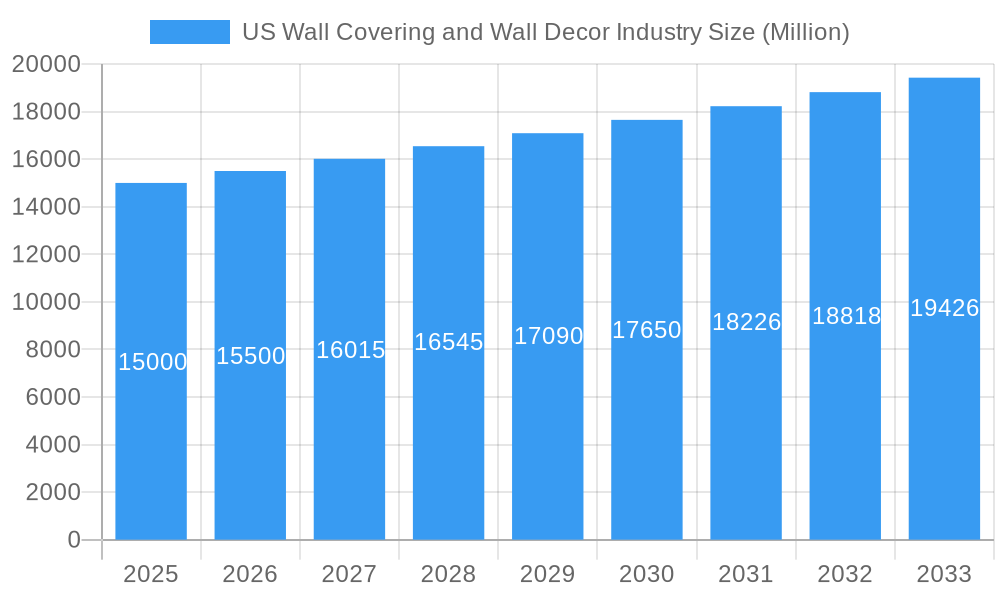
US Wall Covering and Wall Decor Industry Market Size (In Billion)
Analysis by segment indicates that the residential sector leads in market share over non-residential applications, with wallpaper and wall panels being the dominant product categories. Distribution is multifaceted, encompassing specialty stores, home centers, mass merchandisers, and e-commerce channels. Leading companies such as Wallquest Inc., Brewster Home Fashion, and Sherwin-Williams are focusing on product innovation, brand development, and optimized distribution to strengthen their market positions. Regional growth is expected to be more pronounced in the Northeast, West, and Southeast, attributed to higher disposable incomes and a greater emphasis on renovation projects. Strategic planning that accounts for these trends and regional dynamics is crucial for maximizing market penetration.
US Wall Covering and Wall Decor Industry Company Market Share
US Wall Covering and Wall Decor Industry Market Report: 2019-2033
This comprehensive report provides a detailed analysis of the US wall covering and wall decor industry, covering the period 2019-2033. It offers invaluable insights for industry professionals, investors, and strategic decision-makers seeking to understand market dynamics, growth trends, and future opportunities within this dynamic sector. The report utilizes a robust methodology, integrating both quantitative and qualitative data to provide a holistic view of the market. High-growth keywords such as "wall covering," "wall decor," "wallpaper," "wall panels," "tile," "residential design," and "commercial interiors" are strategically incorporated throughout the report to enhance its search engine optimization (SEO).
US Wall Covering and Wall Decor Industry Market Dynamics & Structure
This section analyzes the competitive landscape, technological advancements, regulatory influences, and market trends within the US wall covering and wall decor industry. The study period spans from 2019 to 2033, with 2025 serving as both the base and estimated year. The report delves into market concentration, identifying key players and their respective market share. It explores the impact of technological innovations, such as the rise of eco-friendly materials and digitally printed wallpapers, on market dynamics. Regulatory frameworks related to building codes and material safety are also examined.
- Market Concentration: The industry is characterized by a mix of large multinational corporations and smaller niche players. The top five companies (Wallquest Inc, J Josephson Inc, Brewster Home Fashion, F Schumacher, Sherwin-Williams Company) account for approximately xx% of the total market revenue in 2025.
- Technological Innovation Drivers: The increasing demand for sustainable and technologically advanced wall coverings is a major growth driver. This includes innovations in printing technologies, smart materials, and environmentally friendly manufacturing processes.
- Regulatory Frameworks: Building codes and regulations concerning fire safety, VOC emissions, and material durability significantly impact product design and market adoption.
- Competitive Product Substitutes: Paints, murals, and other decorative elements pose competitive challenges.
- End-User Demographics: The report analyzes demographic trends and their influence on preferences for different wall covering types and styles. This includes factors such as age, income level, and lifestyle choices.
- M&A Trends: The past five years have witnessed xx M&A deals in the US wall covering and wall decor industry, with a focus on expanding product portfolios and geographic reach.
US Wall Covering and Wall Decor Industry Growth Trends & Insights
This section provides a detailed analysis of the market's growth trajectory, considering factors such as market size, adoption rates of new technologies, and consumer behavior shifts. Utilizing comprehensive data analysis and market research, this section projects a CAGR of xx% from 2025 to 2033. Specific metrics including market penetration rates for various product types in different segments (residential vs. non-residential) are examined. The impact of technological disruptions, particularly within digital printing and material science, is analyzed. Consumer preference shifts, influenced by factors like sustainability, design aesthetics, and DIY trends, are also explored.
Dominant Regions, Countries, or Segments in US Wall Covering and Wall Decor Industry
This section pinpoints the leading regions, countries, or segments within the US wall covering and wall decor market. The analysis encompasses various dimensions, including product type (wall panels, tiles, metal wall coverings, wallpaper, wall decor), type (removable vs. non-removable), application (residential vs. non-residential), and distribution channel (specialty stores, home centers, mass merchandisers, e-commerce). The report identifies the key growth drivers and dominance factors for each leading segment, including regional economic conditions, infrastructure development, and consumer preferences.
- Leading Segment: The residential segment for wallpaper is projected to remain the largest segment with xx million units in 2025.
- Key Growth Drivers: Growing disposable incomes in suburban areas and an increasing focus on home improvement projects are primary growth drivers for residential applications. New construction activities and commercial refurbishment projects drive growth in the non-residential segment.
- Market Share and Growth Potential: Detailed analysis of market share and growth potential across all segments and channels.
US Wall Covering and Wall Decor Industry Product Landscape
This section examines product innovation, including the introduction of sustainable materials, smart technologies (e.g., interactive wall coverings), and enhanced design aesthetics. It analyses how these innovations are driving adoption across different application segments, highlighting unique selling propositions (USPs) and their corresponding market impact. The performance metrics of key product types, such as durability, ease of installation, and maintenance requirements, are evaluated.
Key Drivers, Barriers & Challenges in US Wall Covering and Wall Decor Industry
This section highlights the factors propelling market growth, such as increased disposable income, rising home improvement activities, and growing interest in interior design trends. It further analyzes challenges such as supply chain disruptions, price volatility of raw materials, and intense competition. The impact of these challenges on market dynamics, including potential revenue losses or growth stagnation, is quantified whenever data is available.
- Key Drivers: Strong demand for home renovations, expanding commercial construction, and the adoption of innovative technologies.
- Key Challenges: Fluctuations in raw material prices, supply chain constraints, and competition from substitute products.
Emerging Opportunities in US Wall Covering and Wall Decor Industry
This section identifies untapped market segments, innovative application areas, and evolving consumer preferences that present emerging opportunities. Examples include the growth of eco-friendly materials, the integration of smart technology, and personalized wall décor solutions.
Growth Accelerators in the US Wall Covering and Wall Decor Industry Industry
This section focuses on the long-term growth prospects, driven by technological advancements, strategic partnerships, and market expansion strategies. The emergence of new materials, manufacturing processes, and design innovations is analyzed as a significant growth driver.
Key Players Shaping the US Wall Covering and Wall Decor Industry Market
- Wallquest Inc
- J Josephson Inc
- Brewster Home Fashion
- F Schumacher
- Crossville Inc Tile
- Sherwin-Williams Company
- York Wall Coverings
- Benjamin Moore & Co
- Len-Tex Corporation
- Koroseal Wall Protection
Notable Milestones in US Wall Covering and Wall Decor Industry Sector
- November 2022: Floor & Décor opens a new location in Coral Springs, Florida, its 10th in South Florida, signaling expansion in a key market.
- November 2022: Floor & Décor expands its presence with a new store in Timnath, Colorado, highlighting geographic market expansion strategies.
In-Depth US Wall Covering and Wall Decor Industry Market Outlook
This concluding section summarizes the key growth drivers, market trends, and strategic opportunities identified in the report. It emphasizes the long-term potential of the US wall covering and wall decor industry, highlighting areas for future investment and growth. The forecast period extends to 2033, providing a long-term perspective on market evolution and strategic implications.
US Wall Covering and Wall Decor Industry Segmentation
-
1. Product Type
- 1.1. Wall Panel
- 1.2. Tiles
- 1.3. Metal Wall
-
1.4. Wallpaper
- 1.4.1. Vinyl
- 1.4.2. Non-woven Wallpaper
- 1.4.3. Paper-based Wallpaper
- 1.4.4. Fabric Wallpapers
- 1.4.5. Other Wallpapers
-
1.5. Wall Decor
- 1.5.1. Wall Art
- 1.5.2. Wall Decal
- 1.5.3. Wall Frames (Mirrors, etc.)
- 1.5.4. Other Wall Decors
-
2. Type
- 2.1. Non-Removable
-
3. Application
- 3.1. Residential
- 3.2. Non-resi
-
4. Distribution Channel
- 4.1. Specialty Store
- 4.2. Home Center/Furniture
- 4.3. Mass Merchandiser
- 4.4. E-commerce
US Wall Covering and Wall Decor Industry Segmentation By Geography
-
1. North America
- 1.1. United States
- 1.2. Canada
- 1.3. Mexico
-
2. South America
- 2.1. Brazil
- 2.2. Argentina
- 2.3. Rest of South America
-
3. Europe
- 3.1. United Kingdom
- 3.2. Germany
- 3.3. France
- 3.4. Italy
- 3.5. Spain
- 3.6. Russia
- 3.7. Benelux
- 3.8. Nordics
- 3.9. Rest of Europe
-
4. Middle East & Africa
- 4.1. Turkey
- 4.2. Israel
- 4.3. GCC
- 4.4. North Africa
- 4.5. South Africa
- 4.6. Rest of Middle East & Africa
-
5. Asia Pacific
- 5.1. China
- 5.2. India
- 5.3. Japan
- 5.4. South Korea
- 5.5. ASEAN
- 5.6. Oceania
- 5.7. Rest of Asia Pacific
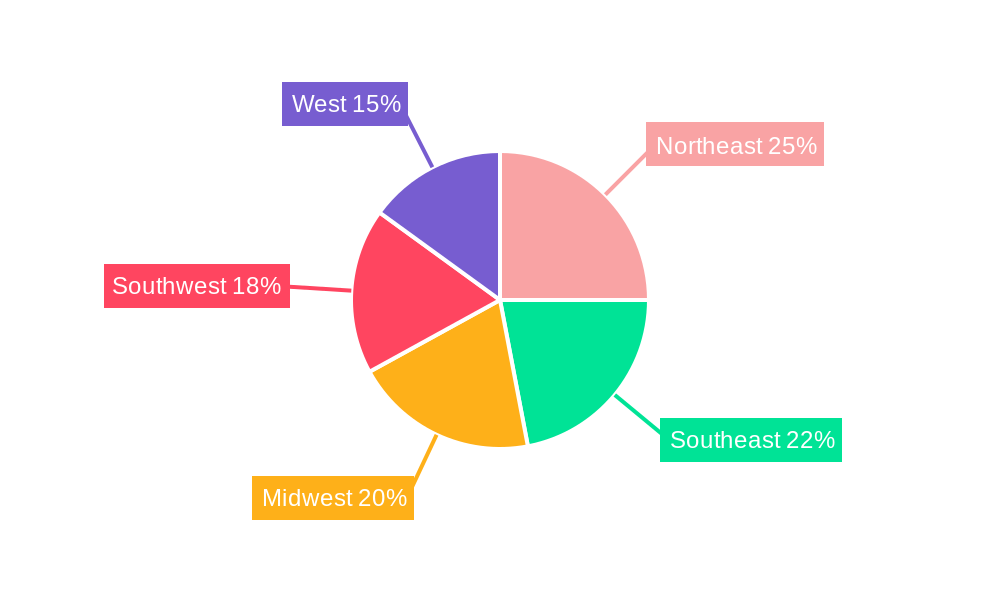
US Wall Covering and Wall Decor Industry Regional Market Share
Geographic Coverage of US Wall Covering and Wall Decor Industry
US Wall Covering and Wall Decor Industry REPORT HIGHLIGHTS
| Aspects | Details |
|---|---|
| Study Period | 2020-2034 |
| Base Year | 2025 |
| Estimated Year | 2026 |
| Forecast Period | 2026-2034 |
| Historical Period | 2020-2025 |
| Growth Rate | CAGR of 8.55% from 2020-2034 |
| Segmentation |
|
Table of Contents
- 1. Introduction
- 1.1. Research Scope
- 1.2. Market Segmentation
- 1.3. Research Objective
- 1.4. Definitions and Assumptions
- 2. Executive Summary
- 2.1. Market Snapshot
- 3. Market Dynamics
- 3.1. Market Drivers
- 3.2. Market Restrains
- 3.3. Market Trends
- 3.4. Market Opportunities
- 4. Market Factor Analysis
- 4.1. Porters Five Forces
- 4.1.1. Bargaining Power of Suppliers
- 4.1.2. Bargaining Power of Buyers
- 4.1.3. Threat of New Entrants
- 4.1.4. Threat of Substitutes
- 4.1.5. Competitive Rivalry
- 4.2. PESTEL analysis
- 4.3. BCG Analysis
- 4.3.1. Stars (High Growth, High Market Share)
- 4.3.2. Cash Cows (Low Growth, High Market Share)
- 4.3.3. Question Mark (High Growth, Low Market Share)
- 4.3.4. Dogs (Low Growth, Low Market Share)
- 4.4. Ansoff Matrix Analysis
- 4.5. Supply Chain Analysis
- 4.6. Regulatory Landscape
- 4.7. Current Market Potential and Opportunity Assessment (TAM–SAM–SOM Framework)
- 4.8. VDR Analyst Note
- 4.1. Porters Five Forces
- 5. Market Analysis, Insights and Forecast 2021-2033
- 5.1. Market Analysis, Insights and Forecast - by Product Type
- 5.1.1. Wall Panel
- 5.1.2. Tiles
- 5.1.3. Metal Wall
- 5.1.4. Wallpaper
- 5.1.4.1. Vinyl
- 5.1.4.2. Non-woven Wallpaper
- 5.1.4.3. Paper-based Wallpaper
- 5.1.4.4. Fabric Wallpapers
- 5.1.4.5. Other Wallpapers
- 5.1.5. Wall Decor
- 5.1.5.1. Wall Art
- 5.1.5.2. Wall Decal
- 5.1.5.3. Wall Frames (Mirrors, etc.)
- 5.1.5.4. Other Wall Decors
- 5.2. Market Analysis, Insights and Forecast - by Type
- 5.2.1. Non-Removable
- 5.3. Market Analysis, Insights and Forecast - by Application
- 5.3.1. Residential
- 5.3.2. Non-resi
- 5.4. Market Analysis, Insights and Forecast - by Distribution Channel
- 5.4.1. Specialty Store
- 5.4.2. Home Center/Furniture
- 5.4.3. Mass Merchandiser
- 5.4.4. E-commerce
- 5.5. Market Analysis, Insights and Forecast - by Region
- 5.5.1. North America
- 5.5.2. South America
- 5.5.3. Europe
- 5.5.4. Middle East & Africa
- 5.5.5. Asia Pacific
- 5.1. Market Analysis, Insights and Forecast - by Product Type
- 6. Global US Wall Covering and Wall Decor Industry Analysis, Insights and Forecast, 2021-2033
- 6.1. Market Analysis, Insights and Forecast - by Product Type
- 6.1.1. Wall Panel
- 6.1.2. Tiles
- 6.1.3. Metal Wall
- 6.1.4. Wallpaper
- 6.1.4.1. Vinyl
- 6.1.4.2. Non-woven Wallpaper
- 6.1.4.3. Paper-based Wallpaper
- 6.1.4.4. Fabric Wallpapers
- 6.1.4.5. Other Wallpapers
- 6.1.5. Wall Decor
- 6.1.5.1. Wall Art
- 6.1.5.2. Wall Decal
- 6.1.5.3. Wall Frames (Mirrors, etc.)
- 6.1.5.4. Other Wall Decors
- 6.2. Market Analysis, Insights and Forecast - by Type
- 6.2.1. Non-Removable
- 6.3. Market Analysis, Insights and Forecast - by Application
- 6.3.1. Residential
- 6.3.2. Non-resi
- 6.4. Market Analysis, Insights and Forecast - by Distribution Channel
- 6.4.1. Specialty Store
- 6.4.2. Home Center/Furniture
- 6.4.3. Mass Merchandiser
- 6.4.4. E-commerce
- 6.1. Market Analysis, Insights and Forecast - by Product Type
- 7. North America US Wall Covering and Wall Decor Industry Analysis, Insights and Forecast, 2021-2033
- 7.1. Market Analysis, Insights and Forecast - by Product Type
- 7.1.1. Wall Panel
- 7.1.2. Tiles
- 7.1.3. Metal Wall
- 7.1.4. Wallpaper
- 7.1.4.1. Vinyl
- 7.1.4.2. Non-woven Wallpaper
- 7.1.4.3. Paper-based Wallpaper
- 7.1.4.4. Fabric Wallpapers
- 7.1.4.5. Other Wallpapers
- 7.1.5. Wall Decor
- 7.1.5.1. Wall Art
- 7.1.5.2. Wall Decal
- 7.1.5.3. Wall Frames (Mirrors, etc.)
- 7.1.5.4. Other Wall Decors
- 7.2. Market Analysis, Insights and Forecast - by Type
- 7.2.1. Non-Removable
- 7.3. Market Analysis, Insights and Forecast - by Application
- 7.3.1. Residential
- 7.3.2. Non-resi
- 7.4. Market Analysis, Insights and Forecast - by Distribution Channel
- 7.4.1. Specialty Store
- 7.4.2. Home Center/Furniture
- 7.4.3. Mass Merchandiser
- 7.4.4. E-commerce
- 7.1. Market Analysis, Insights and Forecast - by Product Type
- 8. South America US Wall Covering and Wall Decor Industry Analysis, Insights and Forecast, 2021-2033
- 8.1. Market Analysis, Insights and Forecast - by Product Type
- 8.1.1. Wall Panel
- 8.1.2. Tiles
- 8.1.3. Metal Wall
- 8.1.4. Wallpaper
- 8.1.4.1. Vinyl
- 8.1.4.2. Non-woven Wallpaper
- 8.1.4.3. Paper-based Wallpaper
- 8.1.4.4. Fabric Wallpapers
- 8.1.4.5. Other Wallpapers
- 8.1.5. Wall Decor
- 8.1.5.1. Wall Art
- 8.1.5.2. Wall Decal
- 8.1.5.3. Wall Frames (Mirrors, etc.)
- 8.1.5.4. Other Wall Decors
- 8.2. Market Analysis, Insights and Forecast - by Type
- 8.2.1. Non-Removable
- 8.3. Market Analysis, Insights and Forecast - by Application
- 8.3.1. Residential
- 8.3.2. Non-resi
- 8.4. Market Analysis, Insights and Forecast - by Distribution Channel
- 8.4.1. Specialty Store
- 8.4.2. Home Center/Furniture
- 8.4.3. Mass Merchandiser
- 8.4.4. E-commerce
- 8.1. Market Analysis, Insights and Forecast - by Product Type
- 9. Europe US Wall Covering and Wall Decor Industry Analysis, Insights and Forecast, 2021-2033
- 9.1. Market Analysis, Insights and Forecast - by Product Type
- 9.1.1. Wall Panel
- 9.1.2. Tiles
- 9.1.3. Metal Wall
- 9.1.4. Wallpaper
- 9.1.4.1. Vinyl
- 9.1.4.2. Non-woven Wallpaper
- 9.1.4.3. Paper-based Wallpaper
- 9.1.4.4. Fabric Wallpapers
- 9.1.4.5. Other Wallpapers
- 9.1.5. Wall Decor
- 9.1.5.1. Wall Art
- 9.1.5.2. Wall Decal
- 9.1.5.3. Wall Frames (Mirrors, etc.)
- 9.1.5.4. Other Wall Decors
- 9.2. Market Analysis, Insights and Forecast - by Type
- 9.2.1. Non-Removable
- 9.3. Market Analysis, Insights and Forecast - by Application
- 9.3.1. Residential
- 9.3.2. Non-resi
- 9.4. Market Analysis, Insights and Forecast - by Distribution Channel
- 9.4.1. Specialty Store
- 9.4.2. Home Center/Furniture
- 9.4.3. Mass Merchandiser
- 9.4.4. E-commerce
- 9.1. Market Analysis, Insights and Forecast - by Product Type
- 10. Middle East & Africa US Wall Covering and Wall Decor Industry Analysis, Insights and Forecast, 2021-2033
- 10.1. Market Analysis, Insights and Forecast - by Product Type
- 10.1.1. Wall Panel
- 10.1.2. Tiles
- 10.1.3. Metal Wall
- 10.1.4. Wallpaper
- 10.1.4.1. Vinyl
- 10.1.4.2. Non-woven Wallpaper
- 10.1.4.3. Paper-based Wallpaper
- 10.1.4.4. Fabric Wallpapers
- 10.1.4.5. Other Wallpapers
- 10.1.5. Wall Decor
- 10.1.5.1. Wall Art
- 10.1.5.2. Wall Decal
- 10.1.5.3. Wall Frames (Mirrors, etc.)
- 10.1.5.4. Other Wall Decors
- 10.2. Market Analysis, Insights and Forecast - by Type
- 10.2.1. Non-Removable
- 10.3. Market Analysis, Insights and Forecast - by Application
- 10.3.1. Residential
- 10.3.2. Non-resi
- 10.4. Market Analysis, Insights and Forecast - by Distribution Channel
- 10.4.1. Specialty Store
- 10.4.2. Home Center/Furniture
- 10.4.3. Mass Merchandiser
- 10.4.4. E-commerce
- 10.1. Market Analysis, Insights and Forecast - by Product Type
- 11. Asia Pacific US Wall Covering and Wall Decor Industry Analysis, Insights and Forecast, 2021-2033
- 11.1. Market Analysis, Insights and Forecast - by Product Type
- 11.1.1. Wall Panel
- 11.1.2. Tiles
- 11.1.3. Metal Wall
- 11.1.4. Wallpaper
- 11.1.4.1. Vinyl
- 11.1.4.2. Non-woven Wallpaper
- 11.1.4.3. Paper-based Wallpaper
- 11.1.4.4. Fabric Wallpapers
- 11.1.4.5. Other Wallpapers
- 11.1.5. Wall Decor
- 11.1.5.1. Wall Art
- 11.1.5.2. Wall Decal
- 11.1.5.3. Wall Frames (Mirrors, etc.)
- 11.1.5.4. Other Wall Decors
- 11.2. Market Analysis, Insights and Forecast - by Type
- 11.2.1. Non-Removable
- 11.3. Market Analysis, Insights and Forecast - by Application
- 11.3.1. Residential
- 11.3.2. Non-resi
- 11.4. Market Analysis, Insights and Forecast - by Distribution Channel
- 11.4.1. Specialty Store
- 11.4.2. Home Center/Furniture
- 11.4.3. Mass Merchandiser
- 11.4.4. E-commerce
- 11.1. Market Analysis, Insights and Forecast - by Product Type
- 12. Competitive Analysis
- 12.1. Company Profiles
- 12.1.1 Wallquest Inc
- 12.1.1.1. Company Overview
- 12.1.1.2. Products
- 12.1.1.3. Company Financials
- 12.1.1.4. SWOT Analysis
- 12.1.2 J Josephson Inc
- 12.1.2.1. Company Overview
- 12.1.2.2. Products
- 12.1.2.3. Company Financials
- 12.1.2.4. SWOT Analysis
- 12.1.3 Brewster Home Fashion
- 12.1.3.1. Company Overview
- 12.1.3.2. Products
- 12.1.3.3. Company Financials
- 12.1.3.4. SWOT Analysis
- 12.1.4 F Schumacher
- 12.1.4.1. Company Overview
- 12.1.4.2. Products
- 12.1.4.3. Company Financials
- 12.1.4.4. SWOT Analysis
- 12.1.5 Crossville Inc Tile
- 12.1.5.1. Company Overview
- 12.1.5.2. Products
- 12.1.5.3. Company Financials
- 12.1.5.4. SWOT Analysis
- 12.1.6 Sherwin-Williams Company
- 12.1.6.1. Company Overview
- 12.1.6.2. Products
- 12.1.6.3. Company Financials
- 12.1.6.4. SWOT Analysis
- 12.1.7 York Wall Coverings
- 12.1.7.1. Company Overview
- 12.1.7.2. Products
- 12.1.7.3. Company Financials
- 12.1.7.4. SWOT Analysis
- 12.1.8 Benjamin Moore & Co
- 12.1.8.1. Company Overview
- 12.1.8.2. Products
- 12.1.8.3. Company Financials
- 12.1.8.4. SWOT Analysis
- 12.1.9 Len-Tex Corporation*List Not Exhaustive
- 12.1.9.1. Company Overview
- 12.1.9.2. Products
- 12.1.9.3. Company Financials
- 12.1.9.4. SWOT Analysis
- 12.1.10 Koroseal Wall Protection'
- 12.1.10.1. Company Overview
- 12.1.10.2. Products
- 12.1.10.3. Company Financials
- 12.1.10.4. SWOT Analysis
- 12.1.1 Wallquest Inc
- 12.2. Market Entropy
- 12.2.1 Company's Key Areas Served
- 12.2.2 Recent Developments
- 12.3. Company Market Share Analysis 2025
- 12.3.1 Top 5 Companies Market Share Analysis
- 12.3.2 Top 3 Companies Market Share Analysis
- 12.4. List of Potential Customers
- 13. Research Methodology
List of Figures
- Figure 1: Global US Wall Covering and Wall Decor Industry Revenue Breakdown (billion, %) by Region 2025 & 2033
- Figure 2: North America US Wall Covering and Wall Decor Industry Revenue (billion), by Product Type 2025 & 2033
- Figure 3: North America US Wall Covering and Wall Decor Industry Revenue Share (%), by Product Type 2025 & 2033
- Figure 4: North America US Wall Covering and Wall Decor Industry Revenue (billion), by Type 2025 & 2033
- Figure 5: North America US Wall Covering and Wall Decor Industry Revenue Share (%), by Type 2025 & 2033
- Figure 6: North America US Wall Covering and Wall Decor Industry Revenue (billion), by Application 2025 & 2033
- Figure 7: North America US Wall Covering and Wall Decor Industry Revenue Share (%), by Application 2025 & 2033
- Figure 8: North America US Wall Covering and Wall Decor Industry Revenue (billion), by Distribution Channel 2025 & 2033
- Figure 9: North America US Wall Covering and Wall Decor Industry Revenue Share (%), by Distribution Channel 2025 & 2033
- Figure 10: North America US Wall Covering and Wall Decor Industry Revenue (billion), by Country 2025 & 2033
- Figure 11: North America US Wall Covering and Wall Decor Industry Revenue Share (%), by Country 2025 & 2033
- Figure 12: South America US Wall Covering and Wall Decor Industry Revenue (billion), by Product Type 2025 & 2033
- Figure 13: South America US Wall Covering and Wall Decor Industry Revenue Share (%), by Product Type 2025 & 2033
- Figure 14: South America US Wall Covering and Wall Decor Industry Revenue (billion), by Type 2025 & 2033
- Figure 15: South America US Wall Covering and Wall Decor Industry Revenue Share (%), by Type 2025 & 2033
- Figure 16: South America US Wall Covering and Wall Decor Industry Revenue (billion), by Application 2025 & 2033
- Figure 17: South America US Wall Covering and Wall Decor Industry Revenue Share (%), by Application 2025 & 2033
- Figure 18: South America US Wall Covering and Wall Decor Industry Revenue (billion), by Distribution Channel 2025 & 2033
- Figure 19: South America US Wall Covering and Wall Decor Industry Revenue Share (%), by Distribution Channel 2025 & 2033
- Figure 20: South America US Wall Covering and Wall Decor Industry Revenue (billion), by Country 2025 & 2033
- Figure 21: South America US Wall Covering and Wall Decor Industry Revenue Share (%), by Country 2025 & 2033
- Figure 22: Europe US Wall Covering and Wall Decor Industry Revenue (billion), by Product Type 2025 & 2033
- Figure 23: Europe US Wall Covering and Wall Decor Industry Revenue Share (%), by Product Type 2025 & 2033
- Figure 24: Europe US Wall Covering and Wall Decor Industry Revenue (billion), by Type 2025 & 2033
- Figure 25: Europe US Wall Covering and Wall Decor Industry Revenue Share (%), by Type 2025 & 2033
- Figure 26: Europe US Wall Covering and Wall Decor Industry Revenue (billion), by Application 2025 & 2033
- Figure 27: Europe US Wall Covering and Wall Decor Industry Revenue Share (%), by Application 2025 & 2033
- Figure 28: Europe US Wall Covering and Wall Decor Industry Revenue (billion), by Distribution Channel 2025 & 2033
- Figure 29: Europe US Wall Covering and Wall Decor Industry Revenue Share (%), by Distribution Channel 2025 & 2033
- Figure 30: Europe US Wall Covering and Wall Decor Industry Revenue (billion), by Country 2025 & 2033
- Figure 31: Europe US Wall Covering and Wall Decor Industry Revenue Share (%), by Country 2025 & 2033
- Figure 32: Middle East & Africa US Wall Covering and Wall Decor Industry Revenue (billion), by Product Type 2025 & 2033
- Figure 33: Middle East & Africa US Wall Covering and Wall Decor Industry Revenue Share (%), by Product Type 2025 & 2033
- Figure 34: Middle East & Africa US Wall Covering and Wall Decor Industry Revenue (billion), by Type 2025 & 2033
- Figure 35: Middle East & Africa US Wall Covering and Wall Decor Industry Revenue Share (%), by Type 2025 & 2033
- Figure 36: Middle East & Africa US Wall Covering and Wall Decor Industry Revenue (billion), by Application 2025 & 2033
- Figure 37: Middle East & Africa US Wall Covering and Wall Decor Industry Revenue Share (%), by Application 2025 & 2033
- Figure 38: Middle East & Africa US Wall Covering and Wall Decor Industry Revenue (billion), by Distribution Channel 2025 & 2033
- Figure 39: Middle East & Africa US Wall Covering and Wall Decor Industry Revenue Share (%), by Distribution Channel 2025 & 2033
- Figure 40: Middle East & Africa US Wall Covering and Wall Decor Industry Revenue (billion), by Country 2025 & 2033
- Figure 41: Middle East & Africa US Wall Covering and Wall Decor Industry Revenue Share (%), by Country 2025 & 2033
- Figure 42: Asia Pacific US Wall Covering and Wall Decor Industry Revenue (billion), by Product Type 2025 & 2033
- Figure 43: Asia Pacific US Wall Covering and Wall Decor Industry Revenue Share (%), by Product Type 2025 & 2033
- Figure 44: Asia Pacific US Wall Covering and Wall Decor Industry Revenue (billion), by Type 2025 & 2033
- Figure 45: Asia Pacific US Wall Covering and Wall Decor Industry Revenue Share (%), by Type 2025 & 2033
- Figure 46: Asia Pacific US Wall Covering and Wall Decor Industry Revenue (billion), by Application 2025 & 2033
- Figure 47: Asia Pacific US Wall Covering and Wall Decor Industry Revenue Share (%), by Application 2025 & 2033
- Figure 48: Asia Pacific US Wall Covering and Wall Decor Industry Revenue (billion), by Distribution Channel 2025 & 2033
- Figure 49: Asia Pacific US Wall Covering and Wall Decor Industry Revenue Share (%), by Distribution Channel 2025 & 2033
- Figure 50: Asia Pacific US Wall Covering and Wall Decor Industry Revenue (billion), by Country 2025 & 2033
- Figure 51: Asia Pacific US Wall Covering and Wall Decor Industry Revenue Share (%), by Country 2025 & 2033
List of Tables
- Table 1: Global US Wall Covering and Wall Decor Industry Revenue billion Forecast, by Product Type 2020 & 2033
- Table 2: Global US Wall Covering and Wall Decor Industry Revenue billion Forecast, by Type 2020 & 2033
- Table 3: Global US Wall Covering and Wall Decor Industry Revenue billion Forecast, by Application 2020 & 2033
- Table 4: Global US Wall Covering and Wall Decor Industry Revenue billion Forecast, by Distribution Channel 2020 & 2033
- Table 5: Global US Wall Covering and Wall Decor Industry Revenue billion Forecast, by Region 2020 & 2033
- Table 6: Global US Wall Covering and Wall Decor Industry Revenue billion Forecast, by Product Type 2020 & 2033
- Table 7: Global US Wall Covering and Wall Decor Industry Revenue billion Forecast, by Type 2020 & 2033
- Table 8: Global US Wall Covering and Wall Decor Industry Revenue billion Forecast, by Application 2020 & 2033
- Table 9: Global US Wall Covering and Wall Decor Industry Revenue billion Forecast, by Distribution Channel 2020 & 2033
- Table 10: Global US Wall Covering and Wall Decor Industry Revenue billion Forecast, by Country 2020 & 2033
- Table 11: United States US Wall Covering and Wall Decor Industry Revenue (billion) Forecast, by Application 2020 & 2033
- Table 12: Canada US Wall Covering and Wall Decor Industry Revenue (billion) Forecast, by Application 2020 & 2033
- Table 13: Mexico US Wall Covering and Wall Decor Industry Revenue (billion) Forecast, by Application 2020 & 2033
- Table 14: Global US Wall Covering and Wall Decor Industry Revenue billion Forecast, by Product Type 2020 & 2033
- Table 15: Global US Wall Covering and Wall Decor Industry Revenue billion Forecast, by Type 2020 & 2033
- Table 16: Global US Wall Covering and Wall Decor Industry Revenue billion Forecast, by Application 2020 & 2033
- Table 17: Global US Wall Covering and Wall Decor Industry Revenue billion Forecast, by Distribution Channel 2020 & 2033
- Table 18: Global US Wall Covering and Wall Decor Industry Revenue billion Forecast, by Country 2020 & 2033
- Table 19: Brazil US Wall Covering and Wall Decor Industry Revenue (billion) Forecast, by Application 2020 & 2033
- Table 20: Argentina US Wall Covering and Wall Decor Industry Revenue (billion) Forecast, by Application 2020 & 2033
- Table 21: Rest of South America US Wall Covering and Wall Decor Industry Revenue (billion) Forecast, by Application 2020 & 2033
- Table 22: Global US Wall Covering and Wall Decor Industry Revenue billion Forecast, by Product Type 2020 & 2033
- Table 23: Global US Wall Covering and Wall Decor Industry Revenue billion Forecast, by Type 2020 & 2033
- Table 24: Global US Wall Covering and Wall Decor Industry Revenue billion Forecast, by Application 2020 & 2033
- Table 25: Global US Wall Covering and Wall Decor Industry Revenue billion Forecast, by Distribution Channel 2020 & 2033
- Table 26: Global US Wall Covering and Wall Decor Industry Revenue billion Forecast, by Country 2020 & 2033
- Table 27: United Kingdom US Wall Covering and Wall Decor Industry Revenue (billion) Forecast, by Application 2020 & 2033
- Table 28: Germany US Wall Covering and Wall Decor Industry Revenue (billion) Forecast, by Application 2020 & 2033
- Table 29: France US Wall Covering and Wall Decor Industry Revenue (billion) Forecast, by Application 2020 & 2033
- Table 30: Italy US Wall Covering and Wall Decor Industry Revenue (billion) Forecast, by Application 2020 & 2033
- Table 31: Spain US Wall Covering and Wall Decor Industry Revenue (billion) Forecast, by Application 2020 & 2033
- Table 32: Russia US Wall Covering and Wall Decor Industry Revenue (billion) Forecast, by Application 2020 & 2033
- Table 33: Benelux US Wall Covering and Wall Decor Industry Revenue (billion) Forecast, by Application 2020 & 2033
- Table 34: Nordics US Wall Covering and Wall Decor Industry Revenue (billion) Forecast, by Application 2020 & 2033
- Table 35: Rest of Europe US Wall Covering and Wall Decor Industry Revenue (billion) Forecast, by Application 2020 & 2033
- Table 36: Global US Wall Covering and Wall Decor Industry Revenue billion Forecast, by Product Type 2020 & 2033
- Table 37: Global US Wall Covering and Wall Decor Industry Revenue billion Forecast, by Type 2020 & 2033
- Table 38: Global US Wall Covering and Wall Decor Industry Revenue billion Forecast, by Application 2020 & 2033
- Table 39: Global US Wall Covering and Wall Decor Industry Revenue billion Forecast, by Distribution Channel 2020 & 2033
- Table 40: Global US Wall Covering and Wall Decor Industry Revenue billion Forecast, by Country 2020 & 2033
- Table 41: Turkey US Wall Covering and Wall Decor Industry Revenue (billion) Forecast, by Application 2020 & 2033
- Table 42: Israel US Wall Covering and Wall Decor Industry Revenue (billion) Forecast, by Application 2020 & 2033
- Table 43: GCC US Wall Covering and Wall Decor Industry Revenue (billion) Forecast, by Application 2020 & 2033
- Table 44: North Africa US Wall Covering and Wall Decor Industry Revenue (billion) Forecast, by Application 2020 & 2033
- Table 45: South Africa US Wall Covering and Wall Decor Industry Revenue (billion) Forecast, by Application 2020 & 2033
- Table 46: Rest of Middle East & Africa US Wall Covering and Wall Decor Industry Revenue (billion) Forecast, by Application 2020 & 2033
- Table 47: Global US Wall Covering and Wall Decor Industry Revenue billion Forecast, by Product Type 2020 & 2033
- Table 48: Global US Wall Covering and Wall Decor Industry Revenue billion Forecast, by Type 2020 & 2033
- Table 49: Global US Wall Covering and Wall Decor Industry Revenue billion Forecast, by Application 2020 & 2033
- Table 50: Global US Wall Covering and Wall Decor Industry Revenue billion Forecast, by Distribution Channel 2020 & 2033
- Table 51: Global US Wall Covering and Wall Decor Industry Revenue billion Forecast, by Country 2020 & 2033
- Table 52: China US Wall Covering and Wall Decor Industry Revenue (billion) Forecast, by Application 2020 & 2033
- Table 53: India US Wall Covering and Wall Decor Industry Revenue (billion) Forecast, by Application 2020 & 2033
- Table 54: Japan US Wall Covering and Wall Decor Industry Revenue (billion) Forecast, by Application 2020 & 2033
- Table 55: South Korea US Wall Covering and Wall Decor Industry Revenue (billion) Forecast, by Application 2020 & 2033
- Table 56: ASEAN US Wall Covering and Wall Decor Industry Revenue (billion) Forecast, by Application 2020 & 2033
- Table 57: Oceania US Wall Covering and Wall Decor Industry Revenue (billion) Forecast, by Application 2020 & 2033
- Table 58: Rest of Asia Pacific US Wall Covering and Wall Decor Industry Revenue (billion) Forecast, by Application 2020 & 2033
Frequently Asked Questions
1. What is the projected Compound Annual Growth Rate (CAGR) of the US Wall Covering and Wall Decor Industry?
The projected CAGR is approximately 8.55%.
2. Which companies are prominent players in the US Wall Covering and Wall Decor Industry?
Key companies in the market include Wallquest Inc, J Josephson Inc, Brewster Home Fashion, F Schumacher, Crossville Inc Tile, Sherwin-Williams Company, York Wall Coverings, Benjamin Moore & Co, Len-Tex Corporation*List Not Exhaustive, Koroseal Wall Protection'.
3. What are the main segments of the US Wall Covering and Wall Decor Industry?
The market segments include Product Type, Type, Application, Distribution Channel.
4. Can you provide details about the market size?
The market size is estimated to be USD 66.89 billion as of 2022.
5. What are some drivers contributing to market growth?
Rebounding Residential Construction Activity; Growing Demand for Digitally Printed Solutions and Online Procurement of Wall Arts.
6. What are the notable trends driving market growth?
Increasing Construction Activity to Drive the Market Growth.
7. Are there any restraints impacting market growth?
Strong Competition from the Paints Segment; Recent Changes in Macro-environment Expected to Impact Customer Spending.
8. Can you provide examples of recent developments in the market?
November 2022: Floor & Décor plans to expand its nationwide footprint by opening its newest location in Coral Springs, Florida. This opening marks the 10th warehouse store in the South Florida market.
9. What pricing options are available for accessing the report?
Pricing options include single-user, multi-user, and enterprise licenses priced at USD 3800, USD 4500, and USD 5800 respectively.
10. Is the market size provided in terms of value or volume?
The market size is provided in terms of value, measured in billion.
11. Are there any specific market keywords associated with the report?
Yes, the market keyword associated with the report is "US Wall Covering and Wall Decor Industry," which aids in identifying and referencing the specific market segment covered.
12. How do I determine which pricing option suits my needs best?
The pricing options vary based on user requirements and access needs. Individual users may opt for single-user licenses, while businesses requiring broader access may choose multi-user or enterprise licenses for cost-effective access to the report.
13. Are there any additional resources or data provided in the US Wall Covering and Wall Decor Industry report?
While the report offers comprehensive insights, it's advisable to review the specific contents or supplementary materials provided to ascertain if additional resources or data are available.
14. How can I stay updated on further developments or reports in the US Wall Covering and Wall Decor Industry?
To stay informed about further developments, trends, and reports in the US Wall Covering and Wall Decor Industry, consider subscribing to industry newsletters, following relevant companies and organizations, or regularly checking reputable industry news sources and publications.
Methodology
Step 1 - Identification of Relevant Samples Size from Population Database


Step 2 - Approaches for Defining Global Market Size (Value, Volume* & Price*)

Note*: In applicable scenarios
Step 3 - Data Sources
Primary Research
- Web Analytics
- Survey Reports
- Research Institute
- Latest Research Reports
- Opinion Leaders
Secondary Research
- Annual Reports
- White Paper
- Latest Press Release
- Industry Association
- Paid Database
- Investor Presentations

Step 4 - Data Triangulation
Involves using different sources of information in order to increase the validity of a study
These sources are likely to be stakeholders in a program - participants, other researchers, program staff, other community members, and so on.
Then we put all data in single framework & apply various statistical tools to find out the dynamic on the market.
During the analysis stage, feedback from the stakeholder groups would be compared to determine areas of agreement as well as areas of divergence