
Key Insights
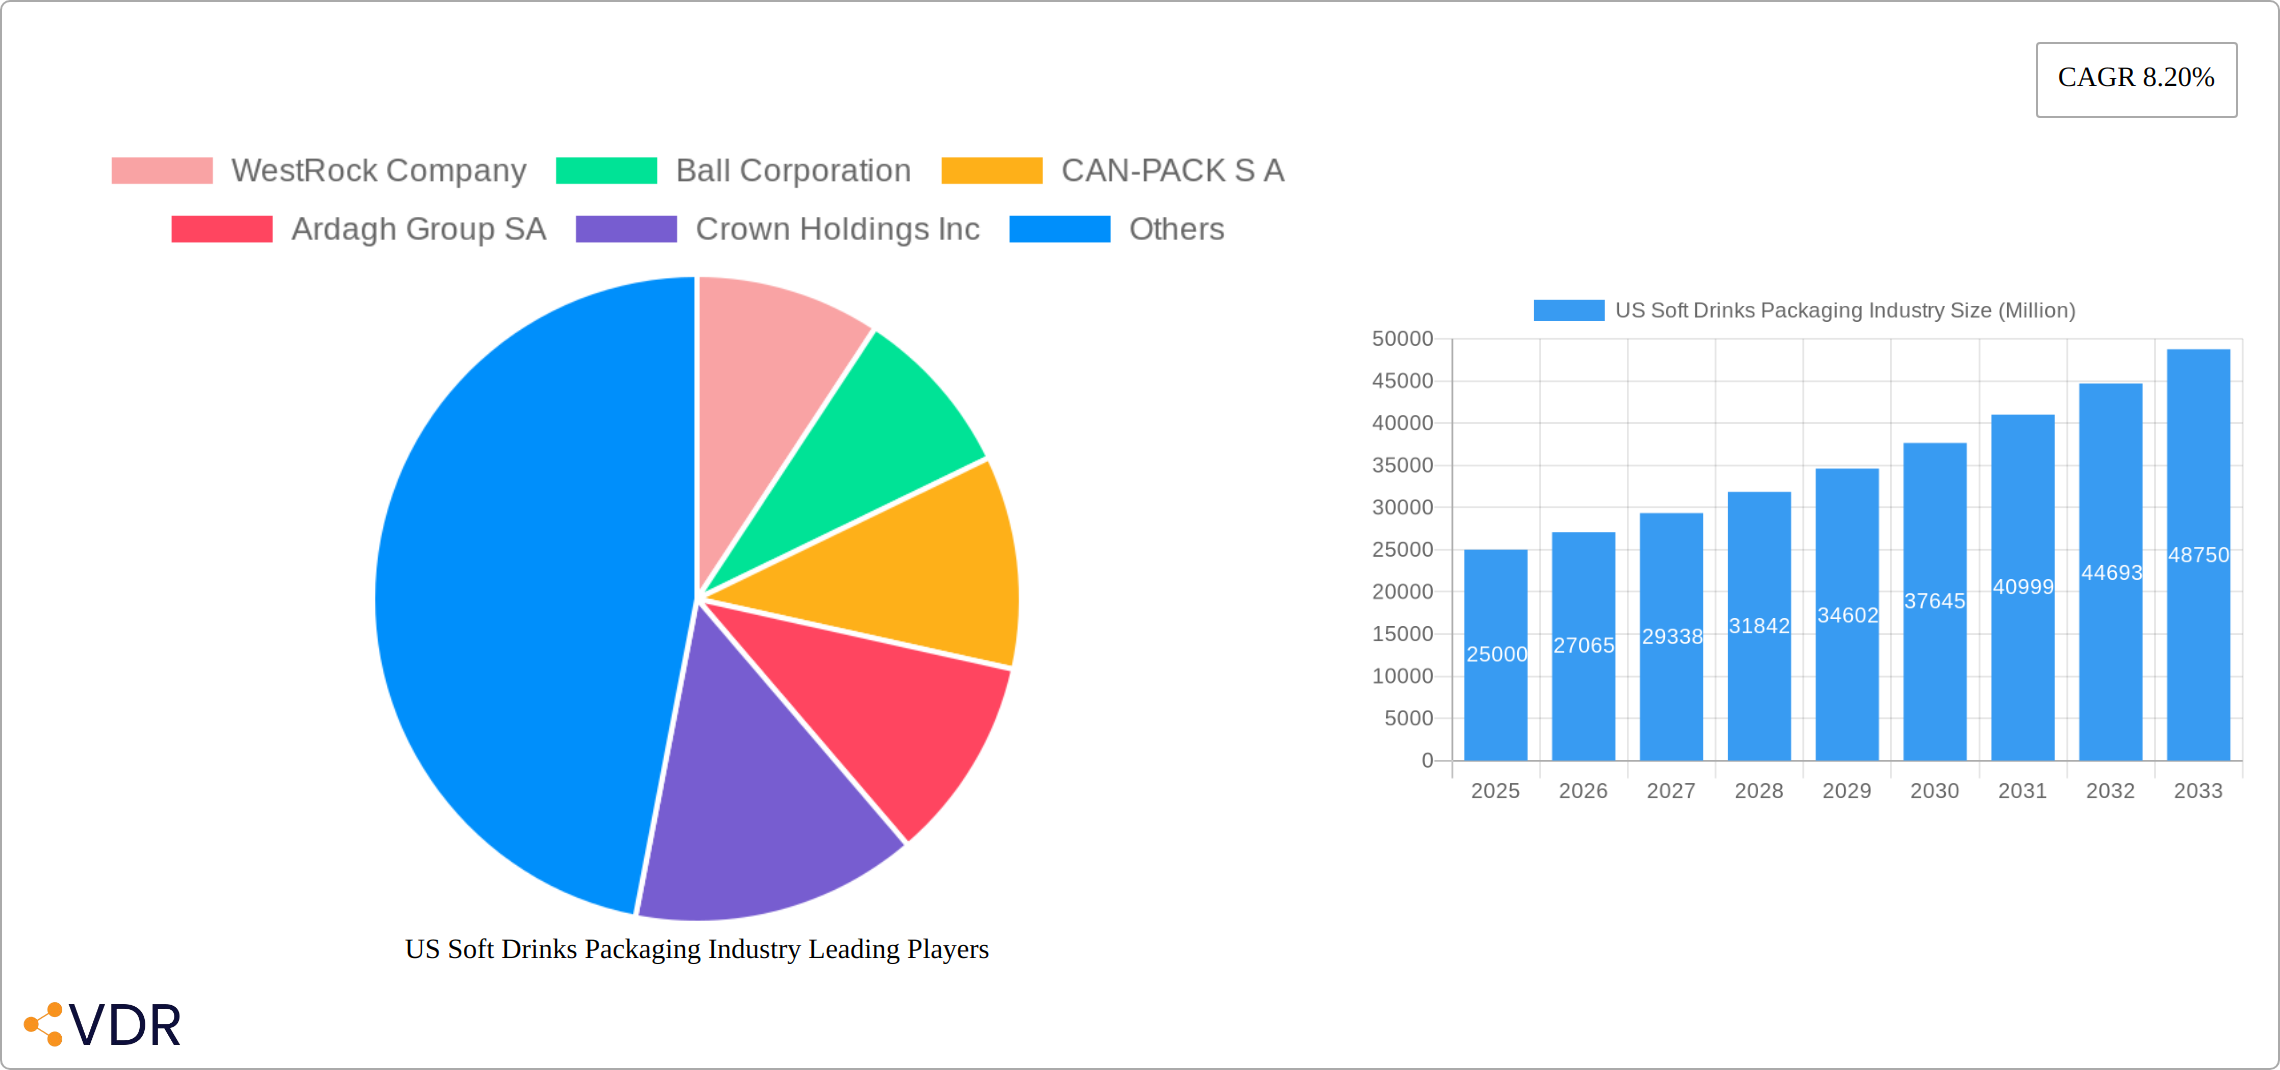
The US soft drinks packaging market, valued at approximately $25 billion in 2025, is projected to experience robust growth, exhibiting a compound annual growth rate (CAGR) of 8.20% from 2025 to 2033. This expansion is fueled by several key drivers. The increasing demand for convenient and on-the-go beverage options, particularly among younger demographics, is a significant factor. Furthermore, the ongoing trend toward premiumization, with consumers increasingly opting for higher-quality, more aesthetically pleasing packaging, is boosting demand for innovative and sustainable packaging solutions. Growth is also being propelled by the expanding popularity of ready-to-drink (RTD) beverages and functional drinks, driving the need for diverse and efficient packaging formats. However, the market faces challenges such as fluctuating raw material prices, particularly for plastics and aluminum, and increasing concerns surrounding environmental sustainability, leading to a growing preference for eco-friendly alternatives like recycled paperboard and biodegradable plastics. The segmentation within the market reflects these dynamics; plastic remains a dominant packaging material due to its cost-effectiveness, but significant growth is anticipated in segments like paper and paperboard due to increasing environmental consciousness. Competition among major players, including WestRock Company, Ball Corporation, and Amcor Ltd, is intense, with companies focusing on innovation, sustainability initiatives, and strategic partnerships to maintain a competitive edge. The regional distribution shows strong growth across all regions of the US, with the Southeast and West potentially outpacing other regions due to population growth and consumer behavior.
The forecast period (2025-2033) will likely witness significant shifts in market share among different packaging materials. While plastic currently holds a substantial share, the growing environmental awareness is driving adoption of more sustainable alternatives like paperboard and glass, particularly for bottled water and juices. The increasing demand for lightweight and tamper-evident packaging will further shape the market. Companies are focusing on developing innovative packaging solutions that address consumer preferences for convenience, sustainability, and aesthetics. Successful strategies will likely involve investing in research and development of eco-friendly materials, optimizing supply chains to minimize environmental impact, and enhancing branding through attractive and functional packaging designs. The increasing prevalence of e-commerce and direct-to-consumer models will also necessitate packaging solutions that are suitable for online delivery and enhance the consumer unboxing experience.
US Soft Drinks Packaging Industry: Market Report 2019-2033
This comprehensive report provides a detailed analysis of the US soft drinks packaging industry, encompassing market dynamics, growth trends, competitive landscape, and future outlook. The report covers the period from 2019 to 2033, with a focus on the base year 2025 and forecast period 2025-2033. This in-depth analysis serves as an invaluable resource for industry professionals, investors, and strategic decision-makers seeking to understand and capitalize on the opportunities within this dynamic market. The parent market is the broader US packaging industry, while the child market is specifically the soft drinks segment within that. All values are presented in million units.
Keywords: US Soft Drinks Packaging, Packaging Materials, Soft Drink Packaging Market, Bottled Water Packaging, Carbonated Drink Packaging, Packaging Industry, Market Analysis, Market Forecast, Market Trends, WestRock, Ball Corporation, Amcor, Crown Holdings, Packaging Innovation, Sustainability in Packaging, Plastic Packaging, Paperboard Packaging, Glass Packaging, Metal Packaging.
US Soft Drinks Packaging Industry Market Dynamics & Structure
The US soft drinks packaging industry is characterized by a moderately concentrated market structure, with a few major players holding significant market share. Market concentration is approximately xx%, with the top five players accounting for xx%. Technological innovation is a key driver, focusing on lightweighting, sustainability (recycled content and recyclability), and improved barrier properties. Stringent regulatory frameworks, particularly concerning material composition and recyclability, significantly influence packaging choices. The industry faces competition from alternative packaging solutions and evolving consumer preferences. Mergers and acquisitions (M&A) activity has been moderate in recent years, with xx deals recorded between 2019 and 2024, primarily driven by consolidation and expansion strategies. End-user demographics, particularly the growing health-conscious consumer base, are increasingly influencing packaging material selection.
- Market Concentration: xx% (Top 5 players account for xx%)
- M&A Activity (2019-2024): xx deals
- Key Innovation Drivers: Lightweighting, Sustainability, Barrier Properties
- Regulatory Influences: Material composition, recyclability standards.
- Competitive Substitutes: Alternative packaging materials, dispensing systems.
US Soft Drinks Packaging Industry Growth Trends & Insights
The US soft drinks packaging market experienced a Compound Annual Growth Rate (CAGR) of xx% during the historical period (2019-2024). Market size is projected to reach xx million units by 2025 and continue its expansion at a CAGR of xx% throughout the forecast period (2025-2033), reaching an estimated xx million units by 2033. Growth is driven by factors including increasing soft drink consumption, particularly in bottled water and RTD beverages, along with evolving consumer preferences for convenient and sustainable packaging. Technological advancements in material science and manufacturing processes are further fueling growth. Shifts in consumer behavior toward healthier options and eco-conscious choices are impacting packaging material selection, favoring sustainable solutions like recycled plastic and paperboard. Adoption rates for innovative packaging technologies, such as lightweighting and improved barrier properties, continue to increase. The market penetration of sustainable packaging options is expected to rise significantly by 2033, reaching xx%.

Dominant Regions, Countries, or Segments in US Soft Drinks Packaging Industry
The Western and Southern regions of the US are the leading markets for soft drinks packaging, fueled by higher population density and strong demand. Within packaging materials, plastic remains the dominant segment, holding xx% of the market share in 2025. However, significant growth is expected in paper and paperboard packaging, driven by its sustainability profile. Among product types, bottled water displays the highest growth, followed by ready-to-drink (RTD) beverages.
- Leading Regions: West and South
- Dominant Packaging Material (2025): Plastic (xx%)
- Fastest Growing Product Type: Bottled Water
- Key Drivers: Growing population, higher disposable income, rising demand for convenience, increasing preference for sustainable materials.
US Soft Drinks Packaging Industry Product Landscape
The US soft drinks packaging landscape is characterized by a wide array of products designed to meet diverse consumer needs and brand preferences. Innovations focus on lightweighting to reduce transportation costs and environmental impact, improving barrier properties to enhance product shelf life, and incorporating sustainable materials like recycled content and bioplastics. Product differentiation is achieved through unique shapes, sizes, closures, and labeling solutions. Advanced technologies, such as high-speed manufacturing equipment and advanced printing techniques, allow for customization and cost efficiency. The focus on recyclability and reduced environmental footprint is a key trend driving product development.
Key Drivers, Barriers & Challenges in US Soft Drinks Packaging Industry
Key Drivers:
- Growing demand for convenience and portability.
- Increasing preference for sustainable and eco-friendly packaging.
- Technological advancements in packaging materials and manufacturing processes.
- Rising disposable incomes and increased consumption of soft drinks.
Challenges & Restraints:
- Fluctuations in raw material prices (e.g., oil, resin).
- Stringent regulatory compliance requirements (e.g., recyclability standards).
- Intense competition and pricing pressures from packaging suppliers.
- Supply chain disruptions due to geopolitical instability and logistics challenges. The impact of such disruptions has led to a xx% increase in packaging costs since 2020.
Emerging Opportunities in US Soft Drinks Packaging Industry
- Growing demand for sustainable and eco-friendly packaging solutions presents significant opportunities for companies offering recycled content and bio-based materials.
- Increased adoption of lightweighting technologies continues to provide cost savings and environmental benefits.
- Development of innovative closure systems and dispensing solutions offers scope for product differentiation and enhanced convenience.
- Expansion into emerging markets and untapped segments (e.g., functional beverages) holds significant growth potential.
Growth Accelerators in the US Soft Drinks Packaging Industry
Long-term growth in the US soft drinks packaging industry is driven by technological breakthroughs in material science, leading to lighter weight and improved barrier properties. Strategic partnerships between packaging suppliers and soft drink manufacturers foster innovation and accelerate the adoption of sustainable packaging. Expansion into new markets, such as e-commerce and home delivery, presents further growth opportunities. Government incentives and regulations promoting sustainable packaging solutions are catalysts for innovation and market expansion.
Key Players Shaping the US Soft Drinks Packaging Industry Market
- WestRock Company
- Ball Corporation
- CAN-PACK S A
- Ardagh Group SA
- Crown Holdings Inc
- Graham Packaging Company
- Tetra Pak International
- Toyo Seikan Group Holdings Ltd
- Placon Corporation
- Sealed Air Corporation
- Owens-Illinois Inc
- Refresco Group NV
- Amcor Ltd
Notable Milestones in US Soft Drinks Packaging Industry Sector
- June 2021: Amcor launched the AmPrima line of ultra-clear, heat-resistant films, using machine-direction orientation technology for high-speed production and recyclability. This significantly enhanced the availability of sustainable packaging options for the soft drinks sector.
In-Depth US Soft Drinks Packaging Industry Market Outlook
The US soft drinks packaging market is poised for continued growth, driven by the increasing demand for convenient and sustainable packaging solutions. Opportunities abound for companies that can leverage technological innovation, strategic partnerships, and sustainable practices. The focus on lightweighting, recyclability, and improved barrier properties will continue to shape product development and market dynamics. The market's long-term outlook is positive, with significant potential for expansion in both established and emerging segments. Companies with a focus on sustainability and innovation are best positioned to capitalize on the growth opportunities within this dynamic market.
US Soft Drinks Packaging Industry Segmentation
-
1. Packaging Material Type
- 1.1. Plastic
- 1.2. Paper & Paperboard
- 1.3. Glass
- 1.4. Metal
- 1.5. Other Materials
-
2. Product Type
- 2.1. Bottled Water
- 2.2. Carbonated Drinks
- 2.3. Juices
- 2.4. RTD Beverages
- 2.5. Sports Drink
- 2.6. Other Products
US Soft Drinks Packaging Industry Segmentation By Geography
-
1. North America
- 1.1. United States
- 1.2. Canada
- 1.3. Mexico
-
2. South America
- 2.1. Brazil
- 2.2. Argentina
- 2.3. Rest of South America
-
3. Europe
- 3.1. United Kingdom
- 3.2. Germany
- 3.3. France
- 3.4. Italy
- 3.5. Spain
- 3.6. Russia
- 3.7. Benelux
- 3.8. Nordics
- 3.9. Rest of Europe
-
4. Middle East & Africa
- 4.1. Turkey
- 4.2. Israel
- 4.3. GCC
- 4.4. North Africa
- 4.5. South Africa
- 4.6. Rest of Middle East & Africa
-
5. Asia Pacific
- 5.1. China
- 5.2. India
- 5.3. Japan
- 5.4. South Korea
- 5.5. ASEAN
- 5.6. Oceania
- 5.7. Rest of Asia Pacific

US Soft Drinks Packaging Industry REPORT HIGHLIGHTS
| Aspects | Details |
|---|---|
| Study Period | 2019-2033 |
| Base Year | 2024 |
| Estimated Year | 2025 |
| Forecast Period | 2025-2033 |
| Historical Period | 2019-2024 |
| Growth Rate | CAGR of 8.20% from 2019-2033 |
| Segmentation |
|
Table of Contents
- 1. Introduction
- 1.1. Research Scope
- 1.2. Market Segmentation
- 1.3. Research Methodology
- 1.4. Definitions and Assumptions
- 2. Executive Summary
- 2.1. Introduction
- 3. Market Dynamics
- 3.1. Introduction
- 3.2. Market Drivers
- 3.2.1. Growing Demand for Ready-to-use Drinks; Increased demand for convenience packaging from consumers
- 3.3. Market Restrains
- 3.3.1. Environmental concerns regarding usage of plastic; Stringent Government Regulations
- 3.4. Market Trends
- 3.4.1. Plastic is Expected to Hold Significant Market Share
- 4. Market Factor Analysis
- 4.1. Porters Five Forces
- 4.2. Supply/Value Chain
- 4.3. PESTEL analysis
- 4.4. Market Entropy
- 4.5. Patent/Trademark Analysis
- 5. Global US Soft Drinks Packaging Industry Analysis, Insights and Forecast, 2019-2031
- 5.1. Market Analysis, Insights and Forecast - by Packaging Material Type
- 5.1.1. Plastic
- 5.1.2. Paper & Paperboard
- 5.1.3. Glass
- 5.1.4. Metal
- 5.1.5. Other Materials
- 5.2. Market Analysis, Insights and Forecast - by Product Type
- 5.2.1. Bottled Water
- 5.2.2. Carbonated Drinks
- 5.2.3. Juices
- 5.2.4. RTD Beverages
- 5.2.5. Sports Drink
- 5.2.6. Other Products
- 5.3. Market Analysis, Insights and Forecast - by Region
- 5.3.1. North America
- 5.3.2. South America
- 5.3.3. Europe
- 5.3.4. Middle East & Africa
- 5.3.5. Asia Pacific
- 5.1. Market Analysis, Insights and Forecast - by Packaging Material Type
- 6. North America US Soft Drinks Packaging Industry Analysis, Insights and Forecast, 2019-2031
- 6.1. Market Analysis, Insights and Forecast - by Packaging Material Type
- 6.1.1. Plastic
- 6.1.2. Paper & Paperboard
- 6.1.3. Glass
- 6.1.4. Metal
- 6.1.5. Other Materials
- 6.2. Market Analysis, Insights and Forecast - by Product Type
- 6.2.1. Bottled Water
- 6.2.2. Carbonated Drinks
- 6.2.3. Juices
- 6.2.4. RTD Beverages
- 6.2.5. Sports Drink
- 6.2.6. Other Products
- 6.1. Market Analysis, Insights and Forecast - by Packaging Material Type
- 7. South America US Soft Drinks Packaging Industry Analysis, Insights and Forecast, 2019-2031
- 7.1. Market Analysis, Insights and Forecast - by Packaging Material Type
- 7.1.1. Plastic
- 7.1.2. Paper & Paperboard
- 7.1.3. Glass
- 7.1.4. Metal
- 7.1.5. Other Materials
- 7.2. Market Analysis, Insights and Forecast - by Product Type
- 7.2.1. Bottled Water
- 7.2.2. Carbonated Drinks
- 7.2.3. Juices
- 7.2.4. RTD Beverages
- 7.2.5. Sports Drink
- 7.2.6. Other Products
- 7.1. Market Analysis, Insights and Forecast - by Packaging Material Type
- 8. Europe US Soft Drinks Packaging Industry Analysis, Insights and Forecast, 2019-2031
- 8.1. Market Analysis, Insights and Forecast - by Packaging Material Type
- 8.1.1. Plastic
- 8.1.2. Paper & Paperboard
- 8.1.3. Glass
- 8.1.4. Metal
- 8.1.5. Other Materials
- 8.2. Market Analysis, Insights and Forecast - by Product Type
- 8.2.1. Bottled Water
- 8.2.2. Carbonated Drinks
- 8.2.3. Juices
- 8.2.4. RTD Beverages
- 8.2.5. Sports Drink
- 8.2.6. Other Products
- 8.1. Market Analysis, Insights and Forecast - by Packaging Material Type
- 9. Middle East & Africa US Soft Drinks Packaging Industry Analysis, Insights and Forecast, 2019-2031
- 9.1. Market Analysis, Insights and Forecast - by Packaging Material Type
- 9.1.1. Plastic
- 9.1.2. Paper & Paperboard
- 9.1.3. Glass
- 9.1.4. Metal
- 9.1.5. Other Materials
- 9.2. Market Analysis, Insights and Forecast - by Product Type
- 9.2.1. Bottled Water
- 9.2.2. Carbonated Drinks
- 9.2.3. Juices
- 9.2.4. RTD Beverages
- 9.2.5. Sports Drink
- 9.2.6. Other Products
- 9.1. Market Analysis, Insights and Forecast - by Packaging Material Type
- 10. Asia Pacific US Soft Drinks Packaging Industry Analysis, Insights and Forecast, 2019-2031
- 10.1. Market Analysis, Insights and Forecast - by Packaging Material Type
- 10.1.1. Plastic
- 10.1.2. Paper & Paperboard
- 10.1.3. Glass
- 10.1.4. Metal
- 10.1.5. Other Materials
- 10.2. Market Analysis, Insights and Forecast - by Product Type
- 10.2.1. Bottled Water
- 10.2.2. Carbonated Drinks
- 10.2.3. Juices
- 10.2.4. RTD Beverages
- 10.2.5. Sports Drink
- 10.2.6. Other Products
- 10.1. Market Analysis, Insights and Forecast - by Packaging Material Type
- 11. Northeast US Soft Drinks Packaging Industry Analysis, Insights and Forecast, 2019-2031
- 12. Southeast US Soft Drinks Packaging Industry Analysis, Insights and Forecast, 2019-2031
- 13. Midwest US Soft Drinks Packaging Industry Analysis, Insights and Forecast, 2019-2031
- 14. Southwest US Soft Drinks Packaging Industry Analysis, Insights and Forecast, 2019-2031
- 15. West US Soft Drinks Packaging Industry Analysis, Insights and Forecast, 2019-2031
- 16. Competitive Analysis
- 16.1. Global Market Share Analysis 2024
- 16.2. Company Profiles
- 16.2.1 WestRock Company
- 16.2.1.1. Overview
- 16.2.1.2. Products
- 16.2.1.3. SWOT Analysis
- 16.2.1.4. Recent Developments
- 16.2.1.5. Financials (Based on Availability)
- 16.2.2 Ball Corporation
- 16.2.2.1. Overview
- 16.2.2.2. Products
- 16.2.2.3. SWOT Analysis
- 16.2.2.4. Recent Developments
- 16.2.2.5. Financials (Based on Availability)
- 16.2.3 CAN-PACK S A
- 16.2.3.1. Overview
- 16.2.3.2. Products
- 16.2.3.3. SWOT Analysis
- 16.2.3.4. Recent Developments
- 16.2.3.5. Financials (Based on Availability)
- 16.2.4 Ardagh Group SA
- 16.2.4.1. Overview
- 16.2.4.2. Products
- 16.2.4.3. SWOT Analysis
- 16.2.4.4. Recent Developments
- 16.2.4.5. Financials (Based on Availability)
- 16.2.5 Crown Holdings Inc
- 16.2.5.1. Overview
- 16.2.5.2. Products
- 16.2.5.3. SWOT Analysis
- 16.2.5.4. Recent Developments
- 16.2.5.5. Financials (Based on Availability)
- 16.2.6 Graham Packaging Company
- 16.2.6.1. Overview
- 16.2.6.2. Products
- 16.2.6.3. SWOT Analysis
- 16.2.6.4. Recent Developments
- 16.2.6.5. Financials (Based on Availability)
- 16.2.7 Tetra Pak International
- 16.2.7.1. Overview
- 16.2.7.2. Products
- 16.2.7.3. SWOT Analysis
- 16.2.7.4. Recent Developments
- 16.2.7.5. Financials (Based on Availability)
- 16.2.8 Toyo Seikan Group Holdings Ltd
- 16.2.8.1. Overview
- 16.2.8.2. Products
- 16.2.8.3. SWOT Analysis
- 16.2.8.4. Recent Developments
- 16.2.8.5. Financials (Based on Availability)
- 16.2.9 Placon Corporation
- 16.2.9.1. Overview
- 16.2.9.2. Products
- 16.2.9.3. SWOT Analysis
- 16.2.9.4. Recent Developments
- 16.2.9.5. Financials (Based on Availability)
- 16.2.10 Sealed Air Corporation
- 16.2.10.1. Overview
- 16.2.10.2. Products
- 16.2.10.3. SWOT Analysis
- 16.2.10.4. Recent Developments
- 16.2.10.5. Financials (Based on Availability)
- 16.2.11 Owens-Illinois Inc
- 16.2.11.1. Overview
- 16.2.11.2. Products
- 16.2.11.3. SWOT Analysis
- 16.2.11.4. Recent Developments
- 16.2.11.5. Financials (Based on Availability)
- 16.2.12 Refresco Group NV
- 16.2.12.1. Overview
- 16.2.12.2. Products
- 16.2.12.3. SWOT Analysis
- 16.2.12.4. Recent Developments
- 16.2.12.5. Financials (Based on Availability)
- 16.2.13 Amcor Ltd
- 16.2.13.1. Overview
- 16.2.13.2. Products
- 16.2.13.3. SWOT Analysis
- 16.2.13.4. Recent Developments
- 16.2.13.5. Financials (Based on Availability)
- 16.2.1 WestRock Company
List of Figures
- Figure 1: Global US Soft Drinks Packaging Industry Revenue Breakdown (Million, %) by Region 2024 & 2032
- Figure 2: United states US Soft Drinks Packaging Industry Revenue (Million), by Country 2024 & 2032
- Figure 3: United states US Soft Drinks Packaging Industry Revenue Share (%), by Country 2024 & 2032
- Figure 4: North America US Soft Drinks Packaging Industry Revenue (Million), by Packaging Material Type 2024 & 2032
- Figure 5: North America US Soft Drinks Packaging Industry Revenue Share (%), by Packaging Material Type 2024 & 2032
- Figure 6: North America US Soft Drinks Packaging Industry Revenue (Million), by Product Type 2024 & 2032
- Figure 7: North America US Soft Drinks Packaging Industry Revenue Share (%), by Product Type 2024 & 2032
- Figure 8: North America US Soft Drinks Packaging Industry Revenue (Million), by Country 2024 & 2032
- Figure 9: North America US Soft Drinks Packaging Industry Revenue Share (%), by Country 2024 & 2032
- Figure 10: South America US Soft Drinks Packaging Industry Revenue (Million), by Packaging Material Type 2024 & 2032
- Figure 11: South America US Soft Drinks Packaging Industry Revenue Share (%), by Packaging Material Type 2024 & 2032
- Figure 12: South America US Soft Drinks Packaging Industry Revenue (Million), by Product Type 2024 & 2032
- Figure 13: South America US Soft Drinks Packaging Industry Revenue Share (%), by Product Type 2024 & 2032
- Figure 14: South America US Soft Drinks Packaging Industry Revenue (Million), by Country 2024 & 2032
- Figure 15: South America US Soft Drinks Packaging Industry Revenue Share (%), by Country 2024 & 2032
- Figure 16: Europe US Soft Drinks Packaging Industry Revenue (Million), by Packaging Material Type 2024 & 2032
- Figure 17: Europe US Soft Drinks Packaging Industry Revenue Share (%), by Packaging Material Type 2024 & 2032
- Figure 18: Europe US Soft Drinks Packaging Industry Revenue (Million), by Product Type 2024 & 2032
- Figure 19: Europe US Soft Drinks Packaging Industry Revenue Share (%), by Product Type 2024 & 2032
- Figure 20: Europe US Soft Drinks Packaging Industry Revenue (Million), by Country 2024 & 2032
- Figure 21: Europe US Soft Drinks Packaging Industry Revenue Share (%), by Country 2024 & 2032
- Figure 22: Middle East & Africa US Soft Drinks Packaging Industry Revenue (Million), by Packaging Material Type 2024 & 2032
- Figure 23: Middle East & Africa US Soft Drinks Packaging Industry Revenue Share (%), by Packaging Material Type 2024 & 2032
- Figure 24: Middle East & Africa US Soft Drinks Packaging Industry Revenue (Million), by Product Type 2024 & 2032
- Figure 25: Middle East & Africa US Soft Drinks Packaging Industry Revenue Share (%), by Product Type 2024 & 2032
- Figure 26: Middle East & Africa US Soft Drinks Packaging Industry Revenue (Million), by Country 2024 & 2032
- Figure 27: Middle East & Africa US Soft Drinks Packaging Industry Revenue Share (%), by Country 2024 & 2032
- Figure 28: Asia Pacific US Soft Drinks Packaging Industry Revenue (Million), by Packaging Material Type 2024 & 2032
- Figure 29: Asia Pacific US Soft Drinks Packaging Industry Revenue Share (%), by Packaging Material Type 2024 & 2032
- Figure 30: Asia Pacific US Soft Drinks Packaging Industry Revenue (Million), by Product Type 2024 & 2032
- Figure 31: Asia Pacific US Soft Drinks Packaging Industry Revenue Share (%), by Product Type 2024 & 2032
- Figure 32: Asia Pacific US Soft Drinks Packaging Industry Revenue (Million), by Country 2024 & 2032
- Figure 33: Asia Pacific US Soft Drinks Packaging Industry Revenue Share (%), by Country 2024 & 2032
List of Tables
- Table 1: Global US Soft Drinks Packaging Industry Revenue Million Forecast, by Region 2019 & 2032
- Table 2: Global US Soft Drinks Packaging Industry Revenue Million Forecast, by Packaging Material Type 2019 & 2032
- Table 3: Global US Soft Drinks Packaging Industry Revenue Million Forecast, by Product Type 2019 & 2032
- Table 4: Global US Soft Drinks Packaging Industry Revenue Million Forecast, by Region 2019 & 2032
- Table 5: Global US Soft Drinks Packaging Industry Revenue Million Forecast, by Country 2019 & 2032
- Table 6: Northeast US Soft Drinks Packaging Industry Revenue (Million) Forecast, by Application 2019 & 2032
- Table 7: Southeast US Soft Drinks Packaging Industry Revenue (Million) Forecast, by Application 2019 & 2032
- Table 8: Midwest US Soft Drinks Packaging Industry Revenue (Million) Forecast, by Application 2019 & 2032
- Table 9: Southwest US Soft Drinks Packaging Industry Revenue (Million) Forecast, by Application 2019 & 2032
- Table 10: West US Soft Drinks Packaging Industry Revenue (Million) Forecast, by Application 2019 & 2032
- Table 11: Global US Soft Drinks Packaging Industry Revenue Million Forecast, by Packaging Material Type 2019 & 2032
- Table 12: Global US Soft Drinks Packaging Industry Revenue Million Forecast, by Product Type 2019 & 2032
- Table 13: Global US Soft Drinks Packaging Industry Revenue Million Forecast, by Country 2019 & 2032
- Table 14: United States US Soft Drinks Packaging Industry Revenue (Million) Forecast, by Application 2019 & 2032
- Table 15: Canada US Soft Drinks Packaging Industry Revenue (Million) Forecast, by Application 2019 & 2032
- Table 16: Mexico US Soft Drinks Packaging Industry Revenue (Million) Forecast, by Application 2019 & 2032
- Table 17: Global US Soft Drinks Packaging Industry Revenue Million Forecast, by Packaging Material Type 2019 & 2032
- Table 18: Global US Soft Drinks Packaging Industry Revenue Million Forecast, by Product Type 2019 & 2032
- Table 19: Global US Soft Drinks Packaging Industry Revenue Million Forecast, by Country 2019 & 2032
- Table 20: Brazil US Soft Drinks Packaging Industry Revenue (Million) Forecast, by Application 2019 & 2032
- Table 21: Argentina US Soft Drinks Packaging Industry Revenue (Million) Forecast, by Application 2019 & 2032
- Table 22: Rest of South America US Soft Drinks Packaging Industry Revenue (Million) Forecast, by Application 2019 & 2032
- Table 23: Global US Soft Drinks Packaging Industry Revenue Million Forecast, by Packaging Material Type 2019 & 2032
- Table 24: Global US Soft Drinks Packaging Industry Revenue Million Forecast, by Product Type 2019 & 2032
- Table 25: Global US Soft Drinks Packaging Industry Revenue Million Forecast, by Country 2019 & 2032
- Table 26: United Kingdom US Soft Drinks Packaging Industry Revenue (Million) Forecast, by Application 2019 & 2032
- Table 27: Germany US Soft Drinks Packaging Industry Revenue (Million) Forecast, by Application 2019 & 2032
- Table 28: France US Soft Drinks Packaging Industry Revenue (Million) Forecast, by Application 2019 & 2032
- Table 29: Italy US Soft Drinks Packaging Industry Revenue (Million) Forecast, by Application 2019 & 2032
- Table 30: Spain US Soft Drinks Packaging Industry Revenue (Million) Forecast, by Application 2019 & 2032
- Table 31: Russia US Soft Drinks Packaging Industry Revenue (Million) Forecast, by Application 2019 & 2032
- Table 32: Benelux US Soft Drinks Packaging Industry Revenue (Million) Forecast, by Application 2019 & 2032
- Table 33: Nordics US Soft Drinks Packaging Industry Revenue (Million) Forecast, by Application 2019 & 2032
- Table 34: Rest of Europe US Soft Drinks Packaging Industry Revenue (Million) Forecast, by Application 2019 & 2032
- Table 35: Global US Soft Drinks Packaging Industry Revenue Million Forecast, by Packaging Material Type 2019 & 2032
- Table 36: Global US Soft Drinks Packaging Industry Revenue Million Forecast, by Product Type 2019 & 2032
- Table 37: Global US Soft Drinks Packaging Industry Revenue Million Forecast, by Country 2019 & 2032
- Table 38: Turkey US Soft Drinks Packaging Industry Revenue (Million) Forecast, by Application 2019 & 2032
- Table 39: Israel US Soft Drinks Packaging Industry Revenue (Million) Forecast, by Application 2019 & 2032
- Table 40: GCC US Soft Drinks Packaging Industry Revenue (Million) Forecast, by Application 2019 & 2032
- Table 41: North Africa US Soft Drinks Packaging Industry Revenue (Million) Forecast, by Application 2019 & 2032
- Table 42: South Africa US Soft Drinks Packaging Industry Revenue (Million) Forecast, by Application 2019 & 2032
- Table 43: Rest of Middle East & Africa US Soft Drinks Packaging Industry Revenue (Million) Forecast, by Application 2019 & 2032
- Table 44: Global US Soft Drinks Packaging Industry Revenue Million Forecast, by Packaging Material Type 2019 & 2032
- Table 45: Global US Soft Drinks Packaging Industry Revenue Million Forecast, by Product Type 2019 & 2032
- Table 46: Global US Soft Drinks Packaging Industry Revenue Million Forecast, by Country 2019 & 2032
- Table 47: China US Soft Drinks Packaging Industry Revenue (Million) Forecast, by Application 2019 & 2032
- Table 48: India US Soft Drinks Packaging Industry Revenue (Million) Forecast, by Application 2019 & 2032
- Table 49: Japan US Soft Drinks Packaging Industry Revenue (Million) Forecast, by Application 2019 & 2032
- Table 50: South Korea US Soft Drinks Packaging Industry Revenue (Million) Forecast, by Application 2019 & 2032
- Table 51: ASEAN US Soft Drinks Packaging Industry Revenue (Million) Forecast, by Application 2019 & 2032
- Table 52: Oceania US Soft Drinks Packaging Industry Revenue (Million) Forecast, by Application 2019 & 2032
- Table 53: Rest of Asia Pacific US Soft Drinks Packaging Industry Revenue (Million) Forecast, by Application 2019 & 2032
Frequently Asked Questions
1. What is the projected Compound Annual Growth Rate (CAGR) of the US Soft Drinks Packaging Industry?
The projected CAGR is approximately 8.20%.
2. Which companies are prominent players in the US Soft Drinks Packaging Industry?
Key companies in the market include WestRock Company, Ball Corporation, CAN-PACK S A, Ardagh Group SA, Crown Holdings Inc, Graham Packaging Company, Tetra Pak International, Toyo Seikan Group Holdings Ltd, Placon Corporation, Sealed Air Corporation, Owens-Illinois Inc, Refresco Group NV, Amcor Ltd.
3. What are the main segments of the US Soft Drinks Packaging Industry?
The market segments include Packaging Material Type, Product Type.
4. Can you provide details about the market size?
The market size is estimated to be USD XX Million as of 2022.
5. What are some drivers contributing to market growth?
Growing Demand for Ready-to-use Drinks; Increased demand for convenience packaging from consumers.
6. What are the notable trends driving market growth?
Plastic is Expected to Hold Significant Market Share.
7. Are there any restraints impacting market growth?
Environmental concerns regarding usage of plastic; Stringent Government Regulations.
8. Can you provide examples of recent developments in the market?
June 2021 - Amcor launched new machines to produce ultra-clear and heat resistance films. The AmPrima line uses machine-direction orientation technology to produce films that can run at speeds that competitors cannot match in a recycle-ready solution for packaging purposes.
9. What pricing options are available for accessing the report?
Pricing options include single-user, multi-user, and enterprise licenses priced at USD 3800, USD 4500, and USD 5800 respectively.
10. Is the market size provided in terms of value or volume?
The market size is provided in terms of value, measured in Million.
11. Are there any specific market keywords associated with the report?
Yes, the market keyword associated with the report is "US Soft Drinks Packaging Industry," which aids in identifying and referencing the specific market segment covered.
12. How do I determine which pricing option suits my needs best?
The pricing options vary based on user requirements and access needs. Individual users may opt for single-user licenses, while businesses requiring broader access may choose multi-user or enterprise licenses for cost-effective access to the report.
13. Are there any additional resources or data provided in the US Soft Drinks Packaging Industry report?
While the report offers comprehensive insights, it's advisable to review the specific contents or supplementary materials provided to ascertain if additional resources or data are available.
14. How can I stay updated on further developments or reports in the US Soft Drinks Packaging Industry?
To stay informed about further developments, trends, and reports in the US Soft Drinks Packaging Industry, consider subscribing to industry newsletters, following relevant companies and organizations, or regularly checking reputable industry news sources and publications.
Methodology
Step 1 - Identification of Relevant Samples Size from Population Database


Step 2 - Approaches for Defining Global Market Size (Value, Volume* & Price*)

Note*: In applicable scenarios
Step 3 - Data Sources
Primary Research
- Web Analytics
- Survey Reports
- Research Institute
- Latest Research Reports
- Opinion Leaders
Secondary Research
- Annual Reports
- White Paper
- Latest Press Release
- Industry Association
- Paid Database
- Investor Presentations

Step 4 - Data Triangulation
Involves using different sources of information in order to increase the validity of a study
These sources are likely to be stakeholders in a program - participants, other researchers, program staff, other community members, and so on.
Then we put all data in single framework & apply various statistical tools to find out the dynamic on the market.
During the analysis stage, feedback from the stakeholder groups would be compared to determine areas of agreement as well as areas of divergence


