

Key Insights
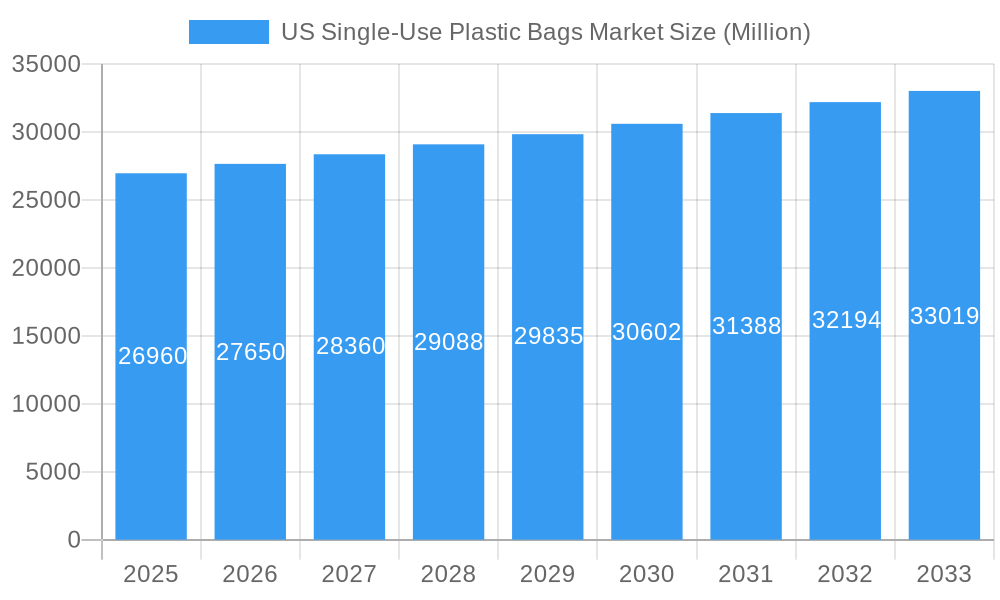
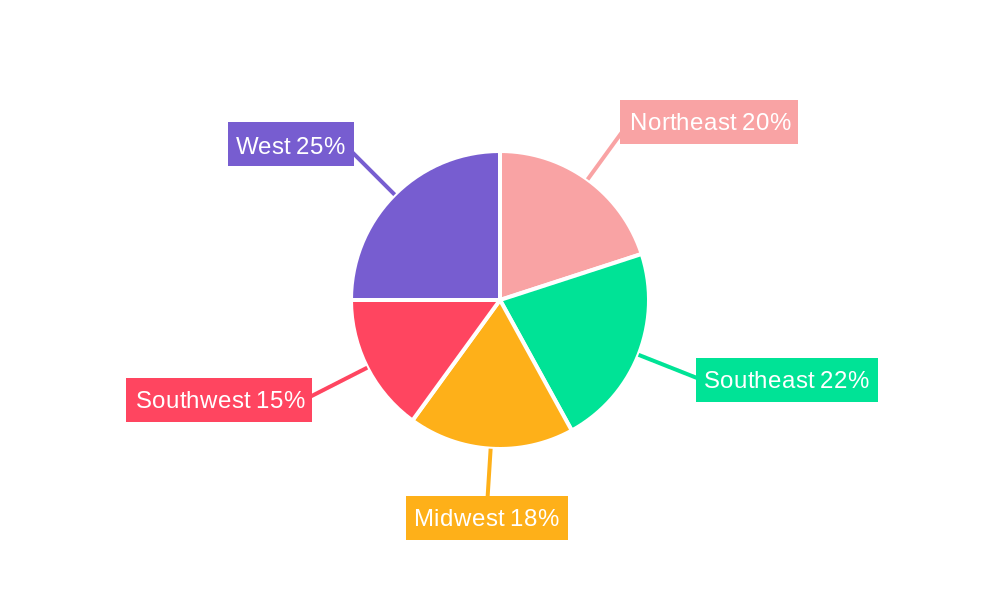
The US single-use plastic bag market, valued at $26.96 billion in 2025, is projected to experience steady growth, driven by the continued demand across various end-user industries. The market's Compound Annual Growth Rate (CAGR) of 2.72% from 2019 to 2024 indicates a consistent, albeit moderate, expansion. Key drivers include the convenience and affordability of plastic bags, particularly within the food and beverage sectors, and their widespread use in retail settings. However, growing environmental concerns surrounding plastic waste and increasing government regulations aimed at reducing plastic consumption pose significant restraints. The market is segmented by end-user industry (food, beverage, healthcare, personal care, and others) and material type (paper and paperboard, plastics, aluminum, and others). While plastic remains dominant, we expect to see a gradual shift towards more sustainable alternatives like paper and biodegradable plastics, fueled by consumer preference and regulatory pressure. This shift will influence market dynamics in the coming years, presenting opportunities for manufacturers of eco-friendly packaging solutions. The regional distribution across the United States (Northeast, Southeast, Midwest, Southwest, and West) likely mirrors overall population distribution and consumption patterns, with higher concentrations in densely populated areas.
US Single-Use Plastic Bags Market Market Size (In Billion)
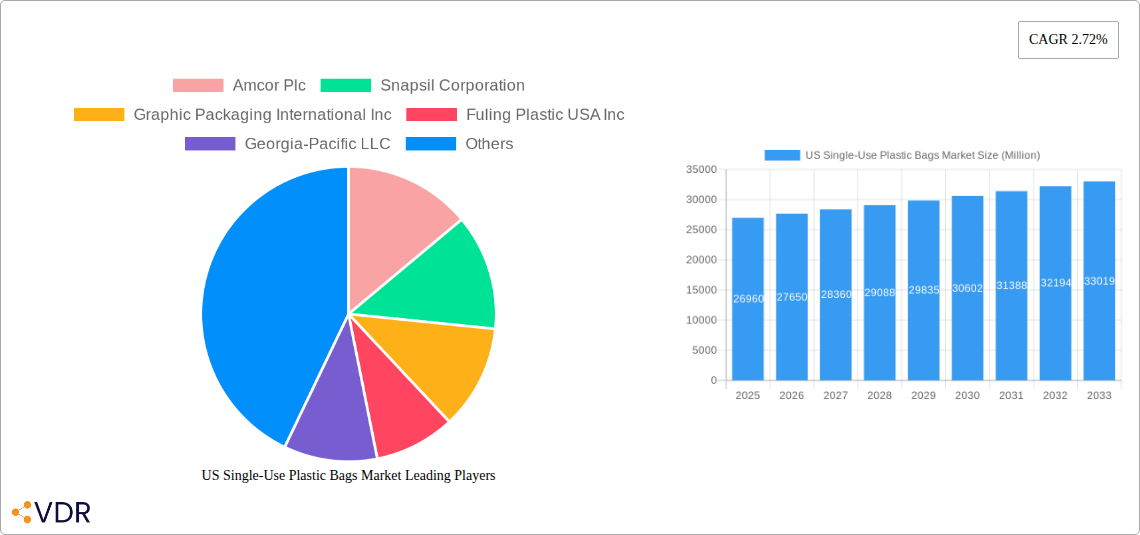
The forecast period from 2025 to 2033 anticipates continued market expansion, albeit at a potentially moderated pace due to the aforementioned restraints. Companies such as Amcor Plc, Snapsil Corporation, and others are key players navigating this evolving landscape, focusing on innovation and diversification to meet shifting consumer demands and regulatory compliance. Strategic initiatives will include investing in recyclable or biodegradable plastic bag technologies and exploring alternative packaging materials. The success of these companies will be contingent upon their ability to balance cost-effectiveness with sustainability, thereby catering to both consumer and environmental concerns. The market's long-term trajectory will depend heavily on the implementation and effectiveness of policies designed to curb single-use plastic waste and encourage the adoption of environmentally sound alternatives.
US Single-Use Plastic Bags Market Company Market Share
US Single-Use Plastic Bags Market: A Comprehensive Report (2019-2033)
This in-depth report provides a comprehensive analysis of the US single-use plastic bags market, encompassing market dynamics, growth trends, dominant segments, product landscape, challenges, opportunities, and key players. The report covers the period from 2019 to 2033, with a focus on the forecast period 2025-2033 (Base Year: 2025, Estimated Year: 2025). The study examines the parent market of packaging materials and the child market of single-use plastic bags within the broader US consumer goods landscape. This report is crucial for industry professionals seeking to understand the market dynamics and future trends within the US single-use plastic bags sector. The market size is projected to reach xx million units by 2033.
US Single-Use Plastic Bags Market Market Dynamics & Structure
The US single-use plastic bag market is a dynamic landscape shaped by evolving consumer preferences, increasing environmental consciousness, and regulatory pressures. While the market is characterized by moderate concentration with several established players, innovation is increasingly focused on developing more sustainable alternatives and enhancing the performance of existing products. Key factors influencing market dynamics include stringent environmental regulations aimed at reducing plastic waste and a growing consumer demand for eco-friendly options. The market faces significant competition from the rising adoption of reusable bags and a wider array of alternative packaging materials, which are impacting the demand for single-use plastic bags. Although mergers and acquisitions (M&A) activity has been subdued in recent years, strategic partnerships and collaborations are gaining prominence as companies seek to navigate the evolving market and enhance their competitive positioning.
- Market Concentration: Moderately concentrated, with the top 10 players collectively holding approximately 65-75% of the market share in 2024. This indicates a competitive environment with room for smaller, specialized players.
- Technological Innovation: The primary focus is on the development and adoption of biodegradable, compostable, and recyclable materials. Innovations also extend to improving barrier properties for enhanced product protection and the optimization of manufacturing processes for greater efficiency and reduced environmental impact.
- Regulatory Framework: A significant and increasing number of state and local regulations are being implemented to curb the use of single-use plastic bags through bans, fees, or mandates for reusable alternatives. These regulations are a major catalyst for market transformation.
- Competitive Substitutes: The market faces robust competition from a range of alternatives, including durable reusable bags (made from various fabrics), paper bags, and innovative biodegradable packaging solutions, all of which are gaining traction among environmentally aware consumers.
- End-User Demographics: The food retail and grocery sectors remain dominant consumers of single-use plastic bags due to their convenience and cost-effectiveness. The e-commerce industry also represents a growing segment, utilizing them for product packaging and delivery.
- M&A Trends: While outright acquisitions have been less frequent, strategic alliances, joint ventures, and technology licensing agreements are becoming more prevalent as companies collaborate to share resources, research, and development efforts to address market challenges and capitalize on emerging opportunities.
US Single-Use Plastic Bags Market Growth Trends & Insights
The US single-use plastic bag market witnessed a CAGR of xx% during the historical period (2019-2024), driven by increased consumption from retail, food services, and e-commerce. Adoption rates remain high, particularly within food and beverage sectors. However, growth is anticipated to moderate due to regulatory pressures and the rise of sustainable alternatives. Technological disruptions, such as the development of biodegradable plastic, are expected to impact market growth. Consumer behavior shifts towards sustainable options and reduced plastic usage are significantly impacting market trajectory. Market penetration of biodegradable/compostable bags is currently at xx%, expected to reach xx% by 2033.
Dominant Regions, Countries, or Segments in US Single-Use Plastic Bags Market
The food and beverage segment dominates the US single-use plastic bag market, followed by the healthcare and pharmaceutical sectors. California, Texas, and Florida are leading states in terms of consumption. Plastic remains the dominant material, although the market share of paper and paperboard is gradually increasing.
- By End-user Industry: Food & Beverage (xx million units), Healthcare & Pharmaceutical (xx million units), Personal Care (xx million units), Others (xx million units).
- By Material: Plastics (xx million units), Paper & Paperboard (xx million units), Aluminum (xx million units), Others (xx million units).
- Key Drivers: High consumption in food retail and rising e-commerce, favorable regulatory environment in certain regions.
US Single-Use Plastic Bags Market Product Landscape
The market offers a wide range of single-use plastic bags, varying in size, material, thickness, and features. Innovations focus on improving barrier properties, increasing durability, and incorporating sustainable materials. Many manufacturers are emphasizing enhanced recyclability and compostability as unique selling propositions, leveraging advanced material technologies.
Key Drivers, Barriers & Challenges in US Single-Use Plastic Bags Market
Key Drivers: The persistent demand for convenience and affordability in retail operations, coupled with the continued expansion of the e-commerce sector, are significant drivers for the US single-use plastic bag market. Their lightweight nature and low production cost make them an attractive option for many businesses and consumers.
Challenges: The most significant challenge stems from escalating environmental concerns regarding plastic pollution and its impact on ecosystems. This has led to intensified regulatory scrutiny and bans in many jurisdictions. Furthermore, the increasing availability and consumer preference for eco-friendly alternatives, such as reusable bags and compostable materials, present a substantial barrier to traditional single-use plastic bag growth. Supply chain vulnerabilities, including potential disruptions and volatile raw material prices, also add layers of complexity and risk, impacting profitability and market stability. The market faces an estimated reduction in growth rate, potentially ranging from 3-7% annually in the coming years due to these combined factors.
Emerging Opportunities in US Single-Use Plastic Bags Market
Growing demand for biodegradable and compostable plastic bags presents a significant opportunity. Targeting the e-commerce sector with specialized packaging solutions holds potential for expansion. Further development of innovative materials and sustainable manufacturing processes will be key to unlocking future growth.
Growth Accelerators in the US Single-Use Plastic Bags Market Industry
Technological advancements, such as developing innovative sustainable materials and improved recycling technologies, are vital growth catalysts. Strategic partnerships between manufacturers and retailers can facilitate broader market adoption of eco-friendly alternatives. Expanding into untapped niche markets and exploring new applications for sustainable packaging can unlock long-term growth.
Key Players Shaping the US Single-Use Plastic Bags Market Market
- Amcor Plc
- Berry Global Inc
- Pactiv LLC (part of Reynolds Consumer Products)
- Novolex
- Graphic Packaging International Inc
- PPC Flexible Packaging LLC
- Dart Container Corporation
- Sigma Plastics Group
- Bags on Demand Inc.
- Uline
Notable Milestones in US Single-Use Plastic Bags Market Sector
- September 2022: Novolex significantly boosted its commitment to sustainability by investing USD 10 million to expand its Indiana recycling facility. This expansion is projected to increase its annual recycled material output by 28 million lbs, contributing to a more circular economy for plastic packaging.
- July 2022: Novolex introduced an innovative new stand for its Cutlerease utensil dispenser. This enhancement aims to improve the product's functionality, ease of use, and overall customer experience, thereby strengthening its market presence and appeal.
- Early 2023: Several states and municipalities enacted new legislation or strengthened existing policies aimed at reducing single-use plastic bag consumption, mandating either outright bans or the implementation of fees for plastic bag distribution at the point of sale.
- Late 2023: Leading manufacturers began unveiling new product lines incorporating a higher percentage of post-consumer recycled (PCR) content, responding to regulatory demands and increasing market interest in sustainable packaging solutions.
In-Depth US Single-Use Plastic Bags Market Market Outlook
The US single-use plastic bag market is navigating a transformative period, with its outlook characterized by a shift towards more sustainable practices and materials. While traditional plastic bags will continue to see some demand due to their established utility and cost-effectiveness, the market is increasingly being shaped by the imperative for environmental responsibility. Companies that proactively invest in and commercialize advanced biodegradable, compostable, and highly recyclable materials are poised to capture a greater share of the market. Furthermore, the development of closed-loop recycling systems and innovative packaging designs that minimize material usage will be crucial for long-term viability. Strategic alliances with technology providers, material science firms, and waste management companies will be instrumental in fostering innovation and expanding market reach into niche sectors and geographical regions with evolving regulatory landscapes. The market's future trajectory will largely depend on its ability to adapt to stringent environmental mandates and to meet the growing consumer demand for guilt-free convenience.
US Single-Use Plastic Bags Market Segmentation
-
1. Material
- 1.1. Paper and Paperboard
- 1.2. Plastics
- 1.3. Aluminium
- 1.4. Other Materials
-
2. End-user Industry
- 2.1. Food
- 2.2. Beverage
- 2.3. Healthcare and Pharmaceutical
- 2.4. Personal Care
- 2.5. Other End-user Industries
US Single-Use Plastic Bags Market Segmentation By Geography
-
1. North America
- 1.1. United States
- 1.2. Canada
- 1.3. Mexico
-
2. South America
- 2.1. Brazil
- 2.2. Argentina
- 2.3. Rest of South America
-
3. Europe
- 3.1. United Kingdom
- 3.2. Germany
- 3.3. France
- 3.4. Italy
- 3.5. Spain
- 3.6. Russia
- 3.7. Benelux
- 3.8. Nordics
- 3.9. Rest of Europe
-
4. Middle East & Africa
- 4.1. Turkey
- 4.2. Israel
- 4.3. GCC
- 4.4. North Africa
- 4.5. South Africa
- 4.6. Rest of Middle East & Africa
-
5. Asia Pacific
- 5.1. China
- 5.2. India
- 5.3. Japan
- 5.4. South Korea
- 5.5. ASEAN
- 5.6. Oceania
- 5.7. Rest of Asia Pacific
US Single-Use Plastic Bags Market Regional Market Share
Geographic Coverage of US Single-Use Plastic Bags Market
US Single-Use Plastic Bags Market REPORT HIGHLIGHTS
| Aspects | Details |
|---|---|
| Study Period | 2020-2034 |
| Base Year | 2025 |
| Estimated Year | 2026 |
| Forecast Period | 2026-2034 |
| Historical Period | 2020-2025 |
| Growth Rate | CAGR of 2.72% from 2020-2034 |
| Segmentation |
|
Table of Contents
- 1. Introduction
- 1.1. Research Scope
- 1.2. Market Segmentation
- 1.3. Research Objective
- 1.4. Definitions and Assumptions
- 2. Executive Summary
- 2.1. Market Snapshot
- 3. Market Dynamics
- 3.1. Market Drivers
- 3.2. Market Restrains
- 3.3. Market Trends
- 3.4. Market Opportunities
- 4. Market Factor Analysis
- 4.1. Porters Five Forces
- 4.1.1. Bargaining Power of Suppliers
- 4.1.2. Bargaining Power of Buyers
- 4.1.3. Threat of New Entrants
- 4.1.4. Threat of Substitutes
- 4.1.5. Competitive Rivalry
- 4.2. PESTEL analysis
- 4.3. BCG Analysis
- 4.3.1. Stars (High Growth, High Market Share)
- 4.3.2. Cash Cows (Low Growth, High Market Share)
- 4.3.3. Question Mark (High Growth, Low Market Share)
- 4.3.4. Dogs (Low Growth, Low Market Share)
- 4.4. Ansoff Matrix Analysis
- 4.5. Supply Chain Analysis
- 4.6. Regulatory Landscape
- 4.7. Current Market Potential and Opportunity Assessment (TAM–SAM–SOM Framework)
- 4.8. VDR Analyst Note
- 4.1. Porters Five Forces
- 5. Market Analysis, Insights and Forecast 2021-2033
- 5.1. Market Analysis, Insights and Forecast - by Material
- 5.1.1. Paper and Paperboard
- 5.1.2. Plastics
- 5.1.3. Aluminium
- 5.1.4. Other Materials
- 5.2. Market Analysis, Insights and Forecast - by End-user Industry
- 5.2.1. Food
- 5.2.2. Beverage
- 5.2.3. Healthcare and Pharmaceutical
- 5.2.4. Personal Care
- 5.2.5. Other End-user Industries
- 5.3. Market Analysis, Insights and Forecast - by Region
- 5.3.1. North America
- 5.3.2. South America
- 5.3.3. Europe
- 5.3.4. Middle East & Africa
- 5.3.5. Asia Pacific
- 5.1. Market Analysis, Insights and Forecast - by Material
- 6. Global US Single-Use Plastic Bags Market Analysis, Insights and Forecast, 2021-2033
- 6.1. Market Analysis, Insights and Forecast - by Material
- 6.1.1. Paper and Paperboard
- 6.1.2. Plastics
- 6.1.3. Aluminium
- 6.1.4. Other Materials
- 6.2. Market Analysis, Insights and Forecast - by End-user Industry
- 6.2.1. Food
- 6.2.2. Beverage
- 6.2.3. Healthcare and Pharmaceutical
- 6.2.4. Personal Care
- 6.2.5. Other End-user Industries
- 6.1. Market Analysis, Insights and Forecast - by Material
- 7. North America US Single-Use Plastic Bags Market Analysis, Insights and Forecast, 2021-2033
- 7.1. Market Analysis, Insights and Forecast - by Material
- 7.1.1. Paper and Paperboard
- 7.1.2. Plastics
- 7.1.3. Aluminium
- 7.1.4. Other Materials
- 7.2. Market Analysis, Insights and Forecast - by End-user Industry
- 7.2.1. Food
- 7.2.2. Beverage
- 7.2.3. Healthcare and Pharmaceutical
- 7.2.4. Personal Care
- 7.2.5. Other End-user Industries
- 7.1. Market Analysis, Insights and Forecast - by Material
- 8. South America US Single-Use Plastic Bags Market Analysis, Insights and Forecast, 2021-2033
- 8.1. Market Analysis, Insights and Forecast - by Material
- 8.1.1. Paper and Paperboard
- 8.1.2. Plastics
- 8.1.3. Aluminium
- 8.1.4. Other Materials
- 8.2. Market Analysis, Insights and Forecast - by End-user Industry
- 8.2.1. Food
- 8.2.2. Beverage
- 8.2.3. Healthcare and Pharmaceutical
- 8.2.4. Personal Care
- 8.2.5. Other End-user Industries
- 8.1. Market Analysis, Insights and Forecast - by Material
- 9. Europe US Single-Use Plastic Bags Market Analysis, Insights and Forecast, 2021-2033
- 9.1. Market Analysis, Insights and Forecast - by Material
- 9.1.1. Paper and Paperboard
- 9.1.2. Plastics
- 9.1.3. Aluminium
- 9.1.4. Other Materials
- 9.2. Market Analysis, Insights and Forecast - by End-user Industry
- 9.2.1. Food
- 9.2.2. Beverage
- 9.2.3. Healthcare and Pharmaceutical
- 9.2.4. Personal Care
- 9.2.5. Other End-user Industries
- 9.1. Market Analysis, Insights and Forecast - by Material
- 10. Middle East & Africa US Single-Use Plastic Bags Market Analysis, Insights and Forecast, 2021-2033
- 10.1. Market Analysis, Insights and Forecast - by Material
- 10.1.1. Paper and Paperboard
- 10.1.2. Plastics
- 10.1.3. Aluminium
- 10.1.4. Other Materials
- 10.2. Market Analysis, Insights and Forecast - by End-user Industry
- 10.2.1. Food
- 10.2.2. Beverage
- 10.2.3. Healthcare and Pharmaceutical
- 10.2.4. Personal Care
- 10.2.5. Other End-user Industries
- 10.1. Market Analysis, Insights and Forecast - by Material
- 11. Asia Pacific US Single-Use Plastic Bags Market Analysis, Insights and Forecast, 2021-2033
- 11.1. Market Analysis, Insights and Forecast - by Material
- 11.1.1. Paper and Paperboard
- 11.1.2. Plastics
- 11.1.3. Aluminium
- 11.1.4. Other Materials
- 11.2. Market Analysis, Insights and Forecast - by End-user Industry
- 11.2.1. Food
- 11.2.2. Beverage
- 11.2.3. Healthcare and Pharmaceutical
- 11.2.4. Personal Care
- 11.2.5. Other End-user Industries
- 11.1. Market Analysis, Insights and Forecast - by Material
- 12. Competitive Analysis
- 12.1. Company Profiles
- 12.1.1 Amcor Plc
- 12.1.1.1. Company Overview
- 12.1.1.2. Products
- 12.1.1.3. Company Financials
- 12.1.1.4. SWOT Analysis
- 12.1.2 Snapsil Corporation
- 12.1.2.1. Company Overview
- 12.1.2.2. Products
- 12.1.2.3. Company Financials
- 12.1.2.4. SWOT Analysis
- 12.1.3 Graphic Packaging International Inc
- 12.1.3.1. Company Overview
- 12.1.3.2. Products
- 12.1.3.3. Company Financials
- 12.1.3.4. SWOT Analysis
- 12.1.4 Fuling Plastic USA Inc
- 12.1.4.1. Company Overview
- 12.1.4.2. Products
- 12.1.4.3. Company Financials
- 12.1.4.4. SWOT Analysis
- 12.1.5 Georgia-Pacific LLC
- 12.1.5.1. Company Overview
- 12.1.5.2. Products
- 12.1.5.3. Company Financials
- 12.1.5.4. SWOT Analysis
- 12.1.6 PPC Flexible Packaging LLC
- 12.1.6.1. Company Overview
- 12.1.6.2. Products
- 12.1.6.3. Company Financials
- 12.1.6.4. SWOT Analysis
- 12.1.7 Pactiv LLC
- 12.1.7.1. Company Overview
- 12.1.7.2. Products
- 12.1.7.3. Company Financials
- 12.1.7.4. SWOT Analysis
- 12.1.8 Novolex
- 12.1.8.1. Company Overview
- 12.1.8.2. Products
- 12.1.8.3. Company Financials
- 12.1.8.4. SWOT Analysis
- 12.1.9 Berry Global Inc
- 12.1.9.1. Company Overview
- 12.1.9.2. Products
- 12.1.9.3. Company Financials
- 12.1.9.4. SWOT Analysis
- 12.1.10 Dart Container Corporation
- 12.1.10.1. Company Overview
- 12.1.10.2. Products
- 12.1.10.3. Company Financials
- 12.1.10.4. SWOT Analysis
- 12.1.1 Amcor Plc
- 12.2. Market Entropy
- 12.2.1 Company's Key Areas Served
- 12.2.2 Recent Developments
- 12.3. Company Market Share Analysis 2025
- 12.3.1 Top 5 Companies Market Share Analysis
- 12.3.2 Top 3 Companies Market Share Analysis
- 12.4. List of Potential Customers
- 13. Research Methodology
List of Figures
- Figure 1: Global US Single-Use Plastic Bags Market Revenue Breakdown (Million, %) by Region 2025 & 2033
- Figure 2: North America US Single-Use Plastic Bags Market Revenue (Million), by Material 2025 & 2033
- Figure 3: North America US Single-Use Plastic Bags Market Revenue Share (%), by Material 2025 & 2033
- Figure 4: North America US Single-Use Plastic Bags Market Revenue (Million), by End-user Industry 2025 & 2033
- Figure 5: North America US Single-Use Plastic Bags Market Revenue Share (%), by End-user Industry 2025 & 2033
- Figure 6: North America US Single-Use Plastic Bags Market Revenue (Million), by Country 2025 & 2033
- Figure 7: North America US Single-Use Plastic Bags Market Revenue Share (%), by Country 2025 & 2033
- Figure 8: South America US Single-Use Plastic Bags Market Revenue (Million), by Material 2025 & 2033
- Figure 9: South America US Single-Use Plastic Bags Market Revenue Share (%), by Material 2025 & 2033
- Figure 10: South America US Single-Use Plastic Bags Market Revenue (Million), by End-user Industry 2025 & 2033
- Figure 11: South America US Single-Use Plastic Bags Market Revenue Share (%), by End-user Industry 2025 & 2033
- Figure 12: South America US Single-Use Plastic Bags Market Revenue (Million), by Country 2025 & 2033
- Figure 13: South America US Single-Use Plastic Bags Market Revenue Share (%), by Country 2025 & 2033
- Figure 14: Europe US Single-Use Plastic Bags Market Revenue (Million), by Material 2025 & 2033
- Figure 15: Europe US Single-Use Plastic Bags Market Revenue Share (%), by Material 2025 & 2033
- Figure 16: Europe US Single-Use Plastic Bags Market Revenue (Million), by End-user Industry 2025 & 2033
- Figure 17: Europe US Single-Use Plastic Bags Market Revenue Share (%), by End-user Industry 2025 & 2033
- Figure 18: Europe US Single-Use Plastic Bags Market Revenue (Million), by Country 2025 & 2033
- Figure 19: Europe US Single-Use Plastic Bags Market Revenue Share (%), by Country 2025 & 2033
- Figure 20: Middle East & Africa US Single-Use Plastic Bags Market Revenue (Million), by Material 2025 & 2033
- Figure 21: Middle East & Africa US Single-Use Plastic Bags Market Revenue Share (%), by Material 2025 & 2033
- Figure 22: Middle East & Africa US Single-Use Plastic Bags Market Revenue (Million), by End-user Industry 2025 & 2033
- Figure 23: Middle East & Africa US Single-Use Plastic Bags Market Revenue Share (%), by End-user Industry 2025 & 2033
- Figure 24: Middle East & Africa US Single-Use Plastic Bags Market Revenue (Million), by Country 2025 & 2033
- Figure 25: Middle East & Africa US Single-Use Plastic Bags Market Revenue Share (%), by Country 2025 & 2033
- Figure 26: Asia Pacific US Single-Use Plastic Bags Market Revenue (Million), by Material 2025 & 2033
- Figure 27: Asia Pacific US Single-Use Plastic Bags Market Revenue Share (%), by Material 2025 & 2033
- Figure 28: Asia Pacific US Single-Use Plastic Bags Market Revenue (Million), by End-user Industry 2025 & 2033
- Figure 29: Asia Pacific US Single-Use Plastic Bags Market Revenue Share (%), by End-user Industry 2025 & 2033
- Figure 30: Asia Pacific US Single-Use Plastic Bags Market Revenue (Million), by Country 2025 & 2033
- Figure 31: Asia Pacific US Single-Use Plastic Bags Market Revenue Share (%), by Country 2025 & 2033
List of Tables
- Table 1: Global US Single-Use Plastic Bags Market Revenue Million Forecast, by Material 2020 & 2033
- Table 2: Global US Single-Use Plastic Bags Market Revenue Million Forecast, by End-user Industry 2020 & 2033
- Table 3: Global US Single-Use Plastic Bags Market Revenue Million Forecast, by Region 2020 & 2033
- Table 4: Global US Single-Use Plastic Bags Market Revenue Million Forecast, by Material 2020 & 2033
- Table 5: Global US Single-Use Plastic Bags Market Revenue Million Forecast, by End-user Industry 2020 & 2033
- Table 6: Global US Single-Use Plastic Bags Market Revenue Million Forecast, by Country 2020 & 2033
- Table 7: United States US Single-Use Plastic Bags Market Revenue (Million) Forecast, by Application 2020 & 2033
- Table 8: Canada US Single-Use Plastic Bags Market Revenue (Million) Forecast, by Application 2020 & 2033
- Table 9: Mexico US Single-Use Plastic Bags Market Revenue (Million) Forecast, by Application 2020 & 2033
- Table 10: Global US Single-Use Plastic Bags Market Revenue Million Forecast, by Material 2020 & 2033
- Table 11: Global US Single-Use Plastic Bags Market Revenue Million Forecast, by End-user Industry 2020 & 2033
- Table 12: Global US Single-Use Plastic Bags Market Revenue Million Forecast, by Country 2020 & 2033
- Table 13: Brazil US Single-Use Plastic Bags Market Revenue (Million) Forecast, by Application 2020 & 2033
- Table 14: Argentina US Single-Use Plastic Bags Market Revenue (Million) Forecast, by Application 2020 & 2033
- Table 15: Rest of South America US Single-Use Plastic Bags Market Revenue (Million) Forecast, by Application 2020 & 2033
- Table 16: Global US Single-Use Plastic Bags Market Revenue Million Forecast, by Material 2020 & 2033
- Table 17: Global US Single-Use Plastic Bags Market Revenue Million Forecast, by End-user Industry 2020 & 2033
- Table 18: Global US Single-Use Plastic Bags Market Revenue Million Forecast, by Country 2020 & 2033
- Table 19: United Kingdom US Single-Use Plastic Bags Market Revenue (Million) Forecast, by Application 2020 & 2033
- Table 20: Germany US Single-Use Plastic Bags Market Revenue (Million) Forecast, by Application 2020 & 2033
- Table 21: France US Single-Use Plastic Bags Market Revenue (Million) Forecast, by Application 2020 & 2033
- Table 22: Italy US Single-Use Plastic Bags Market Revenue (Million) Forecast, by Application 2020 & 2033
- Table 23: Spain US Single-Use Plastic Bags Market Revenue (Million) Forecast, by Application 2020 & 2033
- Table 24: Russia US Single-Use Plastic Bags Market Revenue (Million) Forecast, by Application 2020 & 2033
- Table 25: Benelux US Single-Use Plastic Bags Market Revenue (Million) Forecast, by Application 2020 & 2033
- Table 26: Nordics US Single-Use Plastic Bags Market Revenue (Million) Forecast, by Application 2020 & 2033
- Table 27: Rest of Europe US Single-Use Plastic Bags Market Revenue (Million) Forecast, by Application 2020 & 2033
- Table 28: Global US Single-Use Plastic Bags Market Revenue Million Forecast, by Material 2020 & 2033
- Table 29: Global US Single-Use Plastic Bags Market Revenue Million Forecast, by End-user Industry 2020 & 2033
- Table 30: Global US Single-Use Plastic Bags Market Revenue Million Forecast, by Country 2020 & 2033
- Table 31: Turkey US Single-Use Plastic Bags Market Revenue (Million) Forecast, by Application 2020 & 2033
- Table 32: Israel US Single-Use Plastic Bags Market Revenue (Million) Forecast, by Application 2020 & 2033
- Table 33: GCC US Single-Use Plastic Bags Market Revenue (Million) Forecast, by Application 2020 & 2033
- Table 34: North Africa US Single-Use Plastic Bags Market Revenue (Million) Forecast, by Application 2020 & 2033
- Table 35: South Africa US Single-Use Plastic Bags Market Revenue (Million) Forecast, by Application 2020 & 2033
- Table 36: Rest of Middle East & Africa US Single-Use Plastic Bags Market Revenue (Million) Forecast, by Application 2020 & 2033
- Table 37: Global US Single-Use Plastic Bags Market Revenue Million Forecast, by Material 2020 & 2033
- Table 38: Global US Single-Use Plastic Bags Market Revenue Million Forecast, by End-user Industry 2020 & 2033
- Table 39: Global US Single-Use Plastic Bags Market Revenue Million Forecast, by Country 2020 & 2033
- Table 40: China US Single-Use Plastic Bags Market Revenue (Million) Forecast, by Application 2020 & 2033
- Table 41: India US Single-Use Plastic Bags Market Revenue (Million) Forecast, by Application 2020 & 2033
- Table 42: Japan US Single-Use Plastic Bags Market Revenue (Million) Forecast, by Application 2020 & 2033
- Table 43: South Korea US Single-Use Plastic Bags Market Revenue (Million) Forecast, by Application 2020 & 2033
- Table 44: ASEAN US Single-Use Plastic Bags Market Revenue (Million) Forecast, by Application 2020 & 2033
- Table 45: Oceania US Single-Use Plastic Bags Market Revenue (Million) Forecast, by Application 2020 & 2033
- Table 46: Rest of Asia Pacific US Single-Use Plastic Bags Market Revenue (Million) Forecast, by Application 2020 & 2033
Frequently Asked Questions
1. What is the projected Compound Annual Growth Rate (CAGR) of the US Single-Use Plastic Bags Market?
The projected CAGR is approximately 2.72%.
2. Which companies are prominent players in the US Single-Use Plastic Bags Market?
Key companies in the market include Amcor Plc, Snapsil Corporation, Graphic Packaging International Inc, Fuling Plastic USA Inc, Georgia-Pacific LLC, PPC Flexible Packaging LLC, Pactiv LLC, Novolex, Berry Global Inc, Dart Container Corporation.
3. What are the main segments of the US Single-Use Plastic Bags Market?
The market segments include Material, End-user Industry.
4. Can you provide details about the market size?
The market size is estimated to be USD 26.96 Million as of 2022.
5. What are some drivers contributing to market growth?
Ongoing Trend Toward Lightweight and Use of Sustainable Solutions (such as Paper-based Cups); Flexible Single-use Packaging Products Offering Increased Convenience and Utility.
6. What are the notable trends driving market growth?
Flexible Single-use Plastic Packaging Products Offering Increased Convenience and Utility.
7. Are there any restraints impacting market growth?
High upfront and operational cost for deploying coding and making equipment.
8. Can you provide examples of recent developments in the market?
September 2022: Novolex, a North American company, invested USD 10 million to expand the Indiana, United States, recycling facility's capacity, enabling the recycling of plastic bags and other PE films. After the procurement of mechanical recycling equipment, the plant will be able to produce up to 28 million lbs (12,698 MT) of recycled material yearly to generate new goods made from post-consumer or post-industrial recycled material.
9. What pricing options are available for accessing the report?
Pricing options include single-user, multi-user, and enterprise licenses priced at USD 3800, USD 4500, and USD 5800 respectively.
10. Is the market size provided in terms of value or volume?
The market size is provided in terms of value, measured in Million.
11. Are there any specific market keywords associated with the report?
Yes, the market keyword associated with the report is "US Single-Use Plastic Bags Market," which aids in identifying and referencing the specific market segment covered.
12. How do I determine which pricing option suits my needs best?
The pricing options vary based on user requirements and access needs. Individual users may opt for single-user licenses, while businesses requiring broader access may choose multi-user or enterprise licenses for cost-effective access to the report.
13. Are there any additional resources or data provided in the US Single-Use Plastic Bags Market report?
While the report offers comprehensive insights, it's advisable to review the specific contents or supplementary materials provided to ascertain if additional resources or data are available.
14. How can I stay updated on further developments or reports in the US Single-Use Plastic Bags Market?
To stay informed about further developments, trends, and reports in the US Single-Use Plastic Bags Market, consider subscribing to industry newsletters, following relevant companies and organizations, or regularly checking reputable industry news sources and publications.
Methodology
Step 1 - Identification of Relevant Samples Size from Population Database


Step 2 - Approaches for Defining Global Market Size (Value, Volume* & Price*)

Note*: In applicable scenarios
Step 3 - Data Sources
Primary Research
- Web Analytics
- Survey Reports
- Research Institute
- Latest Research Reports
- Opinion Leaders
Secondary Research
- Annual Reports
- White Paper
- Latest Press Release
- Industry Association
- Paid Database
- Investor Presentations

Step 4 - Data Triangulation
Involves using different sources of information in order to increase the validity of a study
These sources are likely to be stakeholders in a program - participants, other researchers, program staff, other community members, and so on.
Then we put all data in single framework & apply various statistical tools to find out the dynamic on the market.
During the analysis stage, feedback from the stakeholder groups would be compared to determine areas of agreement as well as areas of divergence