

Key Insights
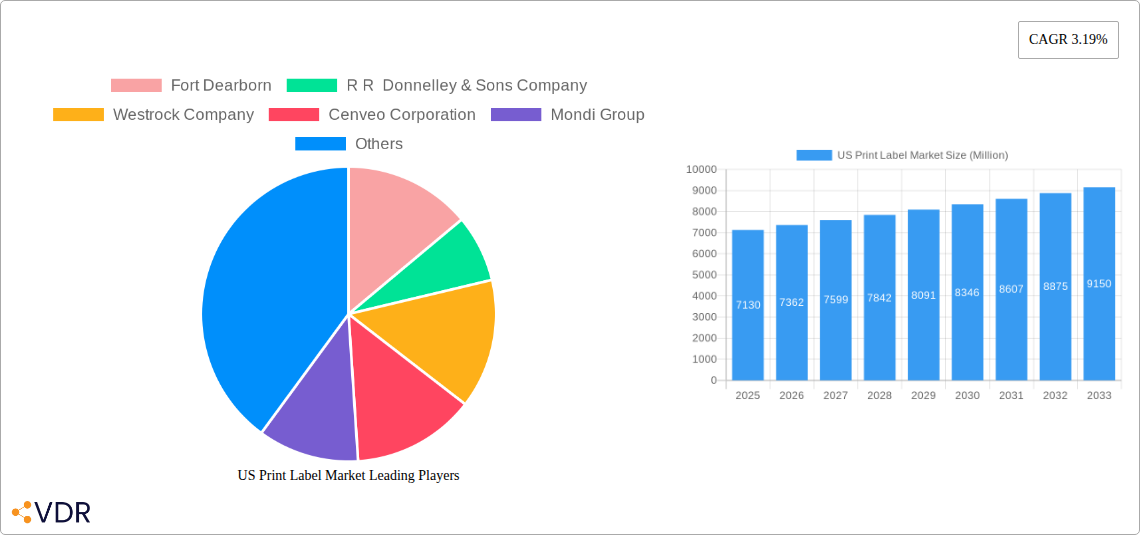
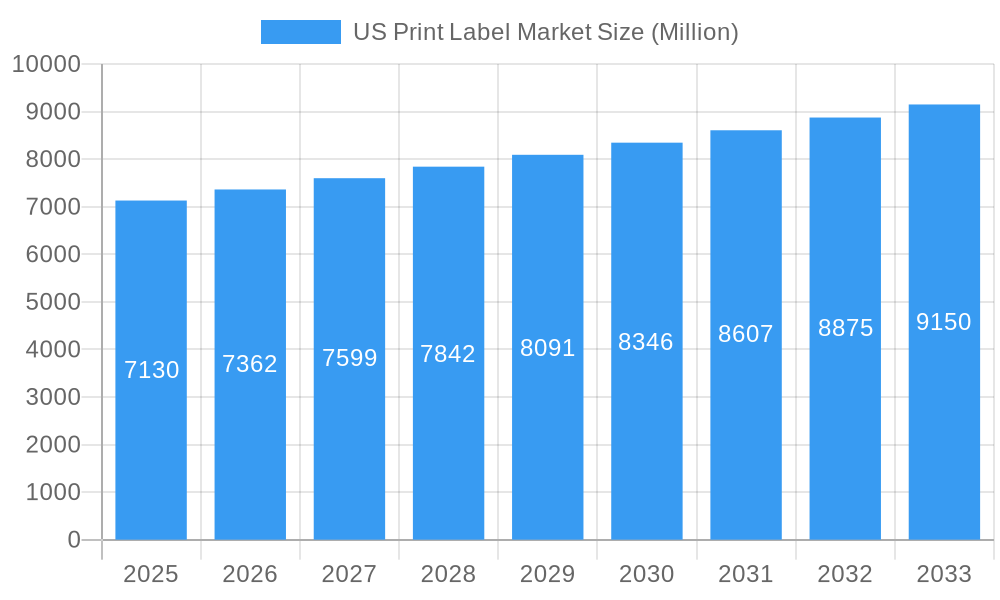
The US print label market, valued at $7.13 billion in 2025, is projected to experience steady growth, driven by a robust CAGR of 3.19% from 2025 to 2033. This expansion is fueled by several key factors. The increasing demand for product branding and enhanced consumer experiences across diverse sectors like food and beverage, healthcare, and cosmetics necessitates sophisticated and visually appealing labels. The rise of e-commerce and the need for efficient supply chain tracking, particularly with multi-part tracking labels and linerless labels (reducing material waste), also significantly contribute to market growth. Furthermore, technological advancements in print processes, such as the adoption of inkjet printing for high-quality, customized labels, and the expanding use of pressure-sensitive labels for ease of application, are fostering market expansion. However, challenges remain, including fluctuating raw material costs and increasing environmental concerns related to label waste. This necessitates the industry to innovate toward sustainable solutions like eco-friendly materials and reduced-waste label formats. The segment analysis reveals significant potential within pressure-sensitive labels due to their versatility and convenience, while the food and beverage industry remains a dominant end-user sector. Competition is strong, with major players like Avery Dennison, Multi Color Corporation, and others vying for market share through innovation and strategic partnerships. The regional breakdown within the US points to a balanced distribution of market share across Northeast, Southeast, Midwest, Southwest, and West, with potential regional variations in growth rates depending on specific industry concentrations and consumer demand.
US Print Label Market Market Size (In Billion)
The forecast period (2025-2033) anticipates continuous market growth, influenced by several factors, including the continued growth of e-commerce and the rising popularity of personalized products. Growth will also be shaped by technological advancements, such as improved digital printing capabilities enhancing label customization and efficiency. However, regulatory changes regarding sustainable packaging and increasing awareness of environmental impacts will likely drive the adoption of eco-friendly label materials and printing methods. This trend will be a key factor influencing the competitiveness of label manufacturers and their ability to attract environmentally conscious customers. The market's future success will depend on the industry's ability to adapt to evolving consumer preferences, adopt sustainable practices, and leverage technological advancements to deliver innovative and cost-effective labeling solutions.
US Print Label Market Company Market Share
US Print Label Market: A Comprehensive Market Report (2019-2033)
This in-depth report provides a comprehensive analysis of the US print label market, covering market dynamics, growth trends, dominant segments, key players, and future outlook. The report utilizes data from 2019-2024 (Historical Period), with a Base Year of 2025 and a Forecast Period of 2025-2033. The Study Period encompasses 2019-2033. This report is invaluable for industry professionals, investors, and strategic decision-makers seeking a granular understanding of this dynamic market. The market is segmented by print process, label format, and end-user industry, providing a multifaceted perspective. The total market size is projected to reach xx Million units by 2033.
US Print Label Market Dynamics & Structure
The US print label market is characterized by a moderately concentrated landscape, with several major players holding significant market share. However, the presence of numerous smaller, specialized companies also contributes to market vibrancy. Technological innovation is a key driver, with advancements in digital printing, material science, and finishing techniques constantly shaping product offerings and production efficiencies. Stringent regulatory frameworks related to labeling requirements across various industries (e.g., food safety, healthcare) heavily influence market dynamics. Competitive product substitutes, such as digital displays and RFID tags, exert pressure on traditional print labels, necessitating ongoing innovation. End-user demographics, particularly shifting consumer preferences and evolving brand strategies, play a crucial role. Finally, mergers and acquisitions (M&A) activity, as evidenced by recent deals, demonstrate a consolidation trend within the industry.
- Market Concentration: Moderately concentrated, with top 5 players holding approximately xx% market share in 2024.
- Technological Innovation: Focus on digital printing, sustainable materials, and enhanced security features.
- Regulatory Framework: Stringent regulations across various end-user industries impacting label design and material choices.
- Competitive Substitutes: Growing adoption of digital displays and RFID tags poses a challenge to traditional labels.
- M&A Activity: Significant M&A activity observed in recent years, indicating industry consolidation. Deal volume estimated at xx in 2024.
- Innovation Barriers: High capital investment required for new technologies and skilled labor shortages.
US Print Label Market Growth Trends & Insights
The US print label market has demonstrated significant expansion over the historical period (2019-2024), fueled by a confluence of factors including the proliferation of diverse product offerings, escalating demand across a spectrum of end-user industries, and notable advancements in printing technologies. This upward trajectory is projected to persist through the forecast period (2025-2033), though potentially at a slightly tempered growth rate. A prominent trend is the accelerating integration of sustainable and environmentally conscious label materials. Furthermore, evolving consumer preferences for personalized and digitally integrated labels are actively reshaping market dynamics. Concurrently, technological innovations, particularly the widespread adoption of digital printing solutions, are fundamentally transforming the production landscape.
- Market Size Evolution: The market experienced a substantial increase, growing from approximately [Insert Specific Value] Million units in 2019 to [Insert Specific Value] Million units in 2024, signifying a Compound Annual Growth Rate (CAGR) of [Insert Specific Percentage]%.
- Adoption Rates: The integration of digital printing technologies is accelerating at a rapid pace, paralleled by a steady and increasing demand for sustainable labeling solutions.
- Technological Disruptions: Digital printing is revolutionizing label production, offering unprecedented levels of flexibility, faster turnaround times, and enhanced customization capabilities.
- Consumer Behavior Shifts: The discernible trend towards personalized and aesthetically compelling labels is a key driver in product development and packaging design strategies.
- Projected CAGR (2025-2033): The market is anticipated to grow at a CAGR of approximately [Insert Specific Percentage]% during the forecast period.
Dominant Regions, Countries, or Segments in US Print Label Market
The US print label market exhibits regional variations in growth dynamics, with certain segments demonstrating stronger performance. While a comprehensive breakdown requires detailed regional data, the report highlights key factors influencing dominance. Within the print processes, flexography leads the market due to its cost-effectiveness and suitability for high-volume production. Pressure-sensitive labels dominate the label format segment, owing to their ease of application and versatility. The food and beverage industry, driven by rising consumer packaged goods demand, accounts for the largest end-user market share.
- By Print Process: Flexography holds the largest market share, followed by offset lithography and digital printing.
- By Label Format: Pressure-sensitive labels dominate, followed by wet-glue labels and linerless labels.
- By End-user Industry: Food and beverage accounts for the largest share, followed by healthcare and cosmetics.
- Key Drivers: Increasing demand from the food and beverage and healthcare sectors, along with technological advancements.
- Growth Potential: Strong growth potential exists in the linerless labels and sustainable label material segments.
US Print Label Market Product Landscape
The US print label market showcases a diverse range of products characterized by continuous innovation. Product innovations encompass enhanced security features, sustainable materials, and improved adhesion properties. Applications span a wide spectrum, from simple product identification to sophisticated track-and-trace systems. Performance metrics focus on print quality, durability, and ease of application. Unique selling propositions often center on customization options, eco-friendly attributes, and cost-effectiveness. Technological advancements in digital printing allow for mass personalization and variable data printing capabilities.
Key Drivers, Barriers & Challenges in US Print Label Market
Key Drivers: Increasing demand from various end-user industries (particularly food and beverage, healthcare, and logistics), technological advancements in printing techniques and materials, and the growing need for product traceability and security features are propelling market growth.
Key Challenges and Restraints: Supply chain disruptions, impacting material availability and lead times; increasing raw material costs; stringent environmental regulations; and intense competition are key challenges hindering market growth. Estimated xx% increase in raw material costs in 2024 impacted production.
Emerging Opportunities in US Print Label Market
The US print label market is ripe with emerging opportunities. Untapped market segments, such as specialized sectors demanding high-security labels or those requiring labels with advanced functionalities like integrated temperature sensors, present significant growth potential. The evolution towards smart labels, incorporating technologies such as RFID or NFC, offers a compelling avenue for innovation and market penetration. Furthermore, the growing consumer consciousness around sustainability and the desire for brand personalization are creating novel avenues for product development and market expansion.
Growth Accelerators in the US Print Label Market Industry
Key drivers accelerating the growth of the US print label market include groundbreaking technological advancements in digital printing, innovative developments in material science, and sophisticated finishing techniques. Strategic collaborations between label manufacturers and leading technology providers are proving instrumental in fostering a culture of continuous innovation. Moreover, aggressive market expansion strategies, targeting new end-user industries and geographical regions, are creating additional avenues for sustained growth.
Key Players Shaping the US Print Label Market Market
- Fort Dearborn
- R R Donnelley & Sons Company
- Westrock Company
- Cenveo Corporation
- Mondi Group
- Multi Color Corporation
- Avery Dennison Corporation
- Taylor Corporation
- Ahlstrom-munksjö Oyj
- Brady Corporation
Notable Milestones in US Print Label Market Sector
- February 2021: R.R. Donnelley & Sons Company expands operations in Sacramento, creating Pacific Standard Print, enhancing digital and sheetfed capabilities.
- March 2021: Avery Dennison Corporation acquires JDC Solutions, Inc. for USD 24 million, expanding its pressure-sensitive tape portfolio.
In-Depth US Print Label Market Market Outlook
The US print label market is strongly positioned for continued expansion, propelled by the relentless pace of technological innovation, the robust and increasing demand from a diverse array of end-user industries, and the escalating adoption of sustainable labeling practices. Strategic opportunities are abundant in the development of specialized labels equipped with advanced functionalities, the exploration of underserved market segments, and the leveraging of strategic partnerships to cultivate innovation. A steadfast commitment to sustainability and digitalization will be paramount for achieving enduring success and maintaining a competitive edge in this dynamic market.
US Print Label Market Segmentation
-
1. Print Process
- 1.1. Offset Lithography
- 1.2. Gravure
- 1.3. Flexography
- 1.4. Screen
- 1.5. Letterpress
- 1.6. Electrophotography
- 1.7. Inkjet
-
2. Label Format
- 2.1. Wet-glue Labels
- 2.2. Pressure-sensitive Labels
- 2.3. Linerless Labels
- 2.4. Multi-part Tracking Labels
- 2.5. In-mold Labels
- 2.6. Shrink and Stretch Sleeves
-
3. End-user Industry
- 3.1. Food
- 3.2. Beverage
- 3.3. Healthcare
- 3.4. Cosmetics
- 3.5. Household
- 3.6. Industri
- 3.7. Logistics
- 3.8. Other End-user Industries
US Print Label Market Segmentation By Geography
-
1. North America
- 1.1. United States
- 1.2. Canada
- 1.3. Mexico
-
2. South America
- 2.1. Brazil
- 2.2. Argentina
- 2.3. Rest of South America
-
3. Europe
- 3.1. United Kingdom
- 3.2. Germany
- 3.3. France
- 3.4. Italy
- 3.5. Spain
- 3.6. Russia
- 3.7. Benelux
- 3.8. Nordics
- 3.9. Rest of Europe
-
4. Middle East & Africa
- 4.1. Turkey
- 4.2. Israel
- 4.3. GCC
- 4.4. North Africa
- 4.5. South Africa
- 4.6. Rest of Middle East & Africa
-
5. Asia Pacific
- 5.1. China
- 5.2. India
- 5.3. Japan
- 5.4. South Korea
- 5.5. ASEAN
- 5.6. Oceania
- 5.7. Rest of Asia Pacific
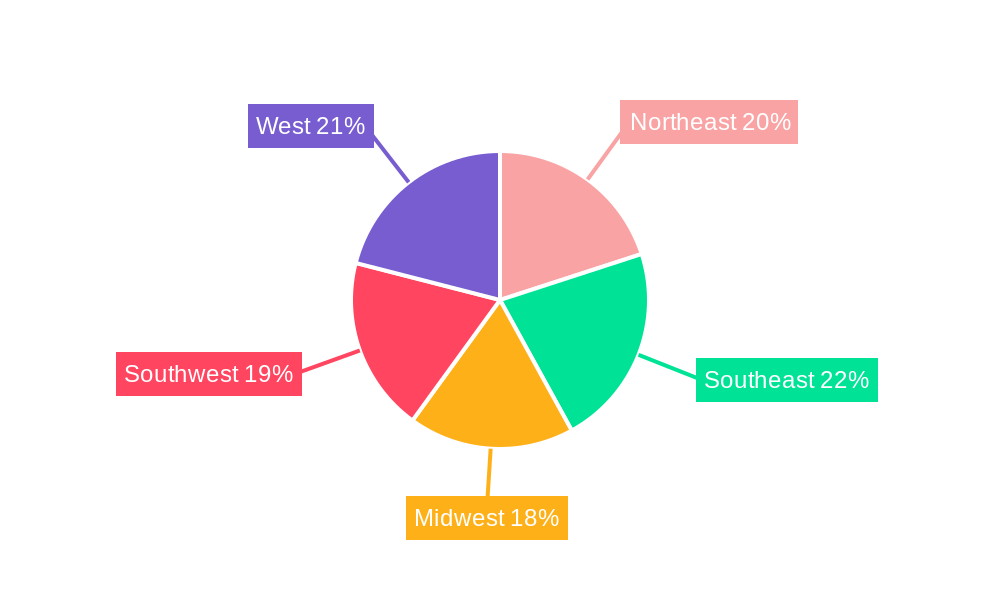
US Print Label Market Regional Market Share
Geographic Coverage of US Print Label Market
US Print Label Market REPORT HIGHLIGHTS
| Aspects | Details |
|---|---|
| Study Period | 2020-2034 |
| Base Year | 2025 |
| Estimated Year | 2026 |
| Forecast Period | 2026-2034 |
| Historical Period | 2020-2025 |
| Growth Rate | CAGR of 3.19% from 2020-2034 |
| Segmentation |
|
Table of Contents
- 1. Introduction
- 1.1. Research Scope
- 1.2. Market Segmentation
- 1.3. Research Objective
- 1.4. Definitions and Assumptions
- 2. Executive Summary
- 2.1. Market Snapshot
- 3. Market Dynamics
- 3.1. Market Drivers
- 3.2. Market Restrains
- 3.3. Market Trends
- 3.4. Market Opportunities
- 4. Market Factor Analysis
- 4.1. Porters Five Forces
- 4.1.1. Bargaining Power of Suppliers
- 4.1.2. Bargaining Power of Buyers
- 4.1.3. Threat of New Entrants
- 4.1.4. Threat of Substitutes
- 4.1.5. Competitive Rivalry
- 4.2. PESTEL analysis
- 4.3. BCG Analysis
- 4.3.1. Stars (High Growth, High Market Share)
- 4.3.2. Cash Cows (Low Growth, High Market Share)
- 4.3.3. Question Mark (High Growth, Low Market Share)
- 4.3.4. Dogs (Low Growth, Low Market Share)
- 4.4. Ansoff Matrix Analysis
- 4.5. Supply Chain Analysis
- 4.6. Regulatory Landscape
- 4.7. Current Market Potential and Opportunity Assessment (TAM–SAM–SOM Framework)
- 4.8. VDR Analyst Note
- 4.1. Porters Five Forces
- 5. Market Analysis, Insights and Forecast 2021-2033
- 5.1. Market Analysis, Insights and Forecast - by Print Process
- 5.1.1. Offset Lithography
- 5.1.2. Gravure
- 5.1.3. Flexography
- 5.1.4. Screen
- 5.1.5. Letterpress
- 5.1.6. Electrophotography
- 5.1.7. Inkjet
- 5.2. Market Analysis, Insights and Forecast - by Label Format
- 5.2.1. Wet-glue Labels
- 5.2.2. Pressure-sensitive Labels
- 5.2.3. Linerless Labels
- 5.2.4. Multi-part Tracking Labels
- 5.2.5. In-mold Labels
- 5.2.6. Shrink and Stretch Sleeves
- 5.3. Market Analysis, Insights and Forecast - by End-user Industry
- 5.3.1. Food
- 5.3.2. Beverage
- 5.3.3. Healthcare
- 5.3.4. Cosmetics
- 5.3.5. Household
- 5.3.6. Industri
- 5.3.7. Logistics
- 5.3.8. Other End-user Industries
- 5.4. Market Analysis, Insights and Forecast - by Region
- 5.4.1. North America
- 5.4.2. South America
- 5.4.3. Europe
- 5.4.4. Middle East & Africa
- 5.4.5. Asia Pacific
- 5.1. Market Analysis, Insights and Forecast - by Print Process
- 6. Global US Print Label Market Analysis, Insights and Forecast, 2021-2033
- 6.1. Market Analysis, Insights and Forecast - by Print Process
- 6.1.1. Offset Lithography
- 6.1.2. Gravure
- 6.1.3. Flexography
- 6.1.4. Screen
- 6.1.5. Letterpress
- 6.1.6. Electrophotography
- 6.1.7. Inkjet
- 6.2. Market Analysis, Insights and Forecast - by Label Format
- 6.2.1. Wet-glue Labels
- 6.2.2. Pressure-sensitive Labels
- 6.2.3. Linerless Labels
- 6.2.4. Multi-part Tracking Labels
- 6.2.5. In-mold Labels
- 6.2.6. Shrink and Stretch Sleeves
- 6.3. Market Analysis, Insights and Forecast - by End-user Industry
- 6.3.1. Food
- 6.3.2. Beverage
- 6.3.3. Healthcare
- 6.3.4. Cosmetics
- 6.3.5. Household
- 6.3.6. Industri
- 6.3.7. Logistics
- 6.3.8. Other End-user Industries
- 6.1. Market Analysis, Insights and Forecast - by Print Process
- 7. North America US Print Label Market Analysis, Insights and Forecast, 2021-2033
- 7.1. Market Analysis, Insights and Forecast - by Print Process
- 7.1.1. Offset Lithography
- 7.1.2. Gravure
- 7.1.3. Flexography
- 7.1.4. Screen
- 7.1.5. Letterpress
- 7.1.6. Electrophotography
- 7.1.7. Inkjet
- 7.2. Market Analysis, Insights and Forecast - by Label Format
- 7.2.1. Wet-glue Labels
- 7.2.2. Pressure-sensitive Labels
- 7.2.3. Linerless Labels
- 7.2.4. Multi-part Tracking Labels
- 7.2.5. In-mold Labels
- 7.2.6. Shrink and Stretch Sleeves
- 7.3. Market Analysis, Insights and Forecast - by End-user Industry
- 7.3.1. Food
- 7.3.2. Beverage
- 7.3.3. Healthcare
- 7.3.4. Cosmetics
- 7.3.5. Household
- 7.3.6. Industri
- 7.3.7. Logistics
- 7.3.8. Other End-user Industries
- 7.1. Market Analysis, Insights and Forecast - by Print Process
- 8. South America US Print Label Market Analysis, Insights and Forecast, 2021-2033
- 8.1. Market Analysis, Insights and Forecast - by Print Process
- 8.1.1. Offset Lithography
- 8.1.2. Gravure
- 8.1.3. Flexography
- 8.1.4. Screen
- 8.1.5. Letterpress
- 8.1.6. Electrophotography
- 8.1.7. Inkjet
- 8.2. Market Analysis, Insights and Forecast - by Label Format
- 8.2.1. Wet-glue Labels
- 8.2.2. Pressure-sensitive Labels
- 8.2.3. Linerless Labels
- 8.2.4. Multi-part Tracking Labels
- 8.2.5. In-mold Labels
- 8.2.6. Shrink and Stretch Sleeves
- 8.3. Market Analysis, Insights and Forecast - by End-user Industry
- 8.3.1. Food
- 8.3.2. Beverage
- 8.3.3. Healthcare
- 8.3.4. Cosmetics
- 8.3.5. Household
- 8.3.6. Industri
- 8.3.7. Logistics
- 8.3.8. Other End-user Industries
- 8.1. Market Analysis, Insights and Forecast - by Print Process
- 9. Europe US Print Label Market Analysis, Insights and Forecast, 2021-2033
- 9.1. Market Analysis, Insights and Forecast - by Print Process
- 9.1.1. Offset Lithography
- 9.1.2. Gravure
- 9.1.3. Flexography
- 9.1.4. Screen
- 9.1.5. Letterpress
- 9.1.6. Electrophotography
- 9.1.7. Inkjet
- 9.2. Market Analysis, Insights and Forecast - by Label Format
- 9.2.1. Wet-glue Labels
- 9.2.2. Pressure-sensitive Labels
- 9.2.3. Linerless Labels
- 9.2.4. Multi-part Tracking Labels
- 9.2.5. In-mold Labels
- 9.2.6. Shrink and Stretch Sleeves
- 9.3. Market Analysis, Insights and Forecast - by End-user Industry
- 9.3.1. Food
- 9.3.2. Beverage
- 9.3.3. Healthcare
- 9.3.4. Cosmetics
- 9.3.5. Household
- 9.3.6. Industri
- 9.3.7. Logistics
- 9.3.8. Other End-user Industries
- 9.1. Market Analysis, Insights and Forecast - by Print Process
- 10. Middle East & Africa US Print Label Market Analysis, Insights and Forecast, 2021-2033
- 10.1. Market Analysis, Insights and Forecast - by Print Process
- 10.1.1. Offset Lithography
- 10.1.2. Gravure
- 10.1.3. Flexography
- 10.1.4. Screen
- 10.1.5. Letterpress
- 10.1.6. Electrophotography
- 10.1.7. Inkjet
- 10.2. Market Analysis, Insights and Forecast - by Label Format
- 10.2.1. Wet-glue Labels
- 10.2.2. Pressure-sensitive Labels
- 10.2.3. Linerless Labels
- 10.2.4. Multi-part Tracking Labels
- 10.2.5. In-mold Labels
- 10.2.6. Shrink and Stretch Sleeves
- 10.3. Market Analysis, Insights and Forecast - by End-user Industry
- 10.3.1. Food
- 10.3.2. Beverage
- 10.3.3. Healthcare
- 10.3.4. Cosmetics
- 10.3.5. Household
- 10.3.6. Industri
- 10.3.7. Logistics
- 10.3.8. Other End-user Industries
- 10.1. Market Analysis, Insights and Forecast - by Print Process
- 11. Asia Pacific US Print Label Market Analysis, Insights and Forecast, 2021-2033
- 11.1. Market Analysis, Insights and Forecast - by Print Process
- 11.1.1. Offset Lithography
- 11.1.2. Gravure
- 11.1.3. Flexography
- 11.1.4. Screen
- 11.1.5. Letterpress
- 11.1.6. Electrophotography
- 11.1.7. Inkjet
- 11.2. Market Analysis, Insights and Forecast - by Label Format
- 11.2.1. Wet-glue Labels
- 11.2.2. Pressure-sensitive Labels
- 11.2.3. Linerless Labels
- 11.2.4. Multi-part Tracking Labels
- 11.2.5. In-mold Labels
- 11.2.6. Shrink and Stretch Sleeves
- 11.3. Market Analysis, Insights and Forecast - by End-user Industry
- 11.3.1. Food
- 11.3.2. Beverage
- 11.3.3. Healthcare
- 11.3.4. Cosmetics
- 11.3.5. Household
- 11.3.6. Industri
- 11.3.7. Logistics
- 11.3.8. Other End-user Industries
- 11.1. Market Analysis, Insights and Forecast - by Print Process
- 12. Competitive Analysis
- 12.1. Company Profiles
- 12.1.1 Fort Dearborn
- 12.1.1.1. Company Overview
- 12.1.1.2. Products
- 12.1.1.3. Company Financials
- 12.1.1.4. SWOT Analysis
- 12.1.2 R R Donnelley & Sons Company
- 12.1.2.1. Company Overview
- 12.1.2.2. Products
- 12.1.2.3. Company Financials
- 12.1.2.4. SWOT Analysis
- 12.1.3 Westrock Company
- 12.1.3.1. Company Overview
- 12.1.3.2. Products
- 12.1.3.3. Company Financials
- 12.1.3.4. SWOT Analysis
- 12.1.4 Cenveo Corporation
- 12.1.4.1. Company Overview
- 12.1.4.2. Products
- 12.1.4.3. Company Financials
- 12.1.4.4. SWOT Analysis
- 12.1.5 Mondi Group
- 12.1.5.1. Company Overview
- 12.1.5.2. Products
- 12.1.5.3. Company Financials
- 12.1.5.4. SWOT Analysis
- 12.1.6 Multi Color Corporation
- 12.1.6.1. Company Overview
- 12.1.6.2. Products
- 12.1.6.3. Company Financials
- 12.1.6.4. SWOT Analysis
- 12.1.7 Avery Dennison Corporation
- 12.1.7.1. Company Overview
- 12.1.7.2. Products
- 12.1.7.3. Company Financials
- 12.1.7.4. SWOT Analysis
- 12.1.8 Taylor Corporation*List Not Exhaustive
- 12.1.8.1. Company Overview
- 12.1.8.2. Products
- 12.1.8.3. Company Financials
- 12.1.8.4. SWOT Analysis
- 12.1.9 Ahlstrom-munksjö Oyj
- 12.1.9.1. Company Overview
- 12.1.9.2. Products
- 12.1.9.3. Company Financials
- 12.1.9.4. SWOT Analysis
- 12.1.10 Brady Corporation
- 12.1.10.1. Company Overview
- 12.1.10.2. Products
- 12.1.10.3. Company Financials
- 12.1.10.4. SWOT Analysis
- 12.1.1 Fort Dearborn
- 12.2. Market Entropy
- 12.2.1 Company's Key Areas Served
- 12.2.2 Recent Developments
- 12.3. Company Market Share Analysis 2025
- 12.3.1 Top 5 Companies Market Share Analysis
- 12.3.2 Top 3 Companies Market Share Analysis
- 12.4. List of Potential Customers
- 13. Research Methodology
List of Figures
- Figure 1: Global US Print Label Market Revenue Breakdown (Million, %) by Region 2025 & 2033
- Figure 2: North America US Print Label Market Revenue (Million), by Print Process 2025 & 2033
- Figure 3: North America US Print Label Market Revenue Share (%), by Print Process 2025 & 2033
- Figure 4: North America US Print Label Market Revenue (Million), by Label Format 2025 & 2033
- Figure 5: North America US Print Label Market Revenue Share (%), by Label Format 2025 & 2033
- Figure 6: North America US Print Label Market Revenue (Million), by End-user Industry 2025 & 2033
- Figure 7: North America US Print Label Market Revenue Share (%), by End-user Industry 2025 & 2033
- Figure 8: North America US Print Label Market Revenue (Million), by Country 2025 & 2033
- Figure 9: North America US Print Label Market Revenue Share (%), by Country 2025 & 2033
- Figure 10: South America US Print Label Market Revenue (Million), by Print Process 2025 & 2033
- Figure 11: South America US Print Label Market Revenue Share (%), by Print Process 2025 & 2033
- Figure 12: South America US Print Label Market Revenue (Million), by Label Format 2025 & 2033
- Figure 13: South America US Print Label Market Revenue Share (%), by Label Format 2025 & 2033
- Figure 14: South America US Print Label Market Revenue (Million), by End-user Industry 2025 & 2033
- Figure 15: South America US Print Label Market Revenue Share (%), by End-user Industry 2025 & 2033
- Figure 16: South America US Print Label Market Revenue (Million), by Country 2025 & 2033
- Figure 17: South America US Print Label Market Revenue Share (%), by Country 2025 & 2033
- Figure 18: Europe US Print Label Market Revenue (Million), by Print Process 2025 & 2033
- Figure 19: Europe US Print Label Market Revenue Share (%), by Print Process 2025 & 2033
- Figure 20: Europe US Print Label Market Revenue (Million), by Label Format 2025 & 2033
- Figure 21: Europe US Print Label Market Revenue Share (%), by Label Format 2025 & 2033
- Figure 22: Europe US Print Label Market Revenue (Million), by End-user Industry 2025 & 2033
- Figure 23: Europe US Print Label Market Revenue Share (%), by End-user Industry 2025 & 2033
- Figure 24: Europe US Print Label Market Revenue (Million), by Country 2025 & 2033
- Figure 25: Europe US Print Label Market Revenue Share (%), by Country 2025 & 2033
- Figure 26: Middle East & Africa US Print Label Market Revenue (Million), by Print Process 2025 & 2033
- Figure 27: Middle East & Africa US Print Label Market Revenue Share (%), by Print Process 2025 & 2033
- Figure 28: Middle East & Africa US Print Label Market Revenue (Million), by Label Format 2025 & 2033
- Figure 29: Middle East & Africa US Print Label Market Revenue Share (%), by Label Format 2025 & 2033
- Figure 30: Middle East & Africa US Print Label Market Revenue (Million), by End-user Industry 2025 & 2033
- Figure 31: Middle East & Africa US Print Label Market Revenue Share (%), by End-user Industry 2025 & 2033
- Figure 32: Middle East & Africa US Print Label Market Revenue (Million), by Country 2025 & 2033
- Figure 33: Middle East & Africa US Print Label Market Revenue Share (%), by Country 2025 & 2033
- Figure 34: Asia Pacific US Print Label Market Revenue (Million), by Print Process 2025 & 2033
- Figure 35: Asia Pacific US Print Label Market Revenue Share (%), by Print Process 2025 & 2033
- Figure 36: Asia Pacific US Print Label Market Revenue (Million), by Label Format 2025 & 2033
- Figure 37: Asia Pacific US Print Label Market Revenue Share (%), by Label Format 2025 & 2033
- Figure 38: Asia Pacific US Print Label Market Revenue (Million), by End-user Industry 2025 & 2033
- Figure 39: Asia Pacific US Print Label Market Revenue Share (%), by End-user Industry 2025 & 2033
- Figure 40: Asia Pacific US Print Label Market Revenue (Million), by Country 2025 & 2033
- Figure 41: Asia Pacific US Print Label Market Revenue Share (%), by Country 2025 & 2033
List of Tables
- Table 1: Global US Print Label Market Revenue Million Forecast, by Print Process 2020 & 2033
- Table 2: Global US Print Label Market Revenue Million Forecast, by Label Format 2020 & 2033
- Table 3: Global US Print Label Market Revenue Million Forecast, by End-user Industry 2020 & 2033
- Table 4: Global US Print Label Market Revenue Million Forecast, by Region 2020 & 2033
- Table 5: Global US Print Label Market Revenue Million Forecast, by Print Process 2020 & 2033
- Table 6: Global US Print Label Market Revenue Million Forecast, by Label Format 2020 & 2033
- Table 7: Global US Print Label Market Revenue Million Forecast, by End-user Industry 2020 & 2033
- Table 8: Global US Print Label Market Revenue Million Forecast, by Country 2020 & 2033
- Table 9: United States US Print Label Market Revenue (Million) Forecast, by Application 2020 & 2033
- Table 10: Canada US Print Label Market Revenue (Million) Forecast, by Application 2020 & 2033
- Table 11: Mexico US Print Label Market Revenue (Million) Forecast, by Application 2020 & 2033
- Table 12: Global US Print Label Market Revenue Million Forecast, by Print Process 2020 & 2033
- Table 13: Global US Print Label Market Revenue Million Forecast, by Label Format 2020 & 2033
- Table 14: Global US Print Label Market Revenue Million Forecast, by End-user Industry 2020 & 2033
- Table 15: Global US Print Label Market Revenue Million Forecast, by Country 2020 & 2033
- Table 16: Brazil US Print Label Market Revenue (Million) Forecast, by Application 2020 & 2033
- Table 17: Argentina US Print Label Market Revenue (Million) Forecast, by Application 2020 & 2033
- Table 18: Rest of South America US Print Label Market Revenue (Million) Forecast, by Application 2020 & 2033
- Table 19: Global US Print Label Market Revenue Million Forecast, by Print Process 2020 & 2033
- Table 20: Global US Print Label Market Revenue Million Forecast, by Label Format 2020 & 2033
- Table 21: Global US Print Label Market Revenue Million Forecast, by End-user Industry 2020 & 2033
- Table 22: Global US Print Label Market Revenue Million Forecast, by Country 2020 & 2033
- Table 23: United Kingdom US Print Label Market Revenue (Million) Forecast, by Application 2020 & 2033
- Table 24: Germany US Print Label Market Revenue (Million) Forecast, by Application 2020 & 2033
- Table 25: France US Print Label Market Revenue (Million) Forecast, by Application 2020 & 2033
- Table 26: Italy US Print Label Market Revenue (Million) Forecast, by Application 2020 & 2033
- Table 27: Spain US Print Label Market Revenue (Million) Forecast, by Application 2020 & 2033
- Table 28: Russia US Print Label Market Revenue (Million) Forecast, by Application 2020 & 2033
- Table 29: Benelux US Print Label Market Revenue (Million) Forecast, by Application 2020 & 2033
- Table 30: Nordics US Print Label Market Revenue (Million) Forecast, by Application 2020 & 2033
- Table 31: Rest of Europe US Print Label Market Revenue (Million) Forecast, by Application 2020 & 2033
- Table 32: Global US Print Label Market Revenue Million Forecast, by Print Process 2020 & 2033
- Table 33: Global US Print Label Market Revenue Million Forecast, by Label Format 2020 & 2033
- Table 34: Global US Print Label Market Revenue Million Forecast, by End-user Industry 2020 & 2033
- Table 35: Global US Print Label Market Revenue Million Forecast, by Country 2020 & 2033
- Table 36: Turkey US Print Label Market Revenue (Million) Forecast, by Application 2020 & 2033
- Table 37: Israel US Print Label Market Revenue (Million) Forecast, by Application 2020 & 2033
- Table 38: GCC US Print Label Market Revenue (Million) Forecast, by Application 2020 & 2033
- Table 39: North Africa US Print Label Market Revenue (Million) Forecast, by Application 2020 & 2033
- Table 40: South Africa US Print Label Market Revenue (Million) Forecast, by Application 2020 & 2033
- Table 41: Rest of Middle East & Africa US Print Label Market Revenue (Million) Forecast, by Application 2020 & 2033
- Table 42: Global US Print Label Market Revenue Million Forecast, by Print Process 2020 & 2033
- Table 43: Global US Print Label Market Revenue Million Forecast, by Label Format 2020 & 2033
- Table 44: Global US Print Label Market Revenue Million Forecast, by End-user Industry 2020 & 2033
- Table 45: Global US Print Label Market Revenue Million Forecast, by Country 2020 & 2033
- Table 46: China US Print Label Market Revenue (Million) Forecast, by Application 2020 & 2033
- Table 47: India US Print Label Market Revenue (Million) Forecast, by Application 2020 & 2033
- Table 48: Japan US Print Label Market Revenue (Million) Forecast, by Application 2020 & 2033
- Table 49: South Korea US Print Label Market Revenue (Million) Forecast, by Application 2020 & 2033
- Table 50: ASEAN US Print Label Market Revenue (Million) Forecast, by Application 2020 & 2033
- Table 51: Oceania US Print Label Market Revenue (Million) Forecast, by Application 2020 & 2033
- Table 52: Rest of Asia Pacific US Print Label Market Revenue (Million) Forecast, by Application 2020 & 2033
Frequently Asked Questions
1. What is the projected Compound Annual Growth Rate (CAGR) of the US Print Label Market?
The projected CAGR is approximately 3.19%.
2. Which companies are prominent players in the US Print Label Market?
Key companies in the market include Fort Dearborn, R R Donnelley & Sons Company, Westrock Company, Cenveo Corporation, Mondi Group, Multi Color Corporation, Avery Dennison Corporation, Taylor Corporation*List Not Exhaustive, Ahlstrom-munksjö Oyj, Brady Corporation.
3. What are the main segments of the US Print Label Market?
The market segments include Print Process, Label Format, End-user Industry.
4. Can you provide details about the market size?
The market size is estimated to be USD 7.13 Million as of 2022.
5. What are some drivers contributing to market growth?
Growing Demand for Labels Manufactured with Digital Print Technologies; High Adoption From Healthcare and Cosmetics Segment.
6. What are the notable trends driving market growth?
Pressure-sensitive Labels Accounts for the Largest Market Share.
7. Are there any restraints impacting market growth?
Lack of Products with Ability to Withstand Harsh Climatic Conditions.
8. Can you provide examples of recent developments in the market?
March 2021 - Avery Dennison Corporation acquired JDC Solutions, Inc., a privately-held manufacturer of pressure-sensitive specialty tapes in Mount Juliet, Tennessee, at USD 24 million. JDC's manufacturing operations, workforce, and product portfolio will become part of Avery Dennison's Performance Tapes North America business.
9. What pricing options are available for accessing the report?
Pricing options include single-user, multi-user, and enterprise licenses priced at USD 3800, USD 4500, and USD 5800 respectively.
10. Is the market size provided in terms of value or volume?
The market size is provided in terms of value, measured in Million.
11. Are there any specific market keywords associated with the report?
Yes, the market keyword associated with the report is "US Print Label Market," which aids in identifying and referencing the specific market segment covered.
12. How do I determine which pricing option suits my needs best?
The pricing options vary based on user requirements and access needs. Individual users may opt for single-user licenses, while businesses requiring broader access may choose multi-user or enterprise licenses for cost-effective access to the report.
13. Are there any additional resources or data provided in the US Print Label Market report?
While the report offers comprehensive insights, it's advisable to review the specific contents or supplementary materials provided to ascertain if additional resources or data are available.
14. How can I stay updated on further developments or reports in the US Print Label Market?
To stay informed about further developments, trends, and reports in the US Print Label Market, consider subscribing to industry newsletters, following relevant companies and organizations, or regularly checking reputable industry news sources and publications.
Methodology
Step 1 - Identification of Relevant Samples Size from Population Database


Step 2 - Approaches for Defining Global Market Size (Value, Volume* & Price*)

Note*: In applicable scenarios
Step 3 - Data Sources
Primary Research
- Web Analytics
- Survey Reports
- Research Institute
- Latest Research Reports
- Opinion Leaders
Secondary Research
- Annual Reports
- White Paper
- Latest Press Release
- Industry Association
- Paid Database
- Investor Presentations

Step 4 - Data Triangulation
Involves using different sources of information in order to increase the validity of a study
These sources are likely to be stakeholders in a program - participants, other researchers, program staff, other community members, and so on.
Then we put all data in single framework & apply various statistical tools to find out the dynamic on the market.
During the analysis stage, feedback from the stakeholder groups would be compared to determine areas of agreement as well as areas of divergence