

Key Insights
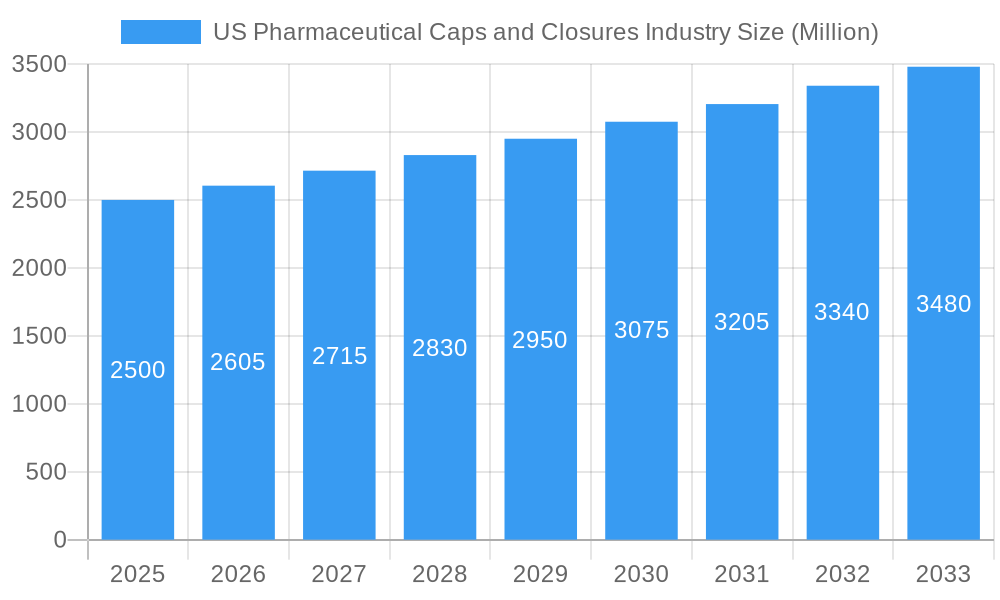
The US pharmaceutical caps and closures market, integral to drug packaging and safety, is poised for sustained expansion. Key growth drivers include escalating pharmaceutical demand, stringent regulatory mandates for product safety and tamper-evidence, and a growing preference for user-friendly packaging. Plastic materials dominate the market due to their cost-effectiveness and manufacturing versatility for diverse closure types. The pharmaceutical and healthcare sector is the primary end-user, underscoring the critical need for secure packaging to preserve drug efficacy and prevent contamination. Leading market participants include Aptar Group Inc., Amcor Plc, and Berry Global Inc., fostering innovation and competition. The market size is estimated at 13.3 billion in the base year 2025, with a projected CAGR of 4.6%. Continued growth through 2033 is anticipated, fueled by an aging global population's increasing pharmaceutical needs and advancements in packaging materials and technologies.
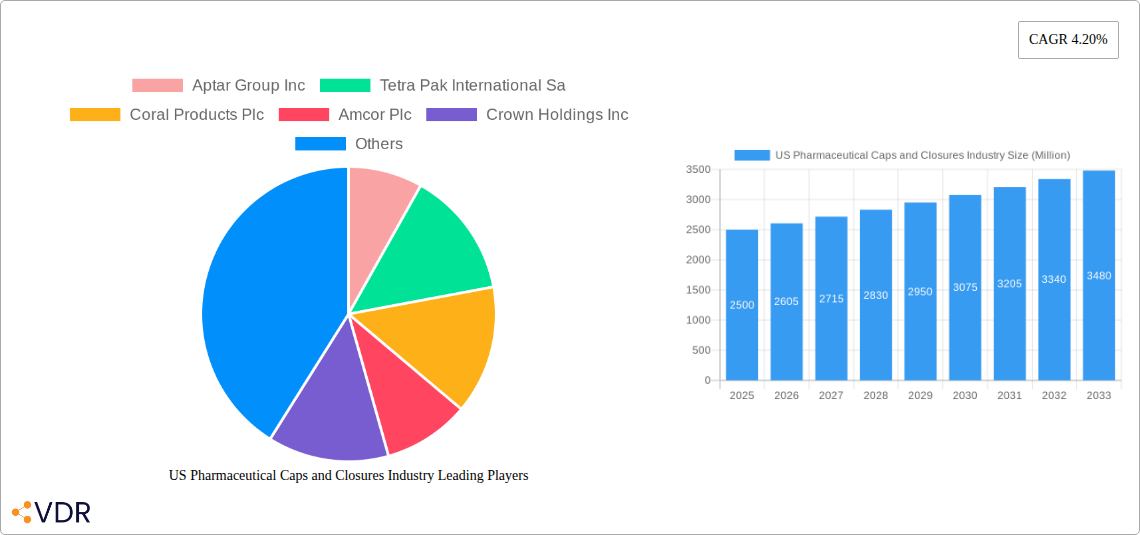
US Pharmaceutical Caps and Closures Industry Market Size (In Billion)
Intense market competition drives continuous innovation in advanced solutions such as child-resistant closures, tamper-evident seals, and sustainable packaging. Heightened regulatory oversight compels manufacturers to invest in high-quality, compliant solutions, thereby expanding the market while posing challenges for new entrants. Future growth will be shaped by technological advancements in closure design, the adoption of sustainable materials responding to eco-conscious demands, and evolving drug delivery systems. While detailed regional analysis is not specified, the US market exhibits a strong presence, with potential for nuanced growth patterns across its regions.
US Pharmaceutical Caps and Closures Industry Company Market Share
US Pharmaceutical Caps and Closures Industry Market Report: 2019-2033
This comprehensive report provides a detailed analysis of the US Pharmaceutical Caps and Closures industry, offering valuable insights for industry professionals, investors, and strategic planners. The study covers the period 2019-2033, with a focus on the forecast period 2025-2033 and a base year of 2025. Market values are presented in million units.
US Pharmaceutical Caps and Closures Industry Market Dynamics & Structure
This section analyzes the competitive landscape, technological advancements, regulatory environment, and market trends within the US pharmaceutical caps and closures industry. The market is characterized by a moderately consolidated structure with several key players holding significant market share. Technological innovation, driven by the need for enhanced tamper evidence, improved barrier properties, and sustainable materials, is a key driver. Stringent regulatory frameworks, including FDA guidelines, significantly impact product development and manufacturing processes. The industry faces competition from substitute materials and packaging solutions, while mergers and acquisitions (M&A) activity reshape the competitive landscape.
- Market Concentration: The top 5 players hold approximately xx% of the market share in 2025.
- Technological Innovation: Focus on sustainable materials (e.g., bioplastics) and advanced closure technologies (e.g., induction sealing).
- Regulatory Framework: Stringent FDA regulations impacting material selection, labeling, and safety.
- M&A Activity: xx M&A deals observed between 2019-2024, indicating consolidation trends. Increased focus on acquisitions expected to enhance product portfolio and market reach.
- Competitive Substitutes: Growing competition from alternative packaging solutions with similar functionalities.
US Pharmaceutical Caps and Closures Industry Growth Trends & Insights
The US pharmaceutical caps and closures market experienced robust growth during the historical period (2019-2024), driven by factors such as the rising pharmaceutical production, increasing demand for tamper-evident closures, and growth in the healthcare sector. The market is projected to continue its expansion throughout the forecast period (2025-2033), exhibiting a CAGR of xx%. Technological advancements, including the adoption of smart packaging and sustainable materials, are further stimulating market growth. Changes in consumer preferences towards convenient and safe packaging also contribute to market expansion.
- Market Size (2025): xx Million Units
- CAGR (2025-2033): xx%
- Market Penetration of Sustainable Materials (2025): xx%
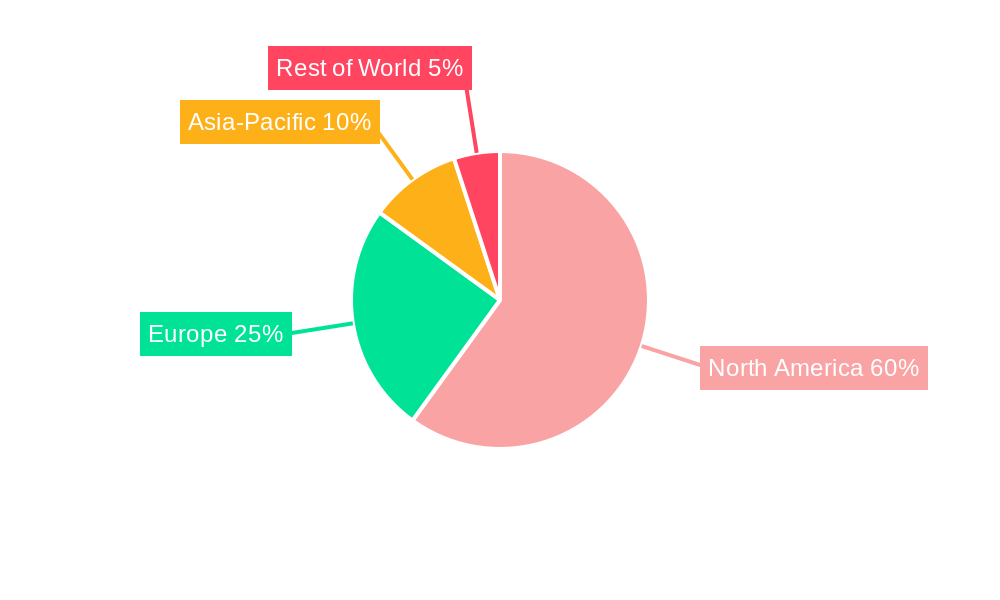
Dominant Regions, Countries, or Segments in US Pharmaceutical Caps and Closures Industry
The pharmaceutical caps and closures market in the US is geographically diverse, with growth varying across regions. Within the material segments, plastic continues to dominate, driven by its cost-effectiveness and versatility. However, the demand for sustainable alternatives is gradually increasing. The pharmaceutical and healthcare end-user segment is the largest contributor to overall market revenue, driven by the rising demand for pharmaceutical products.
- Dominant Segment: Pharmaceutical and Healthcare (by End-User Industry) accounts for approximately xx% of the total market in 2025.
- Dominant Material: Plastic (by Material Type) dominates due to its cost-effectiveness and ease of processing.
- Key Regional Drivers: Growth is primarily driven by states with high pharmaceutical manufacturing and healthcare activities, leading to strong regional variations.
US Pharmaceutical Caps and Closures Industry Product Landscape
The US pharmaceutical caps and closures market offers a wide range of products, including plastic caps, metal closures, and specialized closures with features such as tamper evidence and child-resistance. Continuous innovation focuses on improving barrier properties, enhancing sustainability, and incorporating smart packaging technologies. Unique selling propositions include improved sealing performance, enhanced convenience, and enhanced security features.
Key Drivers, Barriers & Challenges in US Pharmaceutical Caps and Closures Industry
Key Drivers: Increasing pharmaceutical production, stringent regulatory requirements mandating tamper-evident closures, and rising demand for sustainable packaging solutions are key drivers.
Key Challenges: Supply chain disruptions, fluctuating raw material prices, and increasing competition from substitute packaging materials pose significant challenges. The impact of these challenges is estimated to result in a xx% reduction in projected growth in 2027.
Emerging Opportunities in US Pharmaceutical Caps and Closures Industry
Emerging opportunities include the growth of smart packaging solutions, increased demand for sustainable and eco-friendly materials, and expansion into niche markets such as personalized medicine packaging. Furthermore, the integration of advanced technologies, such as RFID and sensor integration, presents significant growth potential.
Growth Accelerators in the US Pharmaceutical Caps and Closures Industry
Technological advancements, strategic partnerships, and increasing focus on sustainable packaging solutions are key accelerators for long-term growth in this sector. The adoption of Industry 4.0 technologies enhances manufacturing efficiency and quality control.
Key Players Shaping the US Pharmaceutical Caps and Closures Industry Market
- Aptar Group Inc
- Tetra Pak International SA
- Coral Products Plc
- Amcor Plc
- Crown Holdings Inc
- O Berk Company Llc
- Bericap Holdings
- Silgan Closures
- MJS Packaging
- Albéa S.A
- Berry Global Inc
- Closure Systems International
Notable Milestones in US Pharmaceutical Caps and Closures Industry Sector
- 2020: Increased adoption of tamper-evident closures driven by regulatory changes.
- 2022: Launch of several sustainable packaging solutions by major players.
- 2023: Significant M&A activity consolidating market share among key players.
In-Depth US Pharmaceutical Caps and Closures Industry Market Outlook
The US pharmaceutical caps and closures market is poised for continued growth, driven by robust demand from the pharmaceutical industry, increasing focus on patient safety, and the adoption of innovative packaging solutions. Strategic partnerships, investments in R&D, and expansion into emerging markets will further shape the industry's future. The market's long-term potential is substantial, offering significant opportunities for growth and innovation.
US Pharmaceutical Caps and Closures Industry Segmentation
-
1. Material Type
-
1.1. Plastic
- 1.1.1. PET
- 1.1.2. PP
- 1.1.3. HDPE and LDPE
- 1.1.4. Other Plastics
- 1.2. Metal
- 1.3. Other Material Types
-
1.1. Plastic
-
2. End-User Industry
- 2.1. Beverage
- 2.2. Food
- 2.3. Pharmaceutical and Healthcare
- 2.4. Cosmetics and Toiletries
- 2.5. Other En
US Pharmaceutical Caps and Closures Industry Segmentation By Geography
-
1. North America
- 1.1. United States
- 1.2. Canada
- 1.3. Mexico
-
2. South America
- 2.1. Brazil
- 2.2. Argentina
- 2.3. Rest of South America
-
3. Europe
- 3.1. United Kingdom
- 3.2. Germany
- 3.3. France
- 3.4. Italy
- 3.5. Spain
- 3.6. Russia
- 3.7. Benelux
- 3.8. Nordics
- 3.9. Rest of Europe
-
4. Middle East & Africa
- 4.1. Turkey
- 4.2. Israel
- 4.3. GCC
- 4.4. North Africa
- 4.5. South Africa
- 4.6. Rest of Middle East & Africa
-
5. Asia Pacific
- 5.1. China
- 5.2. India
- 5.3. Japan
- 5.4. South Korea
- 5.5. ASEAN
- 5.6. Oceania
- 5.7. Rest of Asia Pacific
US Pharmaceutical Caps and Closures Industry Regional Market Share
Geographic Coverage of US Pharmaceutical Caps and Closures Industry
US Pharmaceutical Caps and Closures Industry REPORT HIGHLIGHTS
| Aspects | Details |
|---|---|
| Study Period | 2020-2034 |
| Base Year | 2025 |
| Estimated Year | 2026 |
| Forecast Period | 2026-2034 |
| Historical Period | 2020-2025 |
| Growth Rate | CAGR of 4.6% from 2020-2034 |
| Segmentation |
|
Table of Contents
- 1. Introduction
- 1.1. Research Scope
- 1.2. Market Segmentation
- 1.3. Research Objective
- 1.4. Definitions and Assumptions
- 2. Executive Summary
- 2.1. Market Snapshot
- 3. Market Dynamics
- 3.1. Market Drivers
- 3.2. Market Restrains
- 3.3. Market Trends
- 3.4. Market Opportunities
- 4. Market Factor Analysis
- 4.1. Porters Five Forces
- 4.1.1. Bargaining Power of Suppliers
- 4.1.2. Bargaining Power of Buyers
- 4.1.3. Threat of New Entrants
- 4.1.4. Threat of Substitutes
- 4.1.5. Competitive Rivalry
- 4.2. PESTEL analysis
- 4.3. BCG Analysis
- 4.3.1. Stars (High Growth, High Market Share)
- 4.3.2. Cash Cows (Low Growth, High Market Share)
- 4.3.3. Question Mark (High Growth, Low Market Share)
- 4.3.4. Dogs (Low Growth, Low Market Share)
- 4.4. Ansoff Matrix Analysis
- 4.5. Supply Chain Analysis
- 4.6. Regulatory Landscape
- 4.7. Current Market Potential and Opportunity Assessment (TAM–SAM–SOM Framework)
- 4.8. VDR Analyst Note
- 4.1. Porters Five Forces
- 5. Market Analysis, Insights and Forecast 2021-2033
- 5.1. Market Analysis, Insights and Forecast - by Material Type
- 5.1.1. Plastic
- 5.1.1.1. PET
- 5.1.1.2. PP
- 5.1.1.3. HDPE and LDPE
- 5.1.1.4. Other Plastics
- 5.1.2. Metal
- 5.1.3. Other Material Types
- 5.1.1. Plastic
- 5.2. Market Analysis, Insights and Forecast - by End-User Industry
- 5.2.1. Beverage
- 5.2.2. Food
- 5.2.3. Pharmaceutical and Healthcare
- 5.2.4. Cosmetics and Toiletries
- 5.2.5. Other En
- 5.3. Market Analysis, Insights and Forecast - by Region
- 5.3.1. North America
- 5.3.2. South America
- 5.3.3. Europe
- 5.3.4. Middle East & Africa
- 5.3.5. Asia Pacific
- 5.1. Market Analysis, Insights and Forecast - by Material Type
- 6. Global US Pharmaceutical Caps and Closures Industry Analysis, Insights and Forecast, 2021-2033
- 6.1. Market Analysis, Insights and Forecast - by Material Type
- 6.1.1. Plastic
- 6.1.1.1. PET
- 6.1.1.2. PP
- 6.1.1.3. HDPE and LDPE
- 6.1.1.4. Other Plastics
- 6.1.2. Metal
- 6.1.3. Other Material Types
- 6.1.1. Plastic
- 6.2. Market Analysis, Insights and Forecast - by End-User Industry
- 6.2.1. Beverage
- 6.2.2. Food
- 6.2.3. Pharmaceutical and Healthcare
- 6.2.4. Cosmetics and Toiletries
- 6.2.5. Other En
- 6.1. Market Analysis, Insights and Forecast - by Material Type
- 7. North America US Pharmaceutical Caps and Closures Industry Analysis, Insights and Forecast, 2021-2033
- 7.1. Market Analysis, Insights and Forecast - by Material Type
- 7.1.1. Plastic
- 7.1.1.1. PET
- 7.1.1.2. PP
- 7.1.1.3. HDPE and LDPE
- 7.1.1.4. Other Plastics
- 7.1.2. Metal
- 7.1.3. Other Material Types
- 7.1.1. Plastic
- 7.2. Market Analysis, Insights and Forecast - by End-User Industry
- 7.2.1. Beverage
- 7.2.2. Food
- 7.2.3. Pharmaceutical and Healthcare
- 7.2.4. Cosmetics and Toiletries
- 7.2.5. Other En
- 7.1. Market Analysis, Insights and Forecast - by Material Type
- 8. South America US Pharmaceutical Caps and Closures Industry Analysis, Insights and Forecast, 2021-2033
- 8.1. Market Analysis, Insights and Forecast - by Material Type
- 8.1.1. Plastic
- 8.1.1.1. PET
- 8.1.1.2. PP
- 8.1.1.3. HDPE and LDPE
- 8.1.1.4. Other Plastics
- 8.1.2. Metal
- 8.1.3. Other Material Types
- 8.1.1. Plastic
- 8.2. Market Analysis, Insights and Forecast - by End-User Industry
- 8.2.1. Beverage
- 8.2.2. Food
- 8.2.3. Pharmaceutical and Healthcare
- 8.2.4. Cosmetics and Toiletries
- 8.2.5. Other En
- 8.1. Market Analysis, Insights and Forecast - by Material Type
- 9. Europe US Pharmaceutical Caps and Closures Industry Analysis, Insights and Forecast, 2021-2033
- 9.1. Market Analysis, Insights and Forecast - by Material Type
- 9.1.1. Plastic
- 9.1.1.1. PET
- 9.1.1.2. PP
- 9.1.1.3. HDPE and LDPE
- 9.1.1.4. Other Plastics
- 9.1.2. Metal
- 9.1.3. Other Material Types
- 9.1.1. Plastic
- 9.2. Market Analysis, Insights and Forecast - by End-User Industry
- 9.2.1. Beverage
- 9.2.2. Food
- 9.2.3. Pharmaceutical and Healthcare
- 9.2.4. Cosmetics and Toiletries
- 9.2.5. Other En
- 9.1. Market Analysis, Insights and Forecast - by Material Type
- 10. Middle East & Africa US Pharmaceutical Caps and Closures Industry Analysis, Insights and Forecast, 2021-2033
- 10.1. Market Analysis, Insights and Forecast - by Material Type
- 10.1.1. Plastic
- 10.1.1.1. PET
- 10.1.1.2. PP
- 10.1.1.3. HDPE and LDPE
- 10.1.1.4. Other Plastics
- 10.1.2. Metal
- 10.1.3. Other Material Types
- 10.1.1. Plastic
- 10.2. Market Analysis, Insights and Forecast - by End-User Industry
- 10.2.1. Beverage
- 10.2.2. Food
- 10.2.3. Pharmaceutical and Healthcare
- 10.2.4. Cosmetics and Toiletries
- 10.2.5. Other En
- 10.1. Market Analysis, Insights and Forecast - by Material Type
- 11. Asia Pacific US Pharmaceutical Caps and Closures Industry Analysis, Insights and Forecast, 2021-2033
- 11.1. Market Analysis, Insights and Forecast - by Material Type
- 11.1.1. Plastic
- 11.1.1.1. PET
- 11.1.1.2. PP
- 11.1.1.3. HDPE and LDPE
- 11.1.1.4. Other Plastics
- 11.1.2. Metal
- 11.1.3. Other Material Types
- 11.1.1. Plastic
- 11.2. Market Analysis, Insights and Forecast - by End-User Industry
- 11.2.1. Beverage
- 11.2.2. Food
- 11.2.3. Pharmaceutical and Healthcare
- 11.2.4. Cosmetics and Toiletries
- 11.2.5. Other En
- 11.1. Market Analysis, Insights and Forecast - by Material Type
- 12. Competitive Analysis
- 12.1. Company Profiles
- 12.1.1 Aptar Group Inc
- 12.1.1.1. Company Overview
- 12.1.1.2. Products
- 12.1.1.3. Company Financials
- 12.1.1.4. SWOT Analysis
- 12.1.2 Tetra Pak International Sa
- 12.1.2.1. Company Overview
- 12.1.2.2. Products
- 12.1.2.3. Company Financials
- 12.1.2.4. SWOT Analysis
- 12.1.3 Coral Products Plc
- 12.1.3.1. Company Overview
- 12.1.3.2. Products
- 12.1.3.3. Company Financials
- 12.1.3.4. SWOT Analysis
- 12.1.4 Amcor Plc
- 12.1.4.1. Company Overview
- 12.1.4.2. Products
- 12.1.4.3. Company Financials
- 12.1.4.4. SWOT Analysis
- 12.1.5 Crown Holdings Inc
- 12.1.5.1. Company Overview
- 12.1.5.2. Products
- 12.1.5.3. Company Financials
- 12.1.5.4. SWOT Analysis
- 12.1.6 O Berk Company Llc*List Not Exhaustive
- 12.1.6.1. Company Overview
- 12.1.6.2. Products
- 12.1.6.3. Company Financials
- 12.1.6.4. SWOT Analysis
- 12.1.7 Bericap Holdings
- 12.1.7.1. Company Overview
- 12.1.7.2. Products
- 12.1.7.3. Company Financials
- 12.1.7.4. SWOT Analysis
- 12.1.8 Silgan Closures
- 12.1.8.1. Company Overview
- 12.1.8.2. Products
- 12.1.8.3. Company Financials
- 12.1.8.4. SWOT Analysis
- 12.1.9 Mjs Packaging
- 12.1.9.1. Company Overview
- 12.1.9.2. Products
- 12.1.9.3. Company Financials
- 12.1.9.4. SWOT Analysis
- 12.1.10 Albéa S A
- 12.1.10.1. Company Overview
- 12.1.10.2. Products
- 12.1.10.3. Company Financials
- 12.1.10.4. SWOT Analysis
- 12.1.11 Berry Global Inc
- 12.1.11.1. Company Overview
- 12.1.11.2. Products
- 12.1.11.3. Company Financials
- 12.1.11.4. SWOT Analysis
- 12.1.12 Closure Systems International
- 12.1.12.1. Company Overview
- 12.1.12.2. Products
- 12.1.12.3. Company Financials
- 12.1.12.4. SWOT Analysis
- 12.1.1 Aptar Group Inc
- 12.2. Market Entropy
- 12.2.1 Company's Key Areas Served
- 12.2.2 Recent Developments
- 12.3. Company Market Share Analysis 2025
- 12.3.1 Top 5 Companies Market Share Analysis
- 12.3.2 Top 3 Companies Market Share Analysis
- 12.4. List of Potential Customers
- 13. Research Methodology
List of Figures
- Figure 1: Global US Pharmaceutical Caps and Closures Industry Revenue Breakdown (billion, %) by Region 2025 & 2033
- Figure 2: North America US Pharmaceutical Caps and Closures Industry Revenue (billion), by Material Type 2025 & 2033
- Figure 3: North America US Pharmaceutical Caps and Closures Industry Revenue Share (%), by Material Type 2025 & 2033
- Figure 4: North America US Pharmaceutical Caps and Closures Industry Revenue (billion), by End-User Industry 2025 & 2033
- Figure 5: North America US Pharmaceutical Caps and Closures Industry Revenue Share (%), by End-User Industry 2025 & 2033
- Figure 6: North America US Pharmaceutical Caps and Closures Industry Revenue (billion), by Country 2025 & 2033
- Figure 7: North America US Pharmaceutical Caps and Closures Industry Revenue Share (%), by Country 2025 & 2033
- Figure 8: South America US Pharmaceutical Caps and Closures Industry Revenue (billion), by Material Type 2025 & 2033
- Figure 9: South America US Pharmaceutical Caps and Closures Industry Revenue Share (%), by Material Type 2025 & 2033
- Figure 10: South America US Pharmaceutical Caps and Closures Industry Revenue (billion), by End-User Industry 2025 & 2033
- Figure 11: South America US Pharmaceutical Caps and Closures Industry Revenue Share (%), by End-User Industry 2025 & 2033
- Figure 12: South America US Pharmaceutical Caps and Closures Industry Revenue (billion), by Country 2025 & 2033
- Figure 13: South America US Pharmaceutical Caps and Closures Industry Revenue Share (%), by Country 2025 & 2033
- Figure 14: Europe US Pharmaceutical Caps and Closures Industry Revenue (billion), by Material Type 2025 & 2033
- Figure 15: Europe US Pharmaceutical Caps and Closures Industry Revenue Share (%), by Material Type 2025 & 2033
- Figure 16: Europe US Pharmaceutical Caps and Closures Industry Revenue (billion), by End-User Industry 2025 & 2033
- Figure 17: Europe US Pharmaceutical Caps and Closures Industry Revenue Share (%), by End-User Industry 2025 & 2033
- Figure 18: Europe US Pharmaceutical Caps and Closures Industry Revenue (billion), by Country 2025 & 2033
- Figure 19: Europe US Pharmaceutical Caps and Closures Industry Revenue Share (%), by Country 2025 & 2033
- Figure 20: Middle East & Africa US Pharmaceutical Caps and Closures Industry Revenue (billion), by Material Type 2025 & 2033
- Figure 21: Middle East & Africa US Pharmaceutical Caps and Closures Industry Revenue Share (%), by Material Type 2025 & 2033
- Figure 22: Middle East & Africa US Pharmaceutical Caps and Closures Industry Revenue (billion), by End-User Industry 2025 & 2033
- Figure 23: Middle East & Africa US Pharmaceutical Caps and Closures Industry Revenue Share (%), by End-User Industry 2025 & 2033
- Figure 24: Middle East & Africa US Pharmaceutical Caps and Closures Industry Revenue (billion), by Country 2025 & 2033
- Figure 25: Middle East & Africa US Pharmaceutical Caps and Closures Industry Revenue Share (%), by Country 2025 & 2033
- Figure 26: Asia Pacific US Pharmaceutical Caps and Closures Industry Revenue (billion), by Material Type 2025 & 2033
- Figure 27: Asia Pacific US Pharmaceutical Caps and Closures Industry Revenue Share (%), by Material Type 2025 & 2033
- Figure 28: Asia Pacific US Pharmaceutical Caps and Closures Industry Revenue (billion), by End-User Industry 2025 & 2033
- Figure 29: Asia Pacific US Pharmaceutical Caps and Closures Industry Revenue Share (%), by End-User Industry 2025 & 2033
- Figure 30: Asia Pacific US Pharmaceutical Caps and Closures Industry Revenue (billion), by Country 2025 & 2033
- Figure 31: Asia Pacific US Pharmaceutical Caps and Closures Industry Revenue Share (%), by Country 2025 & 2033
List of Tables
- Table 1: Global US Pharmaceutical Caps and Closures Industry Revenue billion Forecast, by Material Type 2020 & 2033
- Table 2: Global US Pharmaceutical Caps and Closures Industry Revenue billion Forecast, by End-User Industry 2020 & 2033
- Table 3: Global US Pharmaceutical Caps and Closures Industry Revenue billion Forecast, by Region 2020 & 2033
- Table 4: Global US Pharmaceutical Caps and Closures Industry Revenue billion Forecast, by Material Type 2020 & 2033
- Table 5: Global US Pharmaceutical Caps and Closures Industry Revenue billion Forecast, by End-User Industry 2020 & 2033
- Table 6: Global US Pharmaceutical Caps and Closures Industry Revenue billion Forecast, by Country 2020 & 2033
- Table 7: United States US Pharmaceutical Caps and Closures Industry Revenue (billion) Forecast, by Application 2020 & 2033
- Table 8: Canada US Pharmaceutical Caps and Closures Industry Revenue (billion) Forecast, by Application 2020 & 2033
- Table 9: Mexico US Pharmaceutical Caps and Closures Industry Revenue (billion) Forecast, by Application 2020 & 2033
- Table 10: Global US Pharmaceutical Caps and Closures Industry Revenue billion Forecast, by Material Type 2020 & 2033
- Table 11: Global US Pharmaceutical Caps and Closures Industry Revenue billion Forecast, by End-User Industry 2020 & 2033
- Table 12: Global US Pharmaceutical Caps and Closures Industry Revenue billion Forecast, by Country 2020 & 2033
- Table 13: Brazil US Pharmaceutical Caps and Closures Industry Revenue (billion) Forecast, by Application 2020 & 2033
- Table 14: Argentina US Pharmaceutical Caps and Closures Industry Revenue (billion) Forecast, by Application 2020 & 2033
- Table 15: Rest of South America US Pharmaceutical Caps and Closures Industry Revenue (billion) Forecast, by Application 2020 & 2033
- Table 16: Global US Pharmaceutical Caps and Closures Industry Revenue billion Forecast, by Material Type 2020 & 2033
- Table 17: Global US Pharmaceutical Caps and Closures Industry Revenue billion Forecast, by End-User Industry 2020 & 2033
- Table 18: Global US Pharmaceutical Caps and Closures Industry Revenue billion Forecast, by Country 2020 & 2033
- Table 19: United Kingdom US Pharmaceutical Caps and Closures Industry Revenue (billion) Forecast, by Application 2020 & 2033
- Table 20: Germany US Pharmaceutical Caps and Closures Industry Revenue (billion) Forecast, by Application 2020 & 2033
- Table 21: France US Pharmaceutical Caps and Closures Industry Revenue (billion) Forecast, by Application 2020 & 2033
- Table 22: Italy US Pharmaceutical Caps and Closures Industry Revenue (billion) Forecast, by Application 2020 & 2033
- Table 23: Spain US Pharmaceutical Caps and Closures Industry Revenue (billion) Forecast, by Application 2020 & 2033
- Table 24: Russia US Pharmaceutical Caps and Closures Industry Revenue (billion) Forecast, by Application 2020 & 2033
- Table 25: Benelux US Pharmaceutical Caps and Closures Industry Revenue (billion) Forecast, by Application 2020 & 2033
- Table 26: Nordics US Pharmaceutical Caps and Closures Industry Revenue (billion) Forecast, by Application 2020 & 2033
- Table 27: Rest of Europe US Pharmaceutical Caps and Closures Industry Revenue (billion) Forecast, by Application 2020 & 2033
- Table 28: Global US Pharmaceutical Caps and Closures Industry Revenue billion Forecast, by Material Type 2020 & 2033
- Table 29: Global US Pharmaceutical Caps and Closures Industry Revenue billion Forecast, by End-User Industry 2020 & 2033
- Table 30: Global US Pharmaceutical Caps and Closures Industry Revenue billion Forecast, by Country 2020 & 2033
- Table 31: Turkey US Pharmaceutical Caps and Closures Industry Revenue (billion) Forecast, by Application 2020 & 2033
- Table 32: Israel US Pharmaceutical Caps and Closures Industry Revenue (billion) Forecast, by Application 2020 & 2033
- Table 33: GCC US Pharmaceutical Caps and Closures Industry Revenue (billion) Forecast, by Application 2020 & 2033
- Table 34: North Africa US Pharmaceutical Caps and Closures Industry Revenue (billion) Forecast, by Application 2020 & 2033
- Table 35: South Africa US Pharmaceutical Caps and Closures Industry Revenue (billion) Forecast, by Application 2020 & 2033
- Table 36: Rest of Middle East & Africa US Pharmaceutical Caps and Closures Industry Revenue (billion) Forecast, by Application 2020 & 2033
- Table 37: Global US Pharmaceutical Caps and Closures Industry Revenue billion Forecast, by Material Type 2020 & 2033
- Table 38: Global US Pharmaceutical Caps and Closures Industry Revenue billion Forecast, by End-User Industry 2020 & 2033
- Table 39: Global US Pharmaceutical Caps and Closures Industry Revenue billion Forecast, by Country 2020 & 2033
- Table 40: China US Pharmaceutical Caps and Closures Industry Revenue (billion) Forecast, by Application 2020 & 2033
- Table 41: India US Pharmaceutical Caps and Closures Industry Revenue (billion) Forecast, by Application 2020 & 2033
- Table 42: Japan US Pharmaceutical Caps and Closures Industry Revenue (billion) Forecast, by Application 2020 & 2033
- Table 43: South Korea US Pharmaceutical Caps and Closures Industry Revenue (billion) Forecast, by Application 2020 & 2033
- Table 44: ASEAN US Pharmaceutical Caps and Closures Industry Revenue (billion) Forecast, by Application 2020 & 2033
- Table 45: Oceania US Pharmaceutical Caps and Closures Industry Revenue (billion) Forecast, by Application 2020 & 2033
- Table 46: Rest of Asia Pacific US Pharmaceutical Caps and Closures Industry Revenue (billion) Forecast, by Application 2020 & 2033
Frequently Asked Questions
1. What is the projected Compound Annual Growth Rate (CAGR) of the US Pharmaceutical Caps and Closures Industry?
The projected CAGR is approximately 4.6%.
2. Which companies are prominent players in the US Pharmaceutical Caps and Closures Industry?
Key companies in the market include Aptar Group Inc, Tetra Pak International Sa, Coral Products Plc, Amcor Plc, Crown Holdings Inc, O Berk Company Llc*List Not Exhaustive, Bericap Holdings, Silgan Closures, Mjs Packaging, Albéa S A, Berry Global Inc, Closure Systems International.
3. What are the main segments of the US Pharmaceutical Caps and Closures Industry?
The market segments include Material Type, End-User Industry.
4. Can you provide details about the market size?
The market size is estimated to be USD 13.3 billion as of 2022.
5. What are some drivers contributing to market growth?
; The Increased Demand for Innovative Solutions from Different End Users..
6. What are the notable trends driving market growth?
Plastic to Witness a Highest Growth.
7. Are there any restraints impacting market growth?
; Stringent Regulation on Manufacturers Pertaining to Environmental Degradation.
8. Can you provide examples of recent developments in the market?
N/A
9. What pricing options are available for accessing the report?
Pricing options include single-user, multi-user, and enterprise licenses priced at USD 3800, USD 4500, and USD 5800 respectively.
10. Is the market size provided in terms of value or volume?
The market size is provided in terms of value, measured in billion.
11. Are there any specific market keywords associated with the report?
Yes, the market keyword associated with the report is "US Pharmaceutical Caps and Closures Industry," which aids in identifying and referencing the specific market segment covered.
12. How do I determine which pricing option suits my needs best?
The pricing options vary based on user requirements and access needs. Individual users may opt for single-user licenses, while businesses requiring broader access may choose multi-user or enterprise licenses for cost-effective access to the report.
13. Are there any additional resources or data provided in the US Pharmaceutical Caps and Closures Industry report?
While the report offers comprehensive insights, it's advisable to review the specific contents or supplementary materials provided to ascertain if additional resources or data are available.
14. How can I stay updated on further developments or reports in the US Pharmaceutical Caps and Closures Industry?
To stay informed about further developments, trends, and reports in the US Pharmaceutical Caps and Closures Industry, consider subscribing to industry newsletters, following relevant companies and organizations, or regularly checking reputable industry news sources and publications.
Methodology
Step 1 - Identification of Relevant Samples Size from Population Database


Step 2 - Approaches for Defining Global Market Size (Value, Volume* & Price*)

Note*: In applicable scenarios
Step 3 - Data Sources
Primary Research
- Web Analytics
- Survey Reports
- Research Institute
- Latest Research Reports
- Opinion Leaders
Secondary Research
- Annual Reports
- White Paper
- Latest Press Release
- Industry Association
- Paid Database
- Investor Presentations

Step 4 - Data Triangulation
Involves using different sources of information in order to increase the validity of a study
These sources are likely to be stakeholders in a program - participants, other researchers, program staff, other community members, and so on.
Then we put all data in single framework & apply various statistical tools to find out the dynamic on the market.
During the analysis stage, feedback from the stakeholder groups would be compared to determine areas of agreement as well as areas of divergence