

Key Insights
The US payment cards market is experiencing significant expansion, driven by escalating digital payment adoption and robust e-commerce growth. The market is projected to reach $6.48 billion by 2025, with a Compound Annual Growth Rate (CAGR) of 16.13% during the forecast period. Key growth catalysts include the increasing preference for contactless transactions, widespread smartphone penetration, and demand for secure, convenient online payment solutions.
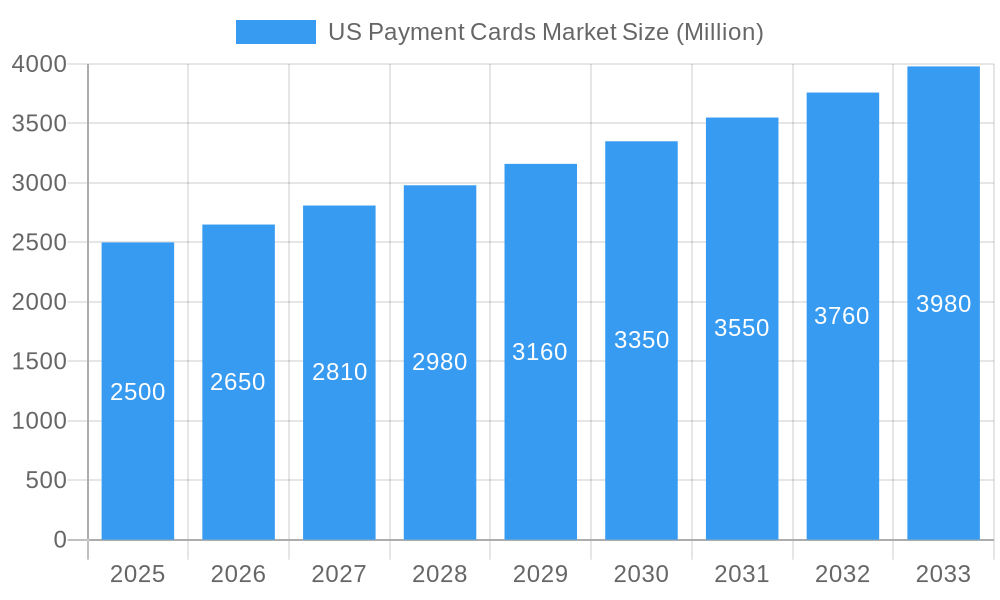
US Payment Cards Market Market Size (In Billion)
The market is segmented by product type, including B2B virtual cards, B2C remote payment virtual cards, and B2C POS virtual cards, and by end-user, such as consumer and business use. The B2C segment is anticipated to lead market share due to rising consumer spending and the proliferation of online retail platforms. Concurrently, the business-use segment is demonstrating strong growth, driven by the need for efficient expense management and streamlined payment processes.
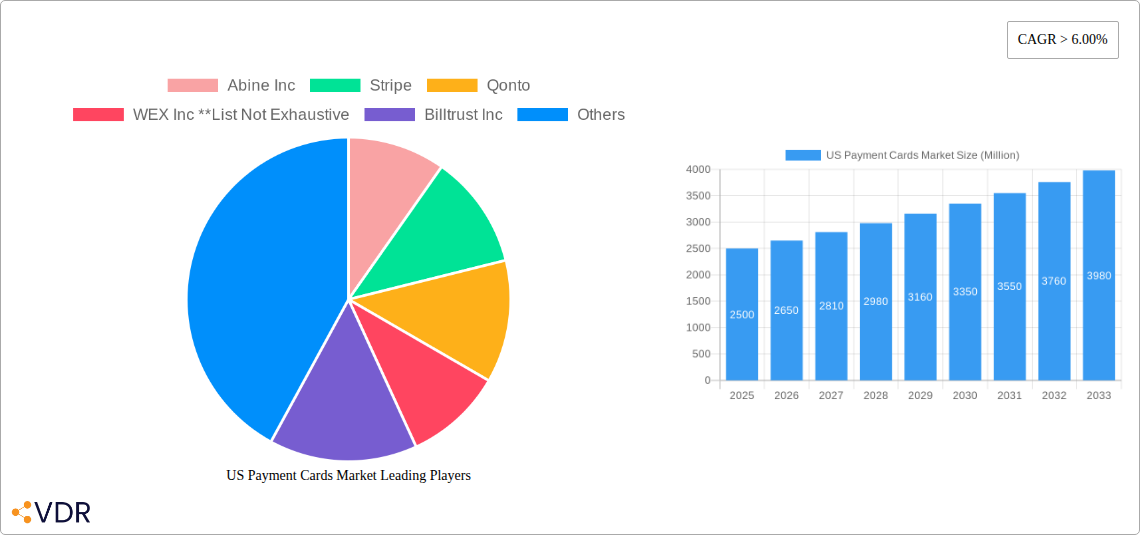
US Payment Cards Market Company Market Share
Leading players, including Visa, Mastercard, and American Express, alongside emerging fintech innovators, are engaged in intense competition, fostering innovation and the introduction of advanced payment technologies. The North American region, particularly the United States, holds a substantial market share, reflecting high financial inclusion and technological advancement.
The forecast period (2025-2033) anticipates sustained market growth, potentially moderating slightly due to market saturation and increased regulatory scrutiny. However, the long-term outlook remains positive, propelled by evolving payment technologies, expanding digital financial services, and the increasing adoption of virtual and contactless cards across diverse demographics. Future market expansion will likely be shaped by integrated advanced security features, the rise of buy-now-pay-later (BNPL) options, and the increasing adoption of embedded finance solutions. The competitive landscape is expected to remain dynamic, with established players and innovative fintechs vying for market share through strategic alliances, technological advancements, and market expansion.
This comprehensive report offers an in-depth analysis of the US Payment Cards Market, covering market dynamics, growth trends, key players, and the future outlook. The study spans from 2019 to 2033, with 2025 serving as the base and estimated year. The market is segmented by product type (B2B Virtual Cards, B2C Remote Payment Virtual Cards, B2C POS Virtual Cards) and end-user (Consumer Use, Business Use), providing granular insights into this dynamic sector. The market size is presented in billions of dollars.
US Payment Cards Market Market Dynamics & Structure
The US payment cards market is characterized by intense competition, rapid technological innovation, and evolving regulatory landscapes. Market concentration is relatively high, with a few major players holding significant market share. However, the emergence of fintech companies and the increasing adoption of digital payment solutions are fostering a more fragmented landscape. Technological advancements, such as contactless payments, mobile wallets, and embedded finance, are key drivers of market growth. Regulatory frameworks, including data privacy regulations and anti-money laundering (AML) compliance, significantly influence market operations. The market also faces competition from alternative payment methods, such as buy now, pay later (BNPL) services and cryptocurrency transactions. Mergers and acquisitions (M&A) activity is frequent, with established players seeking to expand their market reach and acquire innovative technologies.
- Market Concentration: High, with top 5 players holding approximately xx% of market share in 2024.
- Technological Innovation: Strong driver, fueled by advancements in mobile payments, AI, and blockchain technology.
- Regulatory Framework: Significant impact, particularly concerning data security and compliance.
- Competitive Substitutes: BNPL services, cryptocurrency, and other digital payment methods pose a competitive threat.
- M&A Activity: High volume in recent years, indicating consolidation and expansion strategies. xx M&A deals recorded in 2024.
- End-User Demographics: Shifting towards younger demographics adopting digital-first payment methods.
US Payment Cards Market Growth Trends & Insights
The US payment cards market has experienced significant growth over the historical period (2019-2024), driven by factors such as increasing consumer spending, rising e-commerce adoption, and the proliferation of mobile payment solutions. The market size is projected to reach xx million units in 2025 and is expected to grow at a Compound Annual Growth Rate (CAGR) of xx% during the forecast period (2025-2033). This growth is primarily attributed to the increasing penetration of digital payments, particularly among younger demographics. Technological disruptions, such as the rise of contactless payments and the integration of payment solutions into various platforms, further fuel market expansion. Consumer behavior shifts towards convenience and digitalization are also significant drivers. Market penetration of virtual cards is expected to increase significantly by xx% by 2033.
Dominant Regions, Countries, or Segments in US Payment Cards Market
The dominant segment within the US payment cards market is currently the B2C Remote Payment Virtual Cards segment, driven by the increasing popularity of online shopping and digital transactions. The business use segment within the end-user category also holds significant market share due to the growing adoption of virtual cards for B2B payments. California and New York are the leading states in terms of market size, due to high population density and strong economic activity. Key drivers for these segments include robust e-commerce infrastructure, a high density of tech-savvy consumers, and supportive regulatory environments.
- B2C Remote Payment Virtual Cards: High growth driven by e-commerce expansion and mobile payment adoption.
- Business Use: Significant growth fueled by increased efficiency and cost savings in B2B transactions.
- California and New York: Leading states due to high population density and strong economic activity.
- Key Drivers: E-commerce infrastructure, tech-savvy consumers, supportive regulatory environments.
US Payment Cards Market Product Landscape
The US payment cards market features a diverse range of products, including traditional physical cards, virtual cards, and prepaid cards. Recent product innovations have focused on enhancing security features, improving user experience, and integrating with other financial services. Virtual cards, in particular, have gained significant traction due to their flexibility and convenience, particularly for online and mobile payments. Technological advancements such as tokenization and biometric authentication are enhancing security and reducing fraud risk. Key performance indicators (KPIs) for the market include transaction volume, transaction value, and customer acquisition cost. The unique selling propositions (USPs) of various cards often focus on rewards programs, cashback offers, and specialized benefits tailored to specific customer segments.
Key Drivers, Barriers & Challenges in US Payment Cards Market
Key Drivers: The increasing adoption of e-commerce, the rise of mobile payments, and advancements in payment technologies are major drivers of market growth. Government initiatives to promote digital payments and supportive regulatory frameworks also contribute. Furthermore, the growing demand for secure and convenient payment solutions among consumers and businesses fuels this expansion.
Key Challenges & Restraints: Stringent regulations related to data security and fraud prevention pose a challenge. The high cost of implementing new technologies and infrastructure can also hinder growth for smaller players. Competition from alternative payment methods and concerns about data privacy are additional obstacles. Supply chain disruptions, particularly impacting the production of physical cards, can negatively impact market growth by xx%.
Emerging Opportunities in US Payment Cards Market
Emerging opportunities lie in the expansion of virtual card usage for microtransactions, the integration of payment cards with wearables, and the growing demand for personalized financial services. Untapped markets include underserved populations and businesses. Innovative applications, such as embedded finance and buy now, pay later (BNPL) services, are gaining traction. Evolving consumer preferences for contactless and mobile-first solutions also present lucrative opportunities.
Growth Accelerators in the US Payment Cards Market Industry
Long-term growth is driven by the ongoing evolution of payment technologies, strategic partnerships between financial institutions and fintech companies, and the expansion of financial services into new markets. Technological breakthroughs, such as the adoption of blockchain technology and artificial intelligence, are expected to further enhance security and efficiency. Strategic alliances enable the development of comprehensive payment ecosystems, offering enhanced user experiences. Market expansion strategies, including internationalization and the development of niche products, also contribute to long-term growth.
Key Players Shaping the US Payment Cards Market Market
- Abine Inc
- Stripe
- Qonto
- WEX Inc
- Billtrust Inc
- JP Morgan Chase
- American Express
- Skrill
- VISA
- Vanguard
Notable Milestones in US Payment Cards Market Sector
- June 2022: Visa and Safaricom launch a virtual card, enabling 30 million M-Pesa users to make global digital payments, significantly impacting the US market.
- April 2022: American Express partners with Billtrust, streamlining virtual card acceptance for suppliers and accelerating B2B payments.
In-Depth US Payment Cards Market Market Outlook
The US payment cards market is poised for sustained growth, driven by technological advancements, evolving consumer preferences, and increasing adoption of digital payment solutions. Strategic opportunities lie in leveraging innovative technologies, developing personalized financial services, and expanding into new market segments. The market's future success hinges on addressing security concerns, maintaining regulatory compliance, and fostering collaboration between traditional financial institutions and fintech companies. The continued expansion of e-commerce and the growing popularity of mobile payments will further propel market expansion in the coming years.
US Payment Cards Market Segmentation
-
1. Product Type
- 1.1. B2B Virtual Cards
- 1.2. B2C Remote Payment Virtual Cards
- 1.3. B2C POS Virtual Cards
-
2. End-User
- 2.1. Consumer Use
- 2.2. Business Use
US Payment Cards Market Segmentation By Geography
-
1. North America
- 1.1. United States
- 1.2. Canada
- 1.3. Mexico
-
2. South America
- 2.1. Brazil
- 2.2. Argentina
- 2.3. Rest of South America
-
3. Europe
- 3.1. United Kingdom
- 3.2. Germany
- 3.3. France
- 3.4. Italy
- 3.5. Spain
- 3.6. Russia
- 3.7. Benelux
- 3.8. Nordics
- 3.9. Rest of Europe
-
4. Middle East & Africa
- 4.1. Turkey
- 4.2. Israel
- 4.3. GCC
- 4.4. North Africa
- 4.5. South Africa
- 4.6. Rest of Middle East & Africa
-
5. Asia Pacific
- 5.1. China
- 5.2. India
- 5.3. Japan
- 5.4. South Korea
- 5.5. ASEAN
- 5.6. Oceania
- 5.7. Rest of Asia Pacific
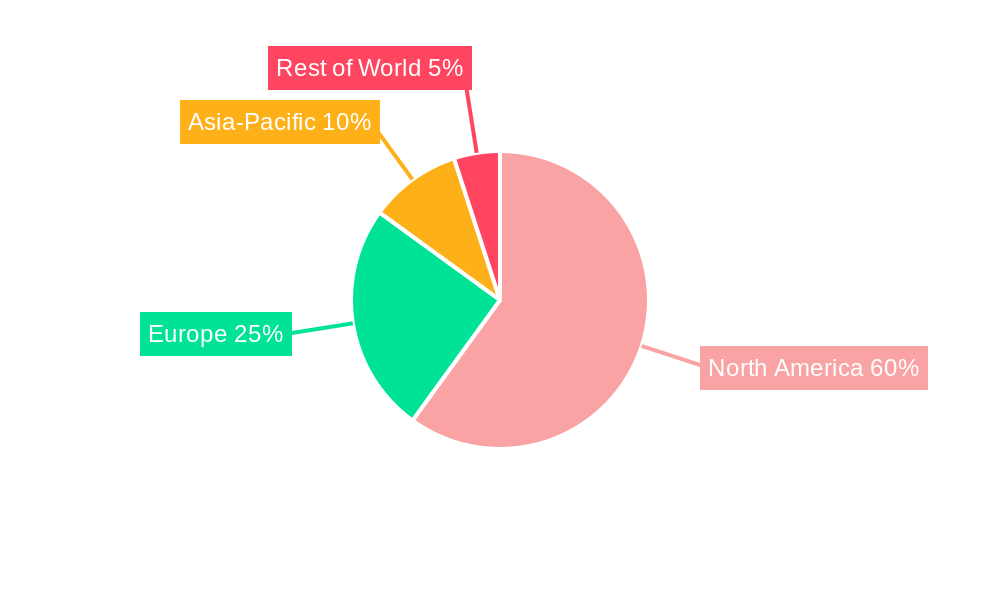
US Payment Cards Market Regional Market Share
Geographic Coverage of US Payment Cards Market
US Payment Cards Market REPORT HIGHLIGHTS
| Aspects | Details |
|---|---|
| Study Period | 2020-2034 |
| Base Year | 2025 |
| Estimated Year | 2026 |
| Forecast Period | 2026-2034 |
| Historical Period | 2020-2025 |
| Growth Rate | CAGR of 16.13% from 2020-2034 |
| Segmentation |
|
Table of Contents
- 1. Introduction
- 1.1. Research Scope
- 1.2. Market Segmentation
- 1.3. Research Objective
- 1.4. Definitions and Assumptions
- 2. Executive Summary
- 2.1. Market Snapshot
- 3. Market Dynamics
- 3.1. Market Drivers
- 3.2. Market Restrains
- 3.3. Market Trends
- 3.4. Market Opportunities
- 4. Market Factor Analysis
- 4.1. Porters Five Forces
- 4.1.1. Bargaining Power of Suppliers
- 4.1.2. Bargaining Power of Buyers
- 4.1.3. Threat of New Entrants
- 4.1.4. Threat of Substitutes
- 4.1.5. Competitive Rivalry
- 4.2. PESTEL analysis
- 4.3. BCG Analysis
- 4.3.1. Stars (High Growth, High Market Share)
- 4.3.2. Cash Cows (Low Growth, High Market Share)
- 4.3.3. Question Mark (High Growth, Low Market Share)
- 4.3.4. Dogs (Low Growth, Low Market Share)
- 4.4. Ansoff Matrix Analysis
- 4.5. Supply Chain Analysis
- 4.6. Regulatory Landscape
- 4.7. Current Market Potential and Opportunity Assessment (TAM–SAM–SOM Framework)
- 4.8. VDR Analyst Note
- 4.1. Porters Five Forces
- 5. Market Analysis, Insights and Forecast 2021-2033
- 5.1. Market Analysis, Insights and Forecast - by Product Type
- 5.1.1. B2B Virtual Cards
- 5.1.2. B2C Remote Payment Virtual Cards
- 5.1.3. B2C POS Virtual Cards
- 5.2. Market Analysis, Insights and Forecast - by End-User
- 5.2.1. Consumer Use
- 5.2.2. Business Use
- 5.3. Market Analysis, Insights and Forecast - by Region
- 5.3.1. North America
- 5.3.2. South America
- 5.3.3. Europe
- 5.3.4. Middle East & Africa
- 5.3.5. Asia Pacific
- 5.1. Market Analysis, Insights and Forecast - by Product Type
- 6. Global US Payment Cards Market Analysis, Insights and Forecast, 2021-2033
- 6.1. Market Analysis, Insights and Forecast - by Product Type
- 6.1.1. B2B Virtual Cards
- 6.1.2. B2C Remote Payment Virtual Cards
- 6.1.3. B2C POS Virtual Cards
- 6.2. Market Analysis, Insights and Forecast - by End-User
- 6.2.1. Consumer Use
- 6.2.2. Business Use
- 6.1. Market Analysis, Insights and Forecast - by Product Type
- 7. North America US Payment Cards Market Analysis, Insights and Forecast, 2021-2033
- 7.1. Market Analysis, Insights and Forecast - by Product Type
- 7.1.1. B2B Virtual Cards
- 7.1.2. B2C Remote Payment Virtual Cards
- 7.1.3. B2C POS Virtual Cards
- 7.2. Market Analysis, Insights and Forecast - by End-User
- 7.2.1. Consumer Use
- 7.2.2. Business Use
- 7.1. Market Analysis, Insights and Forecast - by Product Type
- 8. South America US Payment Cards Market Analysis, Insights and Forecast, 2021-2033
- 8.1. Market Analysis, Insights and Forecast - by Product Type
- 8.1.1. B2B Virtual Cards
- 8.1.2. B2C Remote Payment Virtual Cards
- 8.1.3. B2C POS Virtual Cards
- 8.2. Market Analysis, Insights and Forecast - by End-User
- 8.2.1. Consumer Use
- 8.2.2. Business Use
- 8.1. Market Analysis, Insights and Forecast - by Product Type
- 9. Europe US Payment Cards Market Analysis, Insights and Forecast, 2021-2033
- 9.1. Market Analysis, Insights and Forecast - by Product Type
- 9.1.1. B2B Virtual Cards
- 9.1.2. B2C Remote Payment Virtual Cards
- 9.1.3. B2C POS Virtual Cards
- 9.2. Market Analysis, Insights and Forecast - by End-User
- 9.2.1. Consumer Use
- 9.2.2. Business Use
- 9.1. Market Analysis, Insights and Forecast - by Product Type
- 10. Middle East & Africa US Payment Cards Market Analysis, Insights and Forecast, 2021-2033
- 10.1. Market Analysis, Insights and Forecast - by Product Type
- 10.1.1. B2B Virtual Cards
- 10.1.2. B2C Remote Payment Virtual Cards
- 10.1.3. B2C POS Virtual Cards
- 10.2. Market Analysis, Insights and Forecast - by End-User
- 10.2.1. Consumer Use
- 10.2.2. Business Use
- 10.1. Market Analysis, Insights and Forecast - by Product Type
- 11. Asia Pacific US Payment Cards Market Analysis, Insights and Forecast, 2021-2033
- 11.1. Market Analysis, Insights and Forecast - by Product Type
- 11.1.1. B2B Virtual Cards
- 11.1.2. B2C Remote Payment Virtual Cards
- 11.1.3. B2C POS Virtual Cards
- 11.2. Market Analysis, Insights and Forecast - by End-User
- 11.2.1. Consumer Use
- 11.2.2. Business Use
- 11.1. Market Analysis, Insights and Forecast - by Product Type
- 12. Competitive Analysis
- 12.1. Company Profiles
- 12.1.1 Abine Inc
- 12.1.1.1. Company Overview
- 12.1.1.2. Products
- 12.1.1.3. Company Financials
- 12.1.1.4. SWOT Analysis
- 12.1.2 Stripe
- 12.1.2.1. Company Overview
- 12.1.2.2. Products
- 12.1.2.3. Company Financials
- 12.1.2.4. SWOT Analysis
- 12.1.3 Qonto
- 12.1.3.1. Company Overview
- 12.1.3.2. Products
- 12.1.3.3. Company Financials
- 12.1.3.4. SWOT Analysis
- 12.1.4 WEX Inc **List Not Exhaustive
- 12.1.4.1. Company Overview
- 12.1.4.2. Products
- 12.1.4.3. Company Financials
- 12.1.4.4. SWOT Analysis
- 12.1.5 Billtrust Inc
- 12.1.5.1. Company Overview
- 12.1.5.2. Products
- 12.1.5.3. Company Financials
- 12.1.5.4. SWOT Analysis
- 12.1.6 JP Morgan Chase
- 12.1.6.1. Company Overview
- 12.1.6.2. Products
- 12.1.6.3. Company Financials
- 12.1.6.4. SWOT Analysis
- 12.1.7 American Express
- 12.1.7.1. Company Overview
- 12.1.7.2. Products
- 12.1.7.3. Company Financials
- 12.1.7.4. SWOT Analysis
- 12.1.8 Skrill
- 12.1.8.1. Company Overview
- 12.1.8.2. Products
- 12.1.8.3. Company Financials
- 12.1.8.4. SWOT Analysis
- 12.1.9 VISA
- 12.1.9.1. Company Overview
- 12.1.9.2. Products
- 12.1.9.3. Company Financials
- 12.1.9.4. SWOT Analysis
- 12.1.10 Vanguard
- 12.1.10.1. Company Overview
- 12.1.10.2. Products
- 12.1.10.3. Company Financials
- 12.1.10.4. SWOT Analysis
- 12.1.1 Abine Inc
- 12.2. Market Entropy
- 12.2.1 Company's Key Areas Served
- 12.2.2 Recent Developments
- 12.3. Company Market Share Analysis 2025
- 12.3.1 Top 5 Companies Market Share Analysis
- 12.3.2 Top 3 Companies Market Share Analysis
- 12.4. List of Potential Customers
- 13. Research Methodology
List of Figures
- Figure 1: Global US Payment Cards Market Revenue Breakdown (billion, %) by Region 2025 & 2033
- Figure 2: North America US Payment Cards Market Revenue (billion), by Product Type 2025 & 2033
- Figure 3: North America US Payment Cards Market Revenue Share (%), by Product Type 2025 & 2033
- Figure 4: North America US Payment Cards Market Revenue (billion), by End-User 2025 & 2033
- Figure 5: North America US Payment Cards Market Revenue Share (%), by End-User 2025 & 2033
- Figure 6: North America US Payment Cards Market Revenue (billion), by Country 2025 & 2033
- Figure 7: North America US Payment Cards Market Revenue Share (%), by Country 2025 & 2033
- Figure 8: South America US Payment Cards Market Revenue (billion), by Product Type 2025 & 2033
- Figure 9: South America US Payment Cards Market Revenue Share (%), by Product Type 2025 & 2033
- Figure 10: South America US Payment Cards Market Revenue (billion), by End-User 2025 & 2033
- Figure 11: South America US Payment Cards Market Revenue Share (%), by End-User 2025 & 2033
- Figure 12: South America US Payment Cards Market Revenue (billion), by Country 2025 & 2033
- Figure 13: South America US Payment Cards Market Revenue Share (%), by Country 2025 & 2033
- Figure 14: Europe US Payment Cards Market Revenue (billion), by Product Type 2025 & 2033
- Figure 15: Europe US Payment Cards Market Revenue Share (%), by Product Type 2025 & 2033
- Figure 16: Europe US Payment Cards Market Revenue (billion), by End-User 2025 & 2033
- Figure 17: Europe US Payment Cards Market Revenue Share (%), by End-User 2025 & 2033
- Figure 18: Europe US Payment Cards Market Revenue (billion), by Country 2025 & 2033
- Figure 19: Europe US Payment Cards Market Revenue Share (%), by Country 2025 & 2033
- Figure 20: Middle East & Africa US Payment Cards Market Revenue (billion), by Product Type 2025 & 2033
- Figure 21: Middle East & Africa US Payment Cards Market Revenue Share (%), by Product Type 2025 & 2033
- Figure 22: Middle East & Africa US Payment Cards Market Revenue (billion), by End-User 2025 & 2033
- Figure 23: Middle East & Africa US Payment Cards Market Revenue Share (%), by End-User 2025 & 2033
- Figure 24: Middle East & Africa US Payment Cards Market Revenue (billion), by Country 2025 & 2033
- Figure 25: Middle East & Africa US Payment Cards Market Revenue Share (%), by Country 2025 & 2033
- Figure 26: Asia Pacific US Payment Cards Market Revenue (billion), by Product Type 2025 & 2033
- Figure 27: Asia Pacific US Payment Cards Market Revenue Share (%), by Product Type 2025 & 2033
- Figure 28: Asia Pacific US Payment Cards Market Revenue (billion), by End-User 2025 & 2033
- Figure 29: Asia Pacific US Payment Cards Market Revenue Share (%), by End-User 2025 & 2033
- Figure 30: Asia Pacific US Payment Cards Market Revenue (billion), by Country 2025 & 2033
- Figure 31: Asia Pacific US Payment Cards Market Revenue Share (%), by Country 2025 & 2033
List of Tables
- Table 1: Global US Payment Cards Market Revenue billion Forecast, by Product Type 2020 & 2033
- Table 2: Global US Payment Cards Market Revenue billion Forecast, by End-User 2020 & 2033
- Table 3: Global US Payment Cards Market Revenue billion Forecast, by Region 2020 & 2033
- Table 4: Global US Payment Cards Market Revenue billion Forecast, by Product Type 2020 & 2033
- Table 5: Global US Payment Cards Market Revenue billion Forecast, by End-User 2020 & 2033
- Table 6: Global US Payment Cards Market Revenue billion Forecast, by Country 2020 & 2033
- Table 7: United States US Payment Cards Market Revenue (billion) Forecast, by Application 2020 & 2033
- Table 8: Canada US Payment Cards Market Revenue (billion) Forecast, by Application 2020 & 2033
- Table 9: Mexico US Payment Cards Market Revenue (billion) Forecast, by Application 2020 & 2033
- Table 10: Global US Payment Cards Market Revenue billion Forecast, by Product Type 2020 & 2033
- Table 11: Global US Payment Cards Market Revenue billion Forecast, by End-User 2020 & 2033
- Table 12: Global US Payment Cards Market Revenue billion Forecast, by Country 2020 & 2033
- Table 13: Brazil US Payment Cards Market Revenue (billion) Forecast, by Application 2020 & 2033
- Table 14: Argentina US Payment Cards Market Revenue (billion) Forecast, by Application 2020 & 2033
- Table 15: Rest of South America US Payment Cards Market Revenue (billion) Forecast, by Application 2020 & 2033
- Table 16: Global US Payment Cards Market Revenue billion Forecast, by Product Type 2020 & 2033
- Table 17: Global US Payment Cards Market Revenue billion Forecast, by End-User 2020 & 2033
- Table 18: Global US Payment Cards Market Revenue billion Forecast, by Country 2020 & 2033
- Table 19: United Kingdom US Payment Cards Market Revenue (billion) Forecast, by Application 2020 & 2033
- Table 20: Germany US Payment Cards Market Revenue (billion) Forecast, by Application 2020 & 2033
- Table 21: France US Payment Cards Market Revenue (billion) Forecast, by Application 2020 & 2033
- Table 22: Italy US Payment Cards Market Revenue (billion) Forecast, by Application 2020 & 2033
- Table 23: Spain US Payment Cards Market Revenue (billion) Forecast, by Application 2020 & 2033
- Table 24: Russia US Payment Cards Market Revenue (billion) Forecast, by Application 2020 & 2033
- Table 25: Benelux US Payment Cards Market Revenue (billion) Forecast, by Application 2020 & 2033
- Table 26: Nordics US Payment Cards Market Revenue (billion) Forecast, by Application 2020 & 2033
- Table 27: Rest of Europe US Payment Cards Market Revenue (billion) Forecast, by Application 2020 & 2033
- Table 28: Global US Payment Cards Market Revenue billion Forecast, by Product Type 2020 & 2033
- Table 29: Global US Payment Cards Market Revenue billion Forecast, by End-User 2020 & 2033
- Table 30: Global US Payment Cards Market Revenue billion Forecast, by Country 2020 & 2033
- Table 31: Turkey US Payment Cards Market Revenue (billion) Forecast, by Application 2020 & 2033
- Table 32: Israel US Payment Cards Market Revenue (billion) Forecast, by Application 2020 & 2033
- Table 33: GCC US Payment Cards Market Revenue (billion) Forecast, by Application 2020 & 2033
- Table 34: North Africa US Payment Cards Market Revenue (billion) Forecast, by Application 2020 & 2033
- Table 35: South Africa US Payment Cards Market Revenue (billion) Forecast, by Application 2020 & 2033
- Table 36: Rest of Middle East & Africa US Payment Cards Market Revenue (billion) Forecast, by Application 2020 & 2033
- Table 37: Global US Payment Cards Market Revenue billion Forecast, by Product Type 2020 & 2033
- Table 38: Global US Payment Cards Market Revenue billion Forecast, by End-User 2020 & 2033
- Table 39: Global US Payment Cards Market Revenue billion Forecast, by Country 2020 & 2033
- Table 40: China US Payment Cards Market Revenue (billion) Forecast, by Application 2020 & 2033
- Table 41: India US Payment Cards Market Revenue (billion) Forecast, by Application 2020 & 2033
- Table 42: Japan US Payment Cards Market Revenue (billion) Forecast, by Application 2020 & 2033
- Table 43: South Korea US Payment Cards Market Revenue (billion) Forecast, by Application 2020 & 2033
- Table 44: ASEAN US Payment Cards Market Revenue (billion) Forecast, by Application 2020 & 2033
- Table 45: Oceania US Payment Cards Market Revenue (billion) Forecast, by Application 2020 & 2033
- Table 46: Rest of Asia Pacific US Payment Cards Market Revenue (billion) Forecast, by Application 2020 & 2033
Frequently Asked Questions
1. What is the projected Compound Annual Growth Rate (CAGR) of the US Payment Cards Market?
The projected CAGR is approximately 16.13%.
2. Which companies are prominent players in the US Payment Cards Market?
Key companies in the market include Abine Inc, Stripe, Qonto, WEX Inc **List Not Exhaustive, Billtrust Inc, JP Morgan Chase, American Express, Skrill, VISA, Vanguard.
3. What are the main segments of the US Payment Cards Market?
The market segments include Product Type, End-User.
4. Can you provide details about the market size?
The market size is estimated to be USD 6.48 billion as of 2022.
5. What are some drivers contributing to market growth?
Usage of Credit Card give the bonus and reward points.
6. What are the notable trends driving market growth?
Increase in the Penetration of Internet in the USA.
7. Are there any restraints impacting market growth?
Interest rates on Credit Card.
8. Can you provide examples of recent developments in the market?
On June 2022, Global digital payments firm Visa and Safaricom, the operator of the M-Pesa mobile money product, have today launched a virtual card, enabling millions of M-Pesa users to make digital payments globally including the US region. The virtual card will enable 30 million M-Pesa users to make cashless payments at Visa's global network of merchants. Users can activate the virtual card through the M-Pesa mobile app or by USSD.
9. What pricing options are available for accessing the report?
Pricing options include single-user, multi-user, and enterprise licenses priced at USD 3800, USD 4500, and USD 5800 respectively.
10. Is the market size provided in terms of value or volume?
The market size is provided in terms of value, measured in billion.
11. Are there any specific market keywords associated with the report?
Yes, the market keyword associated with the report is "US Payment Cards Market," which aids in identifying and referencing the specific market segment covered.
12. How do I determine which pricing option suits my needs best?
The pricing options vary based on user requirements and access needs. Individual users may opt for single-user licenses, while businesses requiring broader access may choose multi-user or enterprise licenses for cost-effective access to the report.
13. Are there any additional resources or data provided in the US Payment Cards Market report?
While the report offers comprehensive insights, it's advisable to review the specific contents or supplementary materials provided to ascertain if additional resources or data are available.
14. How can I stay updated on further developments or reports in the US Payment Cards Market?
To stay informed about further developments, trends, and reports in the US Payment Cards Market, consider subscribing to industry newsletters, following relevant companies and organizations, or regularly checking reputable industry news sources and publications.
Methodology
Step 1 - Identification of Relevant Samples Size from Population Database


Step 2 - Approaches for Defining Global Market Size (Value, Volume* & Price*)

Note*: In applicable scenarios
Step 3 - Data Sources
Primary Research
- Web Analytics
- Survey Reports
- Research Institute
- Latest Research Reports
- Opinion Leaders
Secondary Research
- Annual Reports
- White Paper
- Latest Press Release
- Industry Association
- Paid Database
- Investor Presentations

Step 4 - Data Triangulation
Involves using different sources of information in order to increase the validity of a study
These sources are likely to be stakeholders in a program - participants, other researchers, program staff, other community members, and so on.
Then we put all data in single framework & apply various statistical tools to find out the dynamic on the market.
During the analysis stage, feedback from the stakeholder groups would be compared to determine areas of agreement as well as areas of divergence