
Key Insights
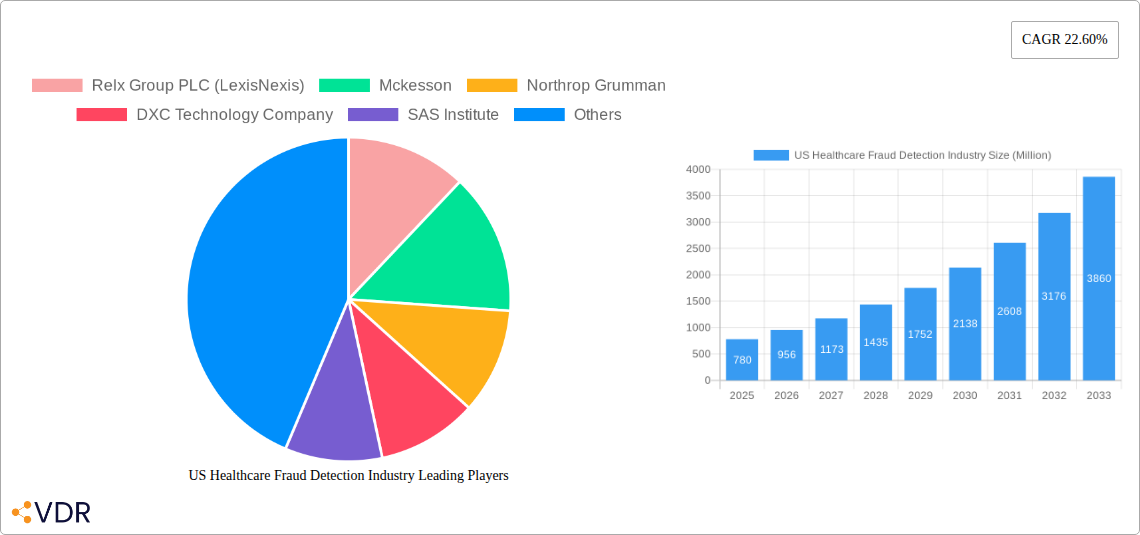
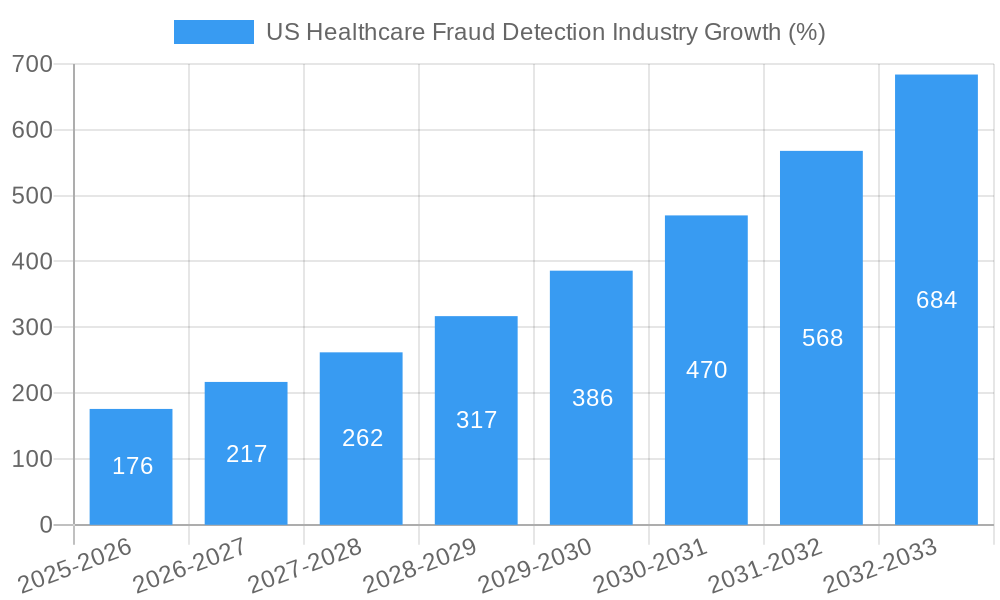
The US healthcare fraud detection market, currently valued at approximately $780 million in 2025, is experiencing robust growth, projected to expand at a Compound Annual Growth Rate (CAGR) of 22.60% from 2025 to 2033. This significant growth is fueled by several key drivers. Increasing healthcare spending, coupled with a rise in sophisticated fraudulent activities, necessitates advanced analytics solutions. The adoption of predictive and prescriptive analytics, which go beyond descriptive analytics by forecasting potential fraud and recommending preventative measures, is a major catalyst. Government initiatives aimed at strengthening regulatory compliance and reducing healthcare costs further incentivize the market's expansion. Furthermore, the increasing penetration of electronic health records (EHRs) provides a richer data source for fraud detection algorithms to analyze, leading to improved accuracy and efficiency. Private insurance payers and government agencies are the primary end-users, actively investing in robust fraud detection systems to safeguard their financial resources and protect patients. Leading companies like Relx Group, McKesson, and IBM are driving innovation through the development of sophisticated software and services.
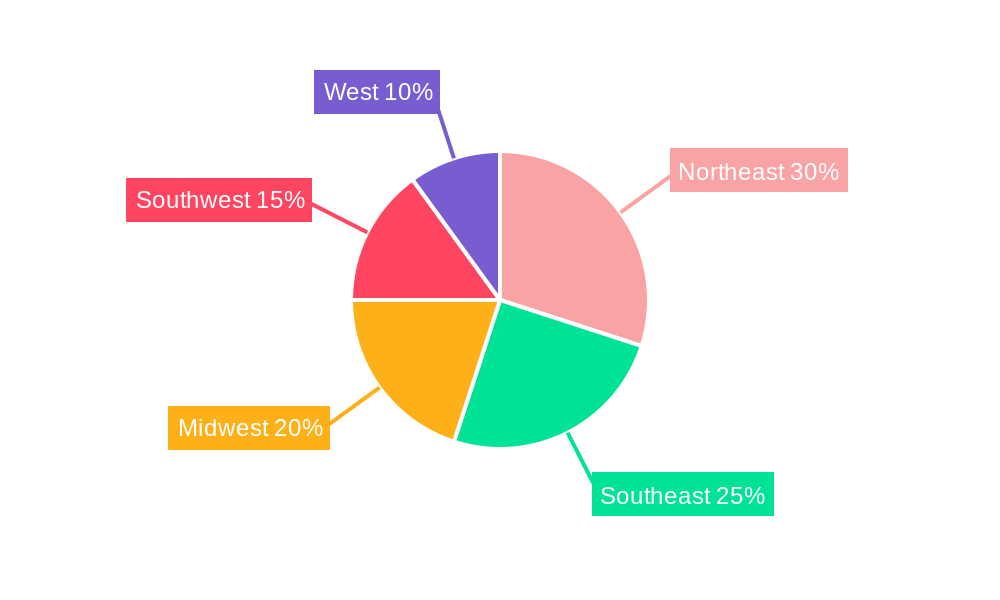
The market segmentation reveals a strong focus on key applications such as insurance claims review and payment integrity. While the Northeast region currently holds a significant market share due to higher healthcare spending and technological advancements, other regions are expected to experience substantial growth in the coming years as awareness of fraud detection tools increases. The presence of established players, coupled with the entry of emerging technology companies, creates a dynamic and competitive landscape. Despite the positive growth trajectory, potential restraints include the high initial investment costs associated with implementing advanced analytics solutions and the need for specialized expertise to manage and interpret the complex data sets. However, the long-term benefits in terms of cost savings and improved efficiency outweigh these initial hurdles, ensuring continued market growth and a promising future for the US healthcare fraud detection industry.
US Healthcare Fraud Detection Industry Report: 2019-2033
This comprehensive report provides a detailed analysis of the US Healthcare Fraud Detection Industry, encompassing market dynamics, growth trends, key players, and future outlook. With a study period spanning 2019-2033, a base year of 2025, and a forecast period of 2025-2033, this report offers invaluable insights for industry professionals, investors, and strategic decision-makers. The market is segmented by Type (Descriptive Analytics, Predictive Analytics, Prescriptive Analytics), Application (Review of Insurance Claims, Payment Integrity), and End-User (Private Insurance Payers, Government Agencies, Other End Users). The total market size is projected to reach xx Million by 2033.
US Healthcare Fraud Detection Industry Market Dynamics & Structure
The US healthcare fraud detection market is characterized by a moderately concentrated landscape, with several large players holding significant market share. Relx Group PLC (LexisNexis), McKesson, and IBM are prominent examples. Technological innovation, particularly in AI and machine learning, is a key driver, enabling more accurate and efficient fraud detection. Stringent regulatory frameworks, such as HIPAA, shape industry practices and influence investment decisions. The market experiences competitive pressure from alternative solutions and evolving cybersecurity threats. Mergers and acquisitions (M&A) activity remains significant, with larger companies strategically acquiring smaller firms to expand capabilities and market reach. The healthcare fraud detection market experienced xx Million in M&A activity during the historical period (2019-2024).
- Market Concentration: Moderately concentrated, with top 5 players holding approximately xx% market share in 2024.
- Technological Innovation: AI, machine learning, and big data analytics are driving improvements in accuracy and efficiency.
- Regulatory Framework: HIPAA and other regulations significantly influence market operations and compliance needs.
- Competitive Substitutes: Traditional auditing methods and emerging cybersecurity technologies pose competitive pressure.
- End-User Demographics: Private insurance payers and government agencies represent the largest end-user segments.
- M&A Trends: Significant M&A activity observed, particularly among larger players seeking to consolidate market position and expand service offerings.
US Healthcare Fraud Detection Industry Growth Trends & Insights
The US healthcare fraud detection market has experienced substantial growth over the historical period (2019-2024), driven by increasing healthcare spending, rising fraud rates, and advancements in analytical technologies. The market size expanded from xx Million in 2019 to xx Million in 2024, exhibiting a CAGR of xx%. This growth is projected to continue, with the market expected to reach xx Million by 2033, driven by factors such as increased adoption of advanced analytics, government initiatives to combat fraud, and the growing volume of healthcare data. Technological disruptions, such as the emergence of AI-powered solutions, are accelerating market transformation and improving detection accuracy. Consumer behavior shifts, including increased reliance on digital healthcare platforms, present both opportunities and challenges in terms of fraud vulnerability.
Dominant Regions, Countries, or Segments in US Healthcare Fraud Detection Industry
The US healthcare fraud detection market is geographically concentrated, with significant growth across various regions. The largest segment by type is Predictive Analytics, followed by Descriptive and Prescriptive Analytics. The Application segment focused on Insurance Claims Review holds the largest market share. Private Insurance Payers remains the leading end-user segment, benefiting from advanced technologies to effectively combat fraud and manage costs.
- Key Drivers:
- Increased Healthcare Spending: Higher spending leads to a larger target for fraudulent activities.
- Government Initiatives: Increased funding and regulatory pressure fuel market growth.
- Technological Advancements: AI and machine learning enhance detection capabilities.
- Dominance Factors:
- Market Share: Private insurance payers dominate due to their significant financial stakes.
- Growth Potential: Government agencies and other end-users are expected to increase their investment.
US Healthcare Fraud Detection Industry Product Landscape
The product landscape is characterized by a range of solutions, including software platforms, consulting services, and managed services. These solutions leverage AI, machine learning, and big data analytics to identify and prevent fraudulent activities. Key differentiators include the accuracy, speed, and scalability of these solutions. Technological advancements focus on enhancing data integration, improving analytical models, and providing real-time fraud detection capabilities. The unique selling propositions often center around reduced costs, improved accuracy, and enhanced regulatory compliance.
Key Drivers, Barriers & Challenges in US Healthcare Fraud Detection Industry
Key Drivers:
- Rising Healthcare Fraud: The increasing prevalence of fraud necessitates sophisticated detection solutions.
- Government Regulations: Stricter regulations push for more effective fraud prevention measures.
- Technological Advancements: AI, machine learning, and big data analytics offer enhanced capabilities.
Key Challenges:
- Data Security and Privacy: Handling sensitive healthcare data requires robust security measures.
- Integration Complexity: Integrating various data sources can be complex and time-consuming.
- High Implementation Costs: Advanced technologies can involve significant upfront investment.
Emerging Opportunities in US Healthcare Fraud Detection Industry
- Expansion into Untapped Markets: Reaching smaller healthcare providers and focusing on specific fraud types.
- Innovative Applications: Developing solutions for emerging fraud schemes and leveraging blockchain technology.
- Evolving Consumer Preferences: Adapting to changing patient behaviors and digital healthcare trends.
Growth Accelerators in the US Healthcare Fraud Detection Industry Industry
Technological breakthroughs, particularly in AI and machine learning, are driving significant growth. Strategic partnerships between technology providers and healthcare organizations are enhancing market penetration. Expansion into new geographic markets and the development of more sophisticated analytics capabilities are key growth catalysts.
Key Players Shaping the US Healthcare Fraud Detection Industry Market
- Relx Group PLC (LexisNexis)
- McKesson
- Northrop Grumman
- DXC Technology Company
- SAS Institute
- EXL (Scio Health Analytics)
- International Business Machines Corporation (IBM)
- Conduent Inc
- United Health Group Incorporated (Optum Inc)
- OSP Labs
Notable Milestones in US Healthcare Fraud Detection Industry Sector
- April 2022: Hewlett Packard Enterprise launched HPE Swarm Learning, an AI solution for accelerating insights, including fraud detection.
- April 2022: IBM introduced the IBM z16, a system with an integrated AI accelerator for real-time transaction analysis.
In-Depth US Healthcare Fraud Detection Industry Market Outlook
The US healthcare fraud detection market exhibits strong growth potential driven by continuous technological innovation and increasing regulatory pressure. Strategic partnerships, expansion into new markets, and the development of more sophisticated analytics will further fuel market expansion. Companies that leverage AI and machine learning effectively will gain a competitive edge, capturing a significant market share in the coming years. The focus will shift towards proactive fraud prevention and real-time detection capabilities.
US Healthcare Fraud Detection Industry Segmentation
-
1. Type
- 1.1. Descriptive Analytics
- 1.2. Predictive Analytics
- 1.3. Prescriptive Analytics
-
2. Application
- 2.1. Review of Insurance Claims
- 2.2. Payment Integrity
-
3. End User
- 3.1. Private Insurance Payers
- 3.2. Government Agencies
- 3.3. Other End Users
US Healthcare Fraud Detection Industry Segmentation By Geography
-
1. North America
- 1.1. United States
- 1.2. Canada
- 1.3. Mexico
-
2. South America
- 2.1. Brazil
- 2.2. Argentina
- 2.3. Rest of South America
-
3. Europe
- 3.1. United Kingdom
- 3.2. Germany
- 3.3. France
- 3.4. Italy
- 3.5. Spain
- 3.6. Russia
- 3.7. Benelux
- 3.8. Nordics
- 3.9. Rest of Europe
-
4. Middle East & Africa
- 4.1. Turkey
- 4.2. Israel
- 4.3. GCC
- 4.4. North Africa
- 4.5. South Africa
- 4.6. Rest of Middle East & Africa
-
5. Asia Pacific
- 5.1. China
- 5.2. India
- 5.3. Japan
- 5.4. South Korea
- 5.5. ASEAN
- 5.6. Oceania
- 5.7. Rest of Asia Pacific
US Healthcare Fraud Detection Industry REPORT HIGHLIGHTS
| Aspects | Details |
|---|---|
| Study Period | 2019-2033 |
| Base Year | 2024 |
| Estimated Year | 2025 |
| Forecast Period | 2025-2033 |
| Historical Period | 2019-2024 |
| Growth Rate | CAGR of 22.60% from 2019-2033 |
| Segmentation |
|
Table of Contents
- 1. Introduction
- 1.1. Research Scope
- 1.2. Market Segmentation
- 1.3. Research Methodology
- 1.4. Definitions and Assumptions
- 2. Executive Summary
- 2.1. Introduction
- 3. Market Dynamics
- 3.1. Introduction
- 3.2. Market Drivers
- 3.2.1. Increasing Fraudulent Activities in the US Healthcare Sector; Growing Pressure to Increase the Operation Efficiency and Reduce Healthcare Spending; Prepayment Review Model
- 3.3. Market Restrains
- 3.3.1. Lack of Skilled Healthcare IT Labors in the Country
- 3.4. Market Trends
- 3.4.1. Insurance Claims Segment is is Expected to Witness a Healthy Growth in Future.
- 4. Market Factor Analysis
- 4.1. Porters Five Forces
- 4.2. Supply/Value Chain
- 4.3. PESTEL analysis
- 4.4. Market Entropy
- 4.5. Patent/Trademark Analysis
- 5. Global US Healthcare Fraud Detection Industry Analysis, Insights and Forecast, 2019-2031
- 5.1. Market Analysis, Insights and Forecast - by Type
- 5.1.1. Descriptive Analytics
- 5.1.2. Predictive Analytics
- 5.1.3. Prescriptive Analytics
- 5.2. Market Analysis, Insights and Forecast - by Application
- 5.2.1. Review of Insurance Claims
- 5.2.2. Payment Integrity
- 5.3. Market Analysis, Insights and Forecast - by End User
- 5.3.1. Private Insurance Payers
- 5.3.2. Government Agencies
- 5.3.3. Other End Users
- 5.4. Market Analysis, Insights and Forecast - by Region
- 5.4.1. North America
- 5.4.2. South America
- 5.4.3. Europe
- 5.4.4. Middle East & Africa
- 5.4.5. Asia Pacific
- 5.1. Market Analysis, Insights and Forecast - by Type
- 6. North America US Healthcare Fraud Detection Industry Analysis, Insights and Forecast, 2019-2031
- 6.1. Market Analysis, Insights and Forecast - by Type
- 6.1.1. Descriptive Analytics
- 6.1.2. Predictive Analytics
- 6.1.3. Prescriptive Analytics
- 6.2. Market Analysis, Insights and Forecast - by Application
- 6.2.1. Review of Insurance Claims
- 6.2.2. Payment Integrity
- 6.3. Market Analysis, Insights and Forecast - by End User
- 6.3.1. Private Insurance Payers
- 6.3.2. Government Agencies
- 6.3.3. Other End Users
- 6.1. Market Analysis, Insights and Forecast - by Type
- 7. South America US Healthcare Fraud Detection Industry Analysis, Insights and Forecast, 2019-2031
- 7.1. Market Analysis, Insights and Forecast - by Type
- 7.1.1. Descriptive Analytics
- 7.1.2. Predictive Analytics
- 7.1.3. Prescriptive Analytics
- 7.2. Market Analysis, Insights and Forecast - by Application
- 7.2.1. Review of Insurance Claims
- 7.2.2. Payment Integrity
- 7.3. Market Analysis, Insights and Forecast - by End User
- 7.3.1. Private Insurance Payers
- 7.3.2. Government Agencies
- 7.3.3. Other End Users
- 7.1. Market Analysis, Insights and Forecast - by Type
- 8. Europe US Healthcare Fraud Detection Industry Analysis, Insights and Forecast, 2019-2031
- 8.1. Market Analysis, Insights and Forecast - by Type
- 8.1.1. Descriptive Analytics
- 8.1.2. Predictive Analytics
- 8.1.3. Prescriptive Analytics
- 8.2. Market Analysis, Insights and Forecast - by Application
- 8.2.1. Review of Insurance Claims
- 8.2.2. Payment Integrity
- 8.3. Market Analysis, Insights and Forecast - by End User
- 8.3.1. Private Insurance Payers
- 8.3.2. Government Agencies
- 8.3.3. Other End Users
- 8.1. Market Analysis, Insights and Forecast - by Type
- 9. Middle East & Africa US Healthcare Fraud Detection Industry Analysis, Insights and Forecast, 2019-2031
- 9.1. Market Analysis, Insights and Forecast - by Type
- 9.1.1. Descriptive Analytics
- 9.1.2. Predictive Analytics
- 9.1.3. Prescriptive Analytics
- 9.2. Market Analysis, Insights and Forecast - by Application
- 9.2.1. Review of Insurance Claims
- 9.2.2. Payment Integrity
- 9.3. Market Analysis, Insights and Forecast - by End User
- 9.3.1. Private Insurance Payers
- 9.3.2. Government Agencies
- 9.3.3. Other End Users
- 9.1. Market Analysis, Insights and Forecast - by Type
- 10. Asia Pacific US Healthcare Fraud Detection Industry Analysis, Insights and Forecast, 2019-2031
- 10.1. Market Analysis, Insights and Forecast - by Type
- 10.1.1. Descriptive Analytics
- 10.1.2. Predictive Analytics
- 10.1.3. Prescriptive Analytics
- 10.2. Market Analysis, Insights and Forecast - by Application
- 10.2.1. Review of Insurance Claims
- 10.2.2. Payment Integrity
- 10.3. Market Analysis, Insights and Forecast - by End User
- 10.3.1. Private Insurance Payers
- 10.3.2. Government Agencies
- 10.3.3. Other End Users
- 10.1. Market Analysis, Insights and Forecast - by Type
- 11. Northeast US Healthcare Fraud Detection Industry Analysis, Insights and Forecast, 2019-2031
- 12. Southeast US Healthcare Fraud Detection Industry Analysis, Insights and Forecast, 2019-2031
- 13. Midwest US Healthcare Fraud Detection Industry Analysis, Insights and Forecast, 2019-2031
- 14. Southwest US Healthcare Fraud Detection Industry Analysis, Insights and Forecast, 2019-2031
- 15. West US Healthcare Fraud Detection Industry Analysis, Insights and Forecast, 2019-2031
- 16. Competitive Analysis
- 16.1. Global Market Share Analysis 2024
- 16.2. Company Profiles
- 16.2.1 Relx Group PLC (LexisNexis)
- 16.2.1.1. Overview
- 16.2.1.2. Products
- 16.2.1.3. SWOT Analysis
- 16.2.1.4. Recent Developments
- 16.2.1.5. Financials (Based on Availability)
- 16.2.2 Mckesson
- 16.2.2.1. Overview
- 16.2.2.2. Products
- 16.2.2.3. SWOT Analysis
- 16.2.2.4. Recent Developments
- 16.2.2.5. Financials (Based on Availability)
- 16.2.3 Northrop Grumman
- 16.2.3.1. Overview
- 16.2.3.2. Products
- 16.2.3.3. SWOT Analysis
- 16.2.3.4. Recent Developments
- 16.2.3.5. Financials (Based on Availability)
- 16.2.4 DXC Technology Company
- 16.2.4.1. Overview
- 16.2.4.2. Products
- 16.2.4.3. SWOT Analysis
- 16.2.4.4. Recent Developments
- 16.2.4.5. Financials (Based on Availability)
- 16.2.5 SAS Institute
- 16.2.5.1. Overview
- 16.2.5.2. Products
- 16.2.5.3. SWOT Analysis
- 16.2.5.4. Recent Developments
- 16.2.5.5. Financials (Based on Availability)
- 16.2.6 EXL (Scio Health Analytics)
- 16.2.6.1. Overview
- 16.2.6.2. Products
- 16.2.6.3. SWOT Analysis
- 16.2.6.4. Recent Developments
- 16.2.6.5. Financials (Based on Availability)
- 16.2.7 International Business Machines Corporation (IBM)
- 16.2.7.1. Overview
- 16.2.7.2. Products
- 16.2.7.3. SWOT Analysis
- 16.2.7.4. Recent Developments
- 16.2.7.5. Financials (Based on Availability)
- 16.2.8 Conduent Inc
- 16.2.8.1. Overview
- 16.2.8.2. Products
- 16.2.8.3. SWOT Analysis
- 16.2.8.4. Recent Developments
- 16.2.8.5. Financials (Based on Availability)
- 16.2.9 United Health Group Incorporated (Optum Inc )
- 16.2.9.1. Overview
- 16.2.9.2. Products
- 16.2.9.3. SWOT Analysis
- 16.2.9.4. Recent Developments
- 16.2.9.5. Financials (Based on Availability)
- 16.2.10 OSP Labs
- 16.2.10.1. Overview
- 16.2.10.2. Products
- 16.2.10.3. SWOT Analysis
- 16.2.10.4. Recent Developments
- 16.2.10.5. Financials (Based on Availability)
- 16.2.1 Relx Group PLC (LexisNexis)
List of Figures
- Figure 1: Global US Healthcare Fraud Detection Industry Revenue Breakdown (Million, %) by Region 2024 & 2032
- Figure 2: United states US Healthcare Fraud Detection Industry Revenue (Million), by Country 2024 & 2032
- Figure 3: United states US Healthcare Fraud Detection Industry Revenue Share (%), by Country 2024 & 2032
- Figure 4: North America US Healthcare Fraud Detection Industry Revenue (Million), by Type 2024 & 2032
- Figure 5: North America US Healthcare Fraud Detection Industry Revenue Share (%), by Type 2024 & 2032
- Figure 6: North America US Healthcare Fraud Detection Industry Revenue (Million), by Application 2024 & 2032
- Figure 7: North America US Healthcare Fraud Detection Industry Revenue Share (%), by Application 2024 & 2032
- Figure 8: North America US Healthcare Fraud Detection Industry Revenue (Million), by End User 2024 & 2032
- Figure 9: North America US Healthcare Fraud Detection Industry Revenue Share (%), by End User 2024 & 2032
- Figure 10: North America US Healthcare Fraud Detection Industry Revenue (Million), by Country 2024 & 2032
- Figure 11: North America US Healthcare Fraud Detection Industry Revenue Share (%), by Country 2024 & 2032
- Figure 12: South America US Healthcare Fraud Detection Industry Revenue (Million), by Type 2024 & 2032
- Figure 13: South America US Healthcare Fraud Detection Industry Revenue Share (%), by Type 2024 & 2032
- Figure 14: South America US Healthcare Fraud Detection Industry Revenue (Million), by Application 2024 & 2032
- Figure 15: South America US Healthcare Fraud Detection Industry Revenue Share (%), by Application 2024 & 2032
- Figure 16: South America US Healthcare Fraud Detection Industry Revenue (Million), by End User 2024 & 2032
- Figure 17: South America US Healthcare Fraud Detection Industry Revenue Share (%), by End User 2024 & 2032
- Figure 18: South America US Healthcare Fraud Detection Industry Revenue (Million), by Country 2024 & 2032
- Figure 19: South America US Healthcare Fraud Detection Industry Revenue Share (%), by Country 2024 & 2032
- Figure 20: Europe US Healthcare Fraud Detection Industry Revenue (Million), by Type 2024 & 2032
- Figure 21: Europe US Healthcare Fraud Detection Industry Revenue Share (%), by Type 2024 & 2032
- Figure 22: Europe US Healthcare Fraud Detection Industry Revenue (Million), by Application 2024 & 2032
- Figure 23: Europe US Healthcare Fraud Detection Industry Revenue Share (%), by Application 2024 & 2032
- Figure 24: Europe US Healthcare Fraud Detection Industry Revenue (Million), by End User 2024 & 2032
- Figure 25: Europe US Healthcare Fraud Detection Industry Revenue Share (%), by End User 2024 & 2032
- Figure 26: Europe US Healthcare Fraud Detection Industry Revenue (Million), by Country 2024 & 2032
- Figure 27: Europe US Healthcare Fraud Detection Industry Revenue Share (%), by Country 2024 & 2032
- Figure 28: Middle East & Africa US Healthcare Fraud Detection Industry Revenue (Million), by Type 2024 & 2032
- Figure 29: Middle East & Africa US Healthcare Fraud Detection Industry Revenue Share (%), by Type 2024 & 2032
- Figure 30: Middle East & Africa US Healthcare Fraud Detection Industry Revenue (Million), by Application 2024 & 2032
- Figure 31: Middle East & Africa US Healthcare Fraud Detection Industry Revenue Share (%), by Application 2024 & 2032
- Figure 32: Middle East & Africa US Healthcare Fraud Detection Industry Revenue (Million), by End User 2024 & 2032
- Figure 33: Middle East & Africa US Healthcare Fraud Detection Industry Revenue Share (%), by End User 2024 & 2032
- Figure 34: Middle East & Africa US Healthcare Fraud Detection Industry Revenue (Million), by Country 2024 & 2032
- Figure 35: Middle East & Africa US Healthcare Fraud Detection Industry Revenue Share (%), by Country 2024 & 2032
- Figure 36: Asia Pacific US Healthcare Fraud Detection Industry Revenue (Million), by Type 2024 & 2032
- Figure 37: Asia Pacific US Healthcare Fraud Detection Industry Revenue Share (%), by Type 2024 & 2032
- Figure 38: Asia Pacific US Healthcare Fraud Detection Industry Revenue (Million), by Application 2024 & 2032
- Figure 39: Asia Pacific US Healthcare Fraud Detection Industry Revenue Share (%), by Application 2024 & 2032
- Figure 40: Asia Pacific US Healthcare Fraud Detection Industry Revenue (Million), by End User 2024 & 2032
- Figure 41: Asia Pacific US Healthcare Fraud Detection Industry Revenue Share (%), by End User 2024 & 2032
- Figure 42: Asia Pacific US Healthcare Fraud Detection Industry Revenue (Million), by Country 2024 & 2032
- Figure 43: Asia Pacific US Healthcare Fraud Detection Industry Revenue Share (%), by Country 2024 & 2032
List of Tables
- Table 1: Global US Healthcare Fraud Detection Industry Revenue Million Forecast, by Region 2019 & 2032
- Table 2: Global US Healthcare Fraud Detection Industry Revenue Million Forecast, by Type 2019 & 2032
- Table 3: Global US Healthcare Fraud Detection Industry Revenue Million Forecast, by Application 2019 & 2032
- Table 4: Global US Healthcare Fraud Detection Industry Revenue Million Forecast, by End User 2019 & 2032
- Table 5: Global US Healthcare Fraud Detection Industry Revenue Million Forecast, by Region 2019 & 2032
- Table 6: Global US Healthcare Fraud Detection Industry Revenue Million Forecast, by Country 2019 & 2032
- Table 7: Northeast US Healthcare Fraud Detection Industry Revenue (Million) Forecast, by Application 2019 & 2032
- Table 8: Southeast US Healthcare Fraud Detection Industry Revenue (Million) Forecast, by Application 2019 & 2032
- Table 9: Midwest US Healthcare Fraud Detection Industry Revenue (Million) Forecast, by Application 2019 & 2032
- Table 10: Southwest US Healthcare Fraud Detection Industry Revenue (Million) Forecast, by Application 2019 & 2032
- Table 11: West US Healthcare Fraud Detection Industry Revenue (Million) Forecast, by Application 2019 & 2032
- Table 12: Global US Healthcare Fraud Detection Industry Revenue Million Forecast, by Type 2019 & 2032
- Table 13: Global US Healthcare Fraud Detection Industry Revenue Million Forecast, by Application 2019 & 2032
- Table 14: Global US Healthcare Fraud Detection Industry Revenue Million Forecast, by End User 2019 & 2032
- Table 15: Global US Healthcare Fraud Detection Industry Revenue Million Forecast, by Country 2019 & 2032
- Table 16: United States US Healthcare Fraud Detection Industry Revenue (Million) Forecast, by Application 2019 & 2032
- Table 17: Canada US Healthcare Fraud Detection Industry Revenue (Million) Forecast, by Application 2019 & 2032
- Table 18: Mexico US Healthcare Fraud Detection Industry Revenue (Million) Forecast, by Application 2019 & 2032
- Table 19: Global US Healthcare Fraud Detection Industry Revenue Million Forecast, by Type 2019 & 2032
- Table 20: Global US Healthcare Fraud Detection Industry Revenue Million Forecast, by Application 2019 & 2032
- Table 21: Global US Healthcare Fraud Detection Industry Revenue Million Forecast, by End User 2019 & 2032
- Table 22: Global US Healthcare Fraud Detection Industry Revenue Million Forecast, by Country 2019 & 2032
- Table 23: Brazil US Healthcare Fraud Detection Industry Revenue (Million) Forecast, by Application 2019 & 2032
- Table 24: Argentina US Healthcare Fraud Detection Industry Revenue (Million) Forecast, by Application 2019 & 2032
- Table 25: Rest of South America US Healthcare Fraud Detection Industry Revenue (Million) Forecast, by Application 2019 & 2032
- Table 26: Global US Healthcare Fraud Detection Industry Revenue Million Forecast, by Type 2019 & 2032
- Table 27: Global US Healthcare Fraud Detection Industry Revenue Million Forecast, by Application 2019 & 2032
- Table 28: Global US Healthcare Fraud Detection Industry Revenue Million Forecast, by End User 2019 & 2032
- Table 29: Global US Healthcare Fraud Detection Industry Revenue Million Forecast, by Country 2019 & 2032
- Table 30: United Kingdom US Healthcare Fraud Detection Industry Revenue (Million) Forecast, by Application 2019 & 2032
- Table 31: Germany US Healthcare Fraud Detection Industry Revenue (Million) Forecast, by Application 2019 & 2032
- Table 32: France US Healthcare Fraud Detection Industry Revenue (Million) Forecast, by Application 2019 & 2032
- Table 33: Italy US Healthcare Fraud Detection Industry Revenue (Million) Forecast, by Application 2019 & 2032
- Table 34: Spain US Healthcare Fraud Detection Industry Revenue (Million) Forecast, by Application 2019 & 2032
- Table 35: Russia US Healthcare Fraud Detection Industry Revenue (Million) Forecast, by Application 2019 & 2032
- Table 36: Benelux US Healthcare Fraud Detection Industry Revenue (Million) Forecast, by Application 2019 & 2032
- Table 37: Nordics US Healthcare Fraud Detection Industry Revenue (Million) Forecast, by Application 2019 & 2032
- Table 38: Rest of Europe US Healthcare Fraud Detection Industry Revenue (Million) Forecast, by Application 2019 & 2032
- Table 39: Global US Healthcare Fraud Detection Industry Revenue Million Forecast, by Type 2019 & 2032
- Table 40: Global US Healthcare Fraud Detection Industry Revenue Million Forecast, by Application 2019 & 2032
- Table 41: Global US Healthcare Fraud Detection Industry Revenue Million Forecast, by End User 2019 & 2032
- Table 42: Global US Healthcare Fraud Detection Industry Revenue Million Forecast, by Country 2019 & 2032
- Table 43: Turkey US Healthcare Fraud Detection Industry Revenue (Million) Forecast, by Application 2019 & 2032
- Table 44: Israel US Healthcare Fraud Detection Industry Revenue (Million) Forecast, by Application 2019 & 2032
- Table 45: GCC US Healthcare Fraud Detection Industry Revenue (Million) Forecast, by Application 2019 & 2032
- Table 46: North Africa US Healthcare Fraud Detection Industry Revenue (Million) Forecast, by Application 2019 & 2032
- Table 47: South Africa US Healthcare Fraud Detection Industry Revenue (Million) Forecast, by Application 2019 & 2032
- Table 48: Rest of Middle East & Africa US Healthcare Fraud Detection Industry Revenue (Million) Forecast, by Application 2019 & 2032
- Table 49: Global US Healthcare Fraud Detection Industry Revenue Million Forecast, by Type 2019 & 2032
- Table 50: Global US Healthcare Fraud Detection Industry Revenue Million Forecast, by Application 2019 & 2032
- Table 51: Global US Healthcare Fraud Detection Industry Revenue Million Forecast, by End User 2019 & 2032
- Table 52: Global US Healthcare Fraud Detection Industry Revenue Million Forecast, by Country 2019 & 2032
- Table 53: China US Healthcare Fraud Detection Industry Revenue (Million) Forecast, by Application 2019 & 2032
- Table 54: India US Healthcare Fraud Detection Industry Revenue (Million) Forecast, by Application 2019 & 2032
- Table 55: Japan US Healthcare Fraud Detection Industry Revenue (Million) Forecast, by Application 2019 & 2032
- Table 56: South Korea US Healthcare Fraud Detection Industry Revenue (Million) Forecast, by Application 2019 & 2032
- Table 57: ASEAN US Healthcare Fraud Detection Industry Revenue (Million) Forecast, by Application 2019 & 2032
- Table 58: Oceania US Healthcare Fraud Detection Industry Revenue (Million) Forecast, by Application 2019 & 2032
- Table 59: Rest of Asia Pacific US Healthcare Fraud Detection Industry Revenue (Million) Forecast, by Application 2019 & 2032
Frequently Asked Questions
1. What is the projected Compound Annual Growth Rate (CAGR) of the US Healthcare Fraud Detection Industry?
The projected CAGR is approximately 22.60%.
2. Which companies are prominent players in the US Healthcare Fraud Detection Industry?
Key companies in the market include Relx Group PLC (LexisNexis), Mckesson, Northrop Grumman, DXC Technology Company, SAS Institute, EXL (Scio Health Analytics), International Business Machines Corporation (IBM), Conduent Inc, United Health Group Incorporated (Optum Inc ), OSP Labs.
3. What are the main segments of the US Healthcare Fraud Detection Industry?
The market segments include Type, Application, End User.
4. Can you provide details about the market size?
The market size is estimated to be USD 0.78 Million as of 2022.
5. What are some drivers contributing to market growth?
Increasing Fraudulent Activities in the US Healthcare Sector; Growing Pressure to Increase the Operation Efficiency and Reduce Healthcare Spending; Prepayment Review Model.
6. What are the notable trends driving market growth?
Insurance Claims Segment is is Expected to Witness a Healthy Growth in Future..
7. Are there any restraints impacting market growth?
Lack of Skilled Healthcare IT Labors in the Country.
8. Can you provide examples of recent developments in the market?
In April 2022, Hewlett Packard Enterprise reported the launch of HPE Swarm Learning, a breakthrough AI solution to accelerate insights at the edge, from diagnosing diseases to detecting credit card fraud, by sharing and unifying AI model learnings without compromising data privacy.
9. What pricing options are available for accessing the report?
Pricing options include single-user, multi-user, and enterprise licenses priced at USD 3800, USD 4500, and USD 5800 respectively.
10. Is the market size provided in terms of value or volume?
The market size is provided in terms of value, measured in Million.
11. Are there any specific market keywords associated with the report?
Yes, the market keyword associated with the report is "US Healthcare Fraud Detection Industry," which aids in identifying and referencing the specific market segment covered.
12. How do I determine which pricing option suits my needs best?
The pricing options vary based on user requirements and access needs. Individual users may opt for single-user licenses, while businesses requiring broader access may choose multi-user or enterprise licenses for cost-effective access to the report.
13. Are there any additional resources or data provided in the US Healthcare Fraud Detection Industry report?
While the report offers comprehensive insights, it's advisable to review the specific contents or supplementary materials provided to ascertain if additional resources or data are available.
14. How can I stay updated on further developments or reports in the US Healthcare Fraud Detection Industry?
To stay informed about further developments, trends, and reports in the US Healthcare Fraud Detection Industry, consider subscribing to industry newsletters, following relevant companies and organizations, or regularly checking reputable industry news sources and publications.
Methodology
Step 1 - Identification of Relevant Samples Size from Population Database


Step 2 - Approaches for Defining Global Market Size (Value, Volume* & Price*)

Note*: In applicable scenarios
Step 3 - Data Sources
Primary Research
- Web Analytics
- Survey Reports
- Research Institute
- Latest Research Reports
- Opinion Leaders
Secondary Research
- Annual Reports
- White Paper
- Latest Press Release
- Industry Association
- Paid Database
- Investor Presentations

Step 4 - Data Triangulation
Involves using different sources of information in order to increase the validity of a study
These sources are likely to be stakeholders in a program - participants, other researchers, program staff, other community members, and so on.
Then we put all data in single framework & apply various statistical tools to find out the dynamic on the market.
During the analysis stage, feedback from the stakeholder groups would be compared to determine areas of agreement as well as areas of divergence


