


Key Insights
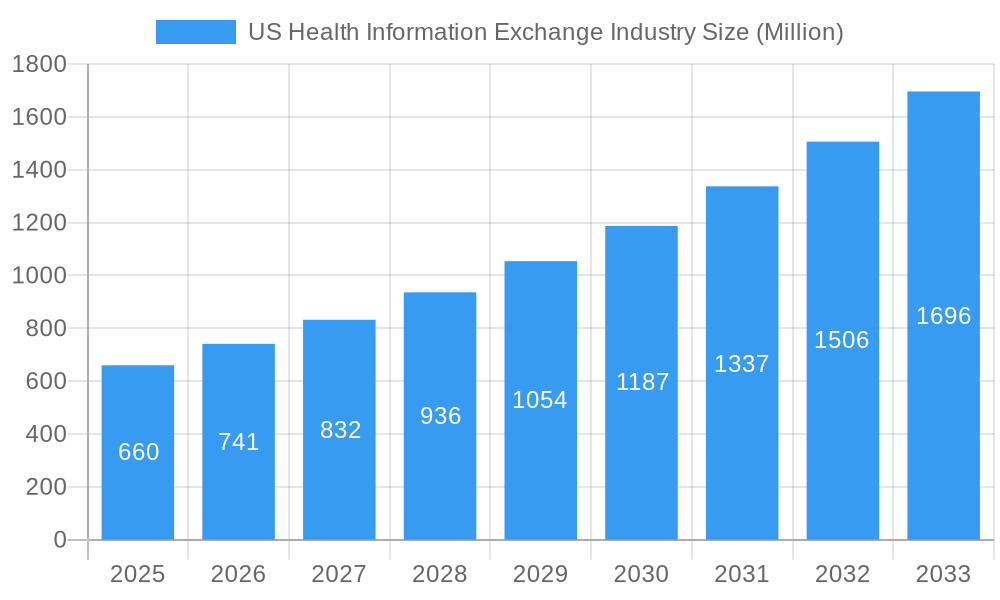
The US health information exchange (HIE) market, valued at $0.66 billion in 2025, is experiencing robust growth, projected to expand at a compound annual growth rate (CAGR) of 12.12% from 2025 to 2033. This growth is fueled by several key drivers. Increasing government mandates for interoperability and data sharing, coupled with a rising focus on improving patient care coordination and reducing healthcare costs, are significantly boosting market adoption. The shift towards value-based care models necessitates seamless data exchange between providers, further propelling HIE market expansion. Technological advancements, such as cloud computing and advanced analytics, are enhancing the efficiency and scalability of HIE solutions, making them more attractive to healthcare organizations. Furthermore, the growing prevalence of chronic diseases and the aging population are contributing to the increased demand for efficient data exchange to facilitate better patient management and outcomes. The market is segmented by exchange type (direct, query-based, consumer-mediated), component (EMPI, HPD, RLS, clinical data repositories), implementation model (centralized, decentralized, hybrid), setup type (private, public), and application (internal interfacing, secure messaging, workflow management, web portal development). This segmentation reflects the diverse needs and preferences of healthcare organizations in implementing HIE solutions.

US Health Information Exchange Industry Market Size (In Million)

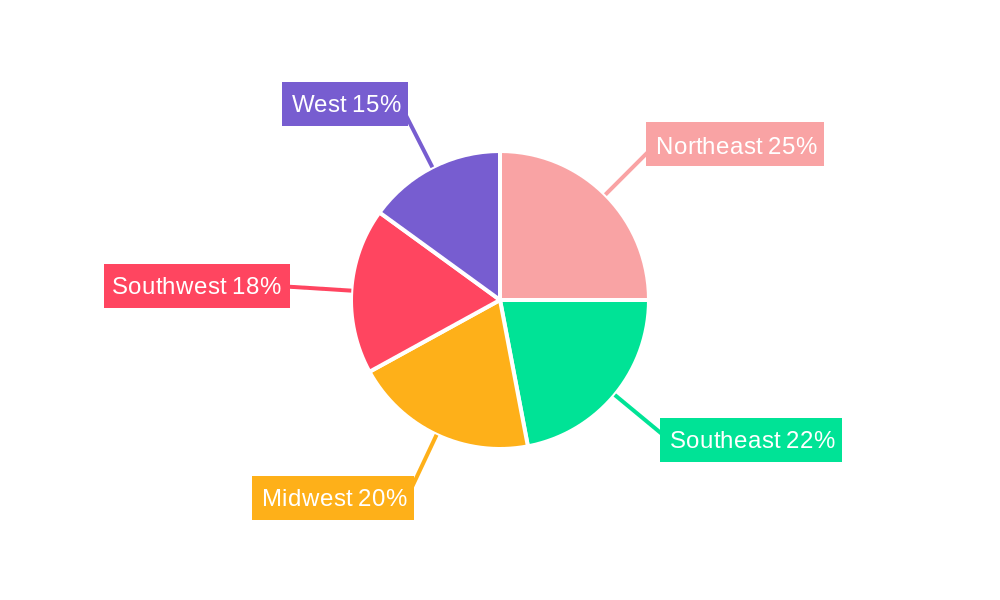
The regional breakdown shows significant activity across all US regions (Northeast, Southeast, Midwest, Southwest, and West), with varying levels of adoption based on factors such as healthcare infrastructure, technological maturity, and regulatory landscape. Major players like Epic, Cerner, McKesson, and Allscripts are driving innovation and market competition, offering a range of HIE solutions tailored to specific healthcare needs. While challenges remain, such as data security concerns and interoperability issues between different systems, the overall market trajectory suggests a positive outlook for the future, driven by the undeniable need for improved data sharing and coordination in the US healthcare system. The continued development of standardized data formats and enhanced cybersecurity measures will further accelerate market growth in the coming years.
US Health Information Exchange Industry Company Market Share
US Health Information Exchange Industry Market Report: 2019-2033
This comprehensive report provides an in-depth analysis of the US Health Information Exchange (HIE) industry, encompassing market dynamics, growth trends, dominant segments, key players, and future outlook. The report covers the period 2019-2033, with a focus on the base year 2025 and forecast period 2025-2033. It segments the market by exchange type (Direct Exchange, Query-based Exchange, Consumer-mediated Exchange), component (Enterprise Master Person Index (EMPI), Healthcare Provider Directory (HPD), Record Locator Service (RLS), Clinical Data Repository, Other Components), implementation model (Centralized/Consolidated, Decentralized/Federated, Hybrid), setup type (Private, Public), and application (Internal Interfacing, Secure Messaging, Workflow Management, Web Portal Development, Patient Safety). The market size is presented in millions of USD.
US Health Information Exchange Industry Market Dynamics & Structure
The US Health Information Exchange market is a dynamic landscape shaped by technological advancements, regulatory changes, and evolving healthcare delivery models. Market concentration is moderate, with several large players alongside numerous smaller, specialized providers. Technological innovation, particularly in areas like AI and interoperability, is a key driver, while regulatory frameworks like HIPAA significantly influence market structure and adoption. Competitive substitutes include legacy systems and manual processes, though the push for interoperability is diminishing their relevance. The end-user demographic is broad, encompassing hospitals, clinics, health systems, payers, and government agencies. Mergers and acquisitions (M&A) activity is relatively frequent, with larger players consolidating market share and expanding capabilities. The historical period (2019-2024) witnessed xx M&A deals, and the forecast period (2025-2033) is projected to see xx deals, driven by a need to enhance functionalities and extend market reach.
- Market Concentration: Moderately concentrated, with top 5 players holding xx% market share in 2025.
- Technological Innovation: AI-powered analytics, blockchain technology, and improved interoperability are key drivers.
- Regulatory Framework: HIPAA compliance and other regulations significantly influence market operations.
- Competitive Substitutes: Legacy systems and manual processes face increasing competition.
- End-User Demographics: Hospitals, clinics, health systems, payers, and government agencies.
- M&A Trends: Increasing consolidation, with xx% of deals involving major players in the past five years.
US Health Information Exchange Industry Growth Trends & Insights
The US HIE market is experiencing robust growth, driven by factors such as the increasing need for improved interoperability, rising healthcare costs, and the growing adoption of electronic health records (EHRs). The market size reached xx million in 2024 and is projected to reach xx million by 2033, exhibiting a Compound Annual Growth Rate (CAGR) of xx% during the forecast period. This growth is fueled by technological advancements that enhance data exchange efficiency and security. Consumer behavior shifts towards greater healthcare transparency and patient empowerment further accelerate adoption. The penetration rate of HIE solutions among healthcare providers increased from xx% in 2019 to xx% in 2024 and is expected to reach xx% by 2033.
Dominant Regions, Countries, or Segments in US Health Information Exchange Industry
The US HIE market exhibits diverse regional and segmental growth patterns. While nationwide adoption is increasing, certain regions show faster growth than others due to factors like advanced healthcare infrastructure, favorable regulatory environments, and higher technology adoption rates. Among the segments, the Direct Exchange and Query-based Exchange currently dominate, due to their established presence and compatibility with existing systems. However, the Consumer-mediated Exchange segment shows the highest growth potential, fueled by increasing consumer demand for greater control over their health data. Key drivers across segments include:
- Direct Exchange: High market share due to established infrastructure and ease of implementation.
- Query-based Exchange: Growing adoption due to cost-effectiveness and scalability.
- Consumer-mediated Exchange: Fastest-growing segment, driven by patient empowerment and data privacy concerns.
- EMPI: Essential for accurate patient identification and data integration.
- HPD: Crucial for efficient healthcare coordination and referrals.
- RLS: Facilitates fast and accurate retrieval of patient records.
- Clinical Data Repository: Growing in importance due to the demand for comprehensive patient data.
- Centralized/Consolidated Models: Offer economies of scale and enhanced data management.
- Decentralized/Federated Models: Provide greater flexibility and regional control.
- Public Setup: Driven by government initiatives to improve healthcare interoperability.
US Health Information Exchange Industry Product Landscape
The HIE product landscape is characterized by diverse solutions, ranging from standalone platforms to integrated suites. These solutions offer functionalities such as secure messaging, workflow management, and web portal development, enhancing efficiency and patient safety. Recent innovations involve AI-powered analytics for improved decision-making and blockchain technology for enhanced data security and transparency. Key players are continually refining their products to address interoperability challenges and evolving regulatory demands. Unique selling propositions include robust security measures, seamless integration with existing systems, and user-friendly interfaces.
Key Drivers, Barriers & Challenges in US Health Information Exchange Industry
Key Drivers: The increasing need for interoperability, rising healthcare costs, government mandates for health data exchange, and growing adoption of EHRs are major drivers. Technological advancements, such as AI and blockchain, are also accelerating market growth.
Key Challenges and Restraints: Interoperability challenges, data privacy concerns, high implementation costs, and the lack of standardized protocols are key restraints. The complexity of integrating diverse systems and the resistance to change among some healthcare providers also hinder market expansion. Data security breaches can result in significant financial losses and reputational damage, posing a significant challenge. Estimated financial impact of data breaches in the industry in 2024 was xx million.
Emerging Opportunities in US Health Information Exchange Industry
Emerging opportunities include the expansion of consumer-mediated exchanges, the integration of telehealth platforms, and the development of new applications for population health management. Untapped markets include smaller healthcare providers and rural communities. Evolving consumer preferences for greater control over their health data will shape future developments. The integration of AI for predictive analytics and personalized medicine holds significant potential.
Growth Accelerators in the US Health Information Exchange Industry
Technological breakthroughs, particularly in AI and blockchain, are crucial growth catalysts. Strategic partnerships between healthcare providers, technology vendors, and government agencies can enhance market penetration. Expansion strategies that focus on underserved communities and the integration of emerging technologies, such as IoT and wearable health devices, will drive long-term growth. Government initiatives promoting interoperability and data sharing will further accelerate market expansion.
Key Players Shaping the US Health Information Exchange Industry Market
- Eclinical Works
- Mckesson Corporation
- Infor Inc
- Epic Corporation Inc
- mpro
- Cerner Corporation
- Optum Inc
- Allscripts Healthcare Solutions Inc
- Nextgen Healthcare Information Systems LLC
- Newgen Software Technologies
- Conifer Health Solutions
- Medicity Inc
Notable Milestones in US Health Information Exchange Industry Sector
- October 2022: Mpowered Health launched its xChange, a US consumer-mediated healthcare data exchange.
- March 2022: mpro5 Inc. launched in the US market, focusing on real-time data collection and leverage.
In-Depth US Health Information Exchange Industry Market Outlook
The US HIE market holds significant future potential, driven by increasing demand for interoperable healthcare systems, the growing adoption of telehealth, and the rising importance of data-driven decision-making in healthcare. Strategic opportunities exist for companies that can offer innovative solutions addressing interoperability challenges, ensuring data privacy and security, and leveraging emerging technologies like AI and blockchain. The focus on improving patient engagement and expanding access to healthcare in underserved communities presents further avenues for growth. The market's long-term success hinges on collaborative efforts between stakeholders to establish standardized protocols and promote widespread adoption of HIE solutions.
US Health Information Exchange Industry Segmentation
-
1. Implementation Model
- 1.1. Centralized/Consolidated Models
- 1.2. Decentralized/Federated Models
- 1.3. Hybrid Model
-
2. Setup Type
- 2.1. Private
- 2.2. Public
-
3. Application
- 3.1. Internal Interfacing
- 3.2. Secure Messaging
- 3.3. Workflow Management
- 3.4. Web Portal Development
- 3.5. Patient Safety
-
4. Exchange Type
- 4.1. Direct Exchange
- 4.2. Query-based Exchange
- 4.3. Consumer-mediated Exchange
-
5. Component
- 5.1. Enterprise Master Person Index (EMPI)
- 5.2. Healthcare Provider Directory (HPD)
- 5.3. Record Locator Service (RLS)
- 5.4. Clinical Data Repository
- 5.5. Other Components
US Health Information Exchange Industry Segmentation By Geography
-
1. North America
- 1.1. United States
- 1.2. Canada
- 1.3. Mexico
-
2. South America
- 2.1. Brazil
- 2.2. Argentina
- 2.3. Rest of South America
-
3. Europe
- 3.1. United Kingdom
- 3.2. Germany
- 3.3. France
- 3.4. Italy
- 3.5. Spain
- 3.6. Russia
- 3.7. Benelux
- 3.8. Nordics
- 3.9. Rest of Europe
-
4. Middle East & Africa
- 4.1. Turkey
- 4.2. Israel
- 4.3. GCC
- 4.4. North Africa
- 4.5. South Africa
- 4.6. Rest of Middle East & Africa
-
5. Asia Pacific
- 5.1. China
- 5.2. India
- 5.3. Japan
- 5.4. South Korea
- 5.5. ASEAN
- 5.6. Oceania
- 5.7. Rest of Asia Pacific
US Health Information Exchange Industry Regional Market Share
Geographic Coverage of US Health Information Exchange Industry
US Health Information Exchange Industry REPORT HIGHLIGHTS
| Aspects | Details |
|---|---|
| Study Period | 2020-2034 |
| Base Year | 2025 |
| Estimated Year | 2026 |
| Forecast Period | 2026-2034 |
| Historical Period | 2020-2025 |
| Growth Rate | CAGR of 12.12% from 2020-2034 |
| Segmentation |
|
Table of Contents
- 1. Introduction
- 1.1. Research Scope
- 1.2. Market Segmentation
- 1.3. Research Methodology
- 1.4. Definitions and Assumptions
- 2. Executive Summary
- 2.1. Introduction
- 3. Market Dynamics
- 3.1. Introduction
- 3.2. Market Drivers
- 3.2.1. Increasing Demand for Electronic Health Records Resulting in the Expansion of the Market; Government Support via Various Programs and Incentives; Reduction in Healthcare Cost and Improved Efficacy
- 3.3. Market Restrains
- 3.3.1. Huge Initial Infrastructural Investment and Slow Return on Investment; Data Privacy and Security Concerns
- 3.4. Market Trends
- 3.4.1. The Decentralized/Federated Model is Expected to Hold a Notable Market Share Over the Forecast Period
- 4. Market Factor Analysis
- 4.1. Porters Five Forces
- 4.2. Supply/Value Chain
- 4.3. PESTEL analysis
- 4.4. Market Entropy
- 4.5. Patent/Trademark Analysis
- 5. Global US Health Information Exchange Industry Analysis, Insights and Forecast, 2020-2032
- 5.1. Market Analysis, Insights and Forecast - by Implementation Model
- 5.1.1. Centralized/Consolidated Models
- 5.1.2. Decentralized/Federated Models
- 5.1.3. Hybrid Model
- 5.2. Market Analysis, Insights and Forecast - by Setup Type
- 5.2.1. Private
- 5.2.2. Public
- 5.3. Market Analysis, Insights and Forecast - by Application
- 5.3.1. Internal Interfacing
- 5.3.2. Secure Messaging
- 5.3.3. Workflow Management
- 5.3.4. Web Portal Development
- 5.3.5. Patient Safety
- 5.4. Market Analysis, Insights and Forecast - by Exchange Type
- 5.4.1. Direct Exchange
- 5.4.2. Query-based Exchange
- 5.4.3. Consumer-mediated Exchange
- 5.5. Market Analysis, Insights and Forecast - by Component
- 5.5.1. Enterprise Master Person Index (EMPI)
- 5.5.2. Healthcare Provider Directory (HPD)
- 5.5.3. Record Locator Service (RLS)
- 5.5.4. Clinical Data Repository
- 5.5.5. Other Components
- 5.6. Market Analysis, Insights and Forecast - by Region
- 5.6.1. North America
- 5.6.2. South America
- 5.6.3. Europe
- 5.6.4. Middle East & Africa
- 5.6.5. Asia Pacific
- 5.1. Market Analysis, Insights and Forecast - by Implementation Model
- 6. North America US Health Information Exchange Industry Analysis, Insights and Forecast, 2020-2032
- 6.1. Market Analysis, Insights and Forecast - by Implementation Model
- 6.1.1. Centralized/Consolidated Models
- 6.1.2. Decentralized/Federated Models
- 6.1.3. Hybrid Model
- 6.2. Market Analysis, Insights and Forecast - by Setup Type
- 6.2.1. Private
- 6.2.2. Public
- 6.3. Market Analysis, Insights and Forecast - by Application
- 6.3.1. Internal Interfacing
- 6.3.2. Secure Messaging
- 6.3.3. Workflow Management
- 6.3.4. Web Portal Development
- 6.3.5. Patient Safety
- 6.4. Market Analysis, Insights and Forecast - by Exchange Type
- 6.4.1. Direct Exchange
- 6.4.2. Query-based Exchange
- 6.4.3. Consumer-mediated Exchange
- 6.5. Market Analysis, Insights and Forecast - by Component
- 6.5.1. Enterprise Master Person Index (EMPI)
- 6.5.2. Healthcare Provider Directory (HPD)
- 6.5.3. Record Locator Service (RLS)
- 6.5.4. Clinical Data Repository
- 6.5.5. Other Components
- 6.1. Market Analysis, Insights and Forecast - by Implementation Model
- 7. South America US Health Information Exchange Industry Analysis, Insights and Forecast, 2020-2032
- 7.1. Market Analysis, Insights and Forecast - by Implementation Model
- 7.1.1. Centralized/Consolidated Models
- 7.1.2. Decentralized/Federated Models
- 7.1.3. Hybrid Model
- 7.2. Market Analysis, Insights and Forecast - by Setup Type
- 7.2.1. Private
- 7.2.2. Public
- 7.3. Market Analysis, Insights and Forecast - by Application
- 7.3.1. Internal Interfacing
- 7.3.2. Secure Messaging
- 7.3.3. Workflow Management
- 7.3.4. Web Portal Development
- 7.3.5. Patient Safety
- 7.4. Market Analysis, Insights and Forecast - by Exchange Type
- 7.4.1. Direct Exchange
- 7.4.2. Query-based Exchange
- 7.4.3. Consumer-mediated Exchange
- 7.5. Market Analysis, Insights and Forecast - by Component
- 7.5.1. Enterprise Master Person Index (EMPI)
- 7.5.2. Healthcare Provider Directory (HPD)
- 7.5.3. Record Locator Service (RLS)
- 7.5.4. Clinical Data Repository
- 7.5.5. Other Components
- 7.1. Market Analysis, Insights and Forecast - by Implementation Model
- 8. Europe US Health Information Exchange Industry Analysis, Insights and Forecast, 2020-2032
- 8.1. Market Analysis, Insights and Forecast - by Implementation Model
- 8.1.1. Centralized/Consolidated Models
- 8.1.2. Decentralized/Federated Models
- 8.1.3. Hybrid Model
- 8.2. Market Analysis, Insights and Forecast - by Setup Type
- 8.2.1. Private
- 8.2.2. Public
- 8.3. Market Analysis, Insights and Forecast - by Application
- 8.3.1. Internal Interfacing
- 8.3.2. Secure Messaging
- 8.3.3. Workflow Management
- 8.3.4. Web Portal Development
- 8.3.5. Patient Safety
- 8.4. Market Analysis, Insights and Forecast - by Exchange Type
- 8.4.1. Direct Exchange
- 8.4.2. Query-based Exchange
- 8.4.3. Consumer-mediated Exchange
- 8.5. Market Analysis, Insights and Forecast - by Component
- 8.5.1. Enterprise Master Person Index (EMPI)
- 8.5.2. Healthcare Provider Directory (HPD)
- 8.5.3. Record Locator Service (RLS)
- 8.5.4. Clinical Data Repository
- 8.5.5. Other Components
- 8.1. Market Analysis, Insights and Forecast - by Implementation Model
- 9. Middle East & Africa US Health Information Exchange Industry Analysis, Insights and Forecast, 2020-2032
- 9.1. Market Analysis, Insights and Forecast - by Implementation Model
- 9.1.1. Centralized/Consolidated Models
- 9.1.2. Decentralized/Federated Models
- 9.1.3. Hybrid Model
- 9.2. Market Analysis, Insights and Forecast - by Setup Type
- 9.2.1. Private
- 9.2.2. Public
- 9.3. Market Analysis, Insights and Forecast - by Application
- 9.3.1. Internal Interfacing
- 9.3.2. Secure Messaging
- 9.3.3. Workflow Management
- 9.3.4. Web Portal Development
- 9.3.5. Patient Safety
- 9.4. Market Analysis, Insights and Forecast - by Exchange Type
- 9.4.1. Direct Exchange
- 9.4.2. Query-based Exchange
- 9.4.3. Consumer-mediated Exchange
- 9.5. Market Analysis, Insights and Forecast - by Component
- 9.5.1. Enterprise Master Person Index (EMPI)
- 9.5.2. Healthcare Provider Directory (HPD)
- 9.5.3. Record Locator Service (RLS)
- 9.5.4. Clinical Data Repository
- 9.5.5. Other Components
- 9.1. Market Analysis, Insights and Forecast - by Implementation Model
- 10. Asia Pacific US Health Information Exchange Industry Analysis, Insights and Forecast, 2020-2032
- 10.1. Market Analysis, Insights and Forecast - by Implementation Model
- 10.1.1. Centralized/Consolidated Models
- 10.1.2. Decentralized/Federated Models
- 10.1.3. Hybrid Model
- 10.2. Market Analysis, Insights and Forecast - by Setup Type
- 10.2.1. Private
- 10.2.2. Public
- 10.3. Market Analysis, Insights and Forecast - by Application
- 10.3.1. Internal Interfacing
- 10.3.2. Secure Messaging
- 10.3.3. Workflow Management
- 10.3.4. Web Portal Development
- 10.3.5. Patient Safety
- 10.4. Market Analysis, Insights and Forecast - by Exchange Type
- 10.4.1. Direct Exchange
- 10.4.2. Query-based Exchange
- 10.4.3. Consumer-mediated Exchange
- 10.5. Market Analysis, Insights and Forecast - by Component
- 10.5.1. Enterprise Master Person Index (EMPI)
- 10.5.2. Healthcare Provider Directory (HPD)
- 10.5.3. Record Locator Service (RLS)
- 10.5.4. Clinical Data Repository
- 10.5.5. Other Components
- 10.1. Market Analysis, Insights and Forecast - by Implementation Model
- 11. Competitive Analysis
- 11.1. Global Market Share Analysis 2025
- 11.2. Company Profiles
- 11.2.1 Eclinical Works
- 11.2.1.1. Overview
- 11.2.1.2. Products
- 11.2.1.3. SWOT Analysis
- 11.2.1.4. Recent Developments
- 11.2.1.5. Financials (Based on Availability)
- 11.2.2 Mckesson Corporation
- 11.2.2.1. Overview
- 11.2.2.2. Products
- 11.2.2.3. SWOT Analysis
- 11.2.2.4. Recent Developments
- 11.2.2.5. Financials (Based on Availability)
- 11.2.3 Infor Inc
- 11.2.3.1. Overview
- 11.2.3.2. Products
- 11.2.3.3. SWOT Analysis
- 11.2.3.4. Recent Developments
- 11.2.3.5. Financials (Based on Availability)
- 11.2.4 Epic Corporation Inc
- 11.2.4.1. Overview
- 11.2.4.2. Products
- 11.2.4.3. SWOT Analysis
- 11.2.4.4. Recent Developments
- 11.2.4.5. Financials (Based on Availability)
- 11.2.5 mpro
- 11.2.5.1. Overview
- 11.2.5.2. Products
- 11.2.5.3. SWOT Analysis
- 11.2.5.4. Recent Developments
- 11.2.5.5. Financials (Based on Availability)
- 11.2.6 Cerner Corporation
- 11.2.6.1. Overview
- 11.2.6.2. Products
- 11.2.6.3. SWOT Analysis
- 11.2.6.4. Recent Developments
- 11.2.6.5. Financials (Based on Availability)
- 11.2.7 Optum Inc
- 11.2.7.1. Overview
- 11.2.7.2. Products
- 11.2.7.3. SWOT Analysis
- 11.2.7.4. Recent Developments
- 11.2.7.5. Financials (Based on Availability)
- 11.2.8 Allscripts Healthcare Solutions Inc
- 11.2.8.1. Overview
- 11.2.8.2. Products
- 11.2.8.3. SWOT Analysis
- 11.2.8.4. Recent Developments
- 11.2.8.5. Financials (Based on Availability)
- 11.2.9 Nextgen Healthcare Information Systems LLC
- 11.2.9.1. Overview
- 11.2.9.2. Products
- 11.2.9.3. SWOT Analysis
- 11.2.9.4. Recent Developments
- 11.2.9.5. Financials (Based on Availability)
- 11.2.10 Newgen Software Technologies
- 11.2.10.1. Overview
- 11.2.10.2. Products
- 11.2.10.3. SWOT Analysis
- 11.2.10.4. Recent Developments
- 11.2.10.5. Financials (Based on Availability)
- 11.2.11 Conifer Health Solutions
- 11.2.11.1. Overview
- 11.2.11.2. Products
- 11.2.11.3. SWOT Analysis
- 11.2.11.4. Recent Developments
- 11.2.11.5. Financials (Based on Availability)
- 11.2.12 Medicity Inc
- 11.2.12.1. Overview
- 11.2.12.2. Products
- 11.2.12.3. SWOT Analysis
- 11.2.12.4. Recent Developments
- 11.2.12.5. Financials (Based on Availability)
- 11.2.1 Eclinical Works
List of Figures
- Figure 1: Global US Health Information Exchange Industry Revenue Breakdown (Million, %) by Region 2025 & 2033
- Figure 2: North America US Health Information Exchange Industry Revenue (Million), by Implementation Model 2025 & 2033
- Figure 3: North America US Health Information Exchange Industry Revenue Share (%), by Implementation Model 2025 & 2033
- Figure 4: North America US Health Information Exchange Industry Revenue (Million), by Setup Type 2025 & 2033
- Figure 5: North America US Health Information Exchange Industry Revenue Share (%), by Setup Type 2025 & 2033
- Figure 6: North America US Health Information Exchange Industry Revenue (Million), by Application 2025 & 2033
- Figure 7: North America US Health Information Exchange Industry Revenue Share (%), by Application 2025 & 2033
- Figure 8: North America US Health Information Exchange Industry Revenue (Million), by Exchange Type 2025 & 2033
- Figure 9: North America US Health Information Exchange Industry Revenue Share (%), by Exchange Type 2025 & 2033
- Figure 10: North America US Health Information Exchange Industry Revenue (Million), by Component 2025 & 2033
- Figure 11: North America US Health Information Exchange Industry Revenue Share (%), by Component 2025 & 2033
- Figure 12: North America US Health Information Exchange Industry Revenue (Million), by Country 2025 & 2033
- Figure 13: North America US Health Information Exchange Industry Revenue Share (%), by Country 2025 & 2033
- Figure 14: South America US Health Information Exchange Industry Revenue (Million), by Implementation Model 2025 & 2033
- Figure 15: South America US Health Information Exchange Industry Revenue Share (%), by Implementation Model 2025 & 2033
- Figure 16: South America US Health Information Exchange Industry Revenue (Million), by Setup Type 2025 & 2033
- Figure 17: South America US Health Information Exchange Industry Revenue Share (%), by Setup Type 2025 & 2033
- Figure 18: South America US Health Information Exchange Industry Revenue (Million), by Application 2025 & 2033
- Figure 19: South America US Health Information Exchange Industry Revenue Share (%), by Application 2025 & 2033
- Figure 20: South America US Health Information Exchange Industry Revenue (Million), by Exchange Type 2025 & 2033
- Figure 21: South America US Health Information Exchange Industry Revenue Share (%), by Exchange Type 2025 & 2033
- Figure 22: South America US Health Information Exchange Industry Revenue (Million), by Component 2025 & 2033
- Figure 23: South America US Health Information Exchange Industry Revenue Share (%), by Component 2025 & 2033
- Figure 24: South America US Health Information Exchange Industry Revenue (Million), by Country 2025 & 2033
- Figure 25: South America US Health Information Exchange Industry Revenue Share (%), by Country 2025 & 2033
- Figure 26: Europe US Health Information Exchange Industry Revenue (Million), by Implementation Model 2025 & 2033
- Figure 27: Europe US Health Information Exchange Industry Revenue Share (%), by Implementation Model 2025 & 2033
- Figure 28: Europe US Health Information Exchange Industry Revenue (Million), by Setup Type 2025 & 2033
- Figure 29: Europe US Health Information Exchange Industry Revenue Share (%), by Setup Type 2025 & 2033
- Figure 30: Europe US Health Information Exchange Industry Revenue (Million), by Application 2025 & 2033
- Figure 31: Europe US Health Information Exchange Industry Revenue Share (%), by Application 2025 & 2033
- Figure 32: Europe US Health Information Exchange Industry Revenue (Million), by Exchange Type 2025 & 2033
- Figure 33: Europe US Health Information Exchange Industry Revenue Share (%), by Exchange Type 2025 & 2033
- Figure 34: Europe US Health Information Exchange Industry Revenue (Million), by Component 2025 & 2033
- Figure 35: Europe US Health Information Exchange Industry Revenue Share (%), by Component 2025 & 2033
- Figure 36: Europe US Health Information Exchange Industry Revenue (Million), by Country 2025 & 2033
- Figure 37: Europe US Health Information Exchange Industry Revenue Share (%), by Country 2025 & 2033
- Figure 38: Middle East & Africa US Health Information Exchange Industry Revenue (Million), by Implementation Model 2025 & 2033
- Figure 39: Middle East & Africa US Health Information Exchange Industry Revenue Share (%), by Implementation Model 2025 & 2033
- Figure 40: Middle East & Africa US Health Information Exchange Industry Revenue (Million), by Setup Type 2025 & 2033
- Figure 41: Middle East & Africa US Health Information Exchange Industry Revenue Share (%), by Setup Type 2025 & 2033
- Figure 42: Middle East & Africa US Health Information Exchange Industry Revenue (Million), by Application 2025 & 2033
- Figure 43: Middle East & Africa US Health Information Exchange Industry Revenue Share (%), by Application 2025 & 2033
- Figure 44: Middle East & Africa US Health Information Exchange Industry Revenue (Million), by Exchange Type 2025 & 2033
- Figure 45: Middle East & Africa US Health Information Exchange Industry Revenue Share (%), by Exchange Type 2025 & 2033
- Figure 46: Middle East & Africa US Health Information Exchange Industry Revenue (Million), by Component 2025 & 2033
- Figure 47: Middle East & Africa US Health Information Exchange Industry Revenue Share (%), by Component 2025 & 2033
- Figure 48: Middle East & Africa US Health Information Exchange Industry Revenue (Million), by Country 2025 & 2033
- Figure 49: Middle East & Africa US Health Information Exchange Industry Revenue Share (%), by Country 2025 & 2033
- Figure 50: Asia Pacific US Health Information Exchange Industry Revenue (Million), by Implementation Model 2025 & 2033
- Figure 51: Asia Pacific US Health Information Exchange Industry Revenue Share (%), by Implementation Model 2025 & 2033
- Figure 52: Asia Pacific US Health Information Exchange Industry Revenue (Million), by Setup Type 2025 & 2033
- Figure 53: Asia Pacific US Health Information Exchange Industry Revenue Share (%), by Setup Type 2025 & 2033
- Figure 54: Asia Pacific US Health Information Exchange Industry Revenue (Million), by Application 2025 & 2033
- Figure 55: Asia Pacific US Health Information Exchange Industry Revenue Share (%), by Application 2025 & 2033
- Figure 56: Asia Pacific US Health Information Exchange Industry Revenue (Million), by Exchange Type 2025 & 2033
- Figure 57: Asia Pacific US Health Information Exchange Industry Revenue Share (%), by Exchange Type 2025 & 2033
- Figure 58: Asia Pacific US Health Information Exchange Industry Revenue (Million), by Component 2025 & 2033
- Figure 59: Asia Pacific US Health Information Exchange Industry Revenue Share (%), by Component 2025 & 2033
- Figure 60: Asia Pacific US Health Information Exchange Industry Revenue (Million), by Country 2025 & 2033
- Figure 61: Asia Pacific US Health Information Exchange Industry Revenue Share (%), by Country 2025 & 2033
List of Tables
- Table 1: Global US Health Information Exchange Industry Revenue Million Forecast, by Implementation Model 2020 & 2033
- Table 2: Global US Health Information Exchange Industry Revenue Million Forecast, by Setup Type 2020 & 2033
- Table 3: Global US Health Information Exchange Industry Revenue Million Forecast, by Application 2020 & 2033
- Table 4: Global US Health Information Exchange Industry Revenue Million Forecast, by Exchange Type 2020 & 2033
- Table 5: Global US Health Information Exchange Industry Revenue Million Forecast, by Component 2020 & 2033
- Table 6: Global US Health Information Exchange Industry Revenue Million Forecast, by Region 2020 & 2033
- Table 7: Global US Health Information Exchange Industry Revenue Million Forecast, by Implementation Model 2020 & 2033
- Table 8: Global US Health Information Exchange Industry Revenue Million Forecast, by Setup Type 2020 & 2033
- Table 9: Global US Health Information Exchange Industry Revenue Million Forecast, by Application 2020 & 2033
- Table 10: Global US Health Information Exchange Industry Revenue Million Forecast, by Exchange Type 2020 & 2033
- Table 11: Global US Health Information Exchange Industry Revenue Million Forecast, by Component 2020 & 2033
- Table 12: Global US Health Information Exchange Industry Revenue Million Forecast, by Country 2020 & 2033
- Table 13: United States US Health Information Exchange Industry Revenue (Million) Forecast, by Application 2020 & 2033
- Table 14: Canada US Health Information Exchange Industry Revenue (Million) Forecast, by Application 2020 & 2033
- Table 15: Mexico US Health Information Exchange Industry Revenue (Million) Forecast, by Application 2020 & 2033
- Table 16: Global US Health Information Exchange Industry Revenue Million Forecast, by Implementation Model 2020 & 2033
- Table 17: Global US Health Information Exchange Industry Revenue Million Forecast, by Setup Type 2020 & 2033
- Table 18: Global US Health Information Exchange Industry Revenue Million Forecast, by Application 2020 & 2033
- Table 19: Global US Health Information Exchange Industry Revenue Million Forecast, by Exchange Type 2020 & 2033
- Table 20: Global US Health Information Exchange Industry Revenue Million Forecast, by Component 2020 & 2033
- Table 21: Global US Health Information Exchange Industry Revenue Million Forecast, by Country 2020 & 2033
- Table 22: Brazil US Health Information Exchange Industry Revenue (Million) Forecast, by Application 2020 & 2033
- Table 23: Argentina US Health Information Exchange Industry Revenue (Million) Forecast, by Application 2020 & 2033
- Table 24: Rest of South America US Health Information Exchange Industry Revenue (Million) Forecast, by Application 2020 & 2033
- Table 25: Global US Health Information Exchange Industry Revenue Million Forecast, by Implementation Model 2020 & 2033
- Table 26: Global US Health Information Exchange Industry Revenue Million Forecast, by Setup Type 2020 & 2033
- Table 27: Global US Health Information Exchange Industry Revenue Million Forecast, by Application 2020 & 2033
- Table 28: Global US Health Information Exchange Industry Revenue Million Forecast, by Exchange Type 2020 & 2033
- Table 29: Global US Health Information Exchange Industry Revenue Million Forecast, by Component 2020 & 2033
- Table 30: Global US Health Information Exchange Industry Revenue Million Forecast, by Country 2020 & 2033
- Table 31: United Kingdom US Health Information Exchange Industry Revenue (Million) Forecast, by Application 2020 & 2033
- Table 32: Germany US Health Information Exchange Industry Revenue (Million) Forecast, by Application 2020 & 2033
- Table 33: France US Health Information Exchange Industry Revenue (Million) Forecast, by Application 2020 & 2033
- Table 34: Italy US Health Information Exchange Industry Revenue (Million) Forecast, by Application 2020 & 2033
- Table 35: Spain US Health Information Exchange Industry Revenue (Million) Forecast, by Application 2020 & 2033
- Table 36: Russia US Health Information Exchange Industry Revenue (Million) Forecast, by Application 2020 & 2033
- Table 37: Benelux US Health Information Exchange Industry Revenue (Million) Forecast, by Application 2020 & 2033
- Table 38: Nordics US Health Information Exchange Industry Revenue (Million) Forecast, by Application 2020 & 2033
- Table 39: Rest of Europe US Health Information Exchange Industry Revenue (Million) Forecast, by Application 2020 & 2033
- Table 40: Global US Health Information Exchange Industry Revenue Million Forecast, by Implementation Model 2020 & 2033
- Table 41: Global US Health Information Exchange Industry Revenue Million Forecast, by Setup Type 2020 & 2033
- Table 42: Global US Health Information Exchange Industry Revenue Million Forecast, by Application 2020 & 2033
- Table 43: Global US Health Information Exchange Industry Revenue Million Forecast, by Exchange Type 2020 & 2033
- Table 44: Global US Health Information Exchange Industry Revenue Million Forecast, by Component 2020 & 2033
- Table 45: Global US Health Information Exchange Industry Revenue Million Forecast, by Country 2020 & 2033
- Table 46: Turkey US Health Information Exchange Industry Revenue (Million) Forecast, by Application 2020 & 2033
- Table 47: Israel US Health Information Exchange Industry Revenue (Million) Forecast, by Application 2020 & 2033
- Table 48: GCC US Health Information Exchange Industry Revenue (Million) Forecast, by Application 2020 & 2033
- Table 49: North Africa US Health Information Exchange Industry Revenue (Million) Forecast, by Application 2020 & 2033
- Table 50: South Africa US Health Information Exchange Industry Revenue (Million) Forecast, by Application 2020 & 2033
- Table 51: Rest of Middle East & Africa US Health Information Exchange Industry Revenue (Million) Forecast, by Application 2020 & 2033
- Table 52: Global US Health Information Exchange Industry Revenue Million Forecast, by Implementation Model 2020 & 2033
- Table 53: Global US Health Information Exchange Industry Revenue Million Forecast, by Setup Type 2020 & 2033
- Table 54: Global US Health Information Exchange Industry Revenue Million Forecast, by Application 2020 & 2033
- Table 55: Global US Health Information Exchange Industry Revenue Million Forecast, by Exchange Type 2020 & 2033
- Table 56: Global US Health Information Exchange Industry Revenue Million Forecast, by Component 2020 & 2033
- Table 57: Global US Health Information Exchange Industry Revenue Million Forecast, by Country 2020 & 2033
- Table 58: China US Health Information Exchange Industry Revenue (Million) Forecast, by Application 2020 & 2033
- Table 59: India US Health Information Exchange Industry Revenue (Million) Forecast, by Application 2020 & 2033
- Table 60: Japan US Health Information Exchange Industry Revenue (Million) Forecast, by Application 2020 & 2033
- Table 61: South Korea US Health Information Exchange Industry Revenue (Million) Forecast, by Application 2020 & 2033
- Table 62: ASEAN US Health Information Exchange Industry Revenue (Million) Forecast, by Application 2020 & 2033
- Table 63: Oceania US Health Information Exchange Industry Revenue (Million) Forecast, by Application 2020 & 2033
- Table 64: Rest of Asia Pacific US Health Information Exchange Industry Revenue (Million) Forecast, by Application 2020 & 2033
Frequently Asked Questions
1. What is the projected Compound Annual Growth Rate (CAGR) of the US Health Information Exchange Industry?
The projected CAGR is approximately 12.12%.
2. Which companies are prominent players in the US Health Information Exchange Industry?
Key companies in the market include Eclinical Works, Mckesson Corporation, Infor Inc, Epic Corporation Inc, mpro, Cerner Corporation, Optum Inc, Allscripts Healthcare Solutions Inc, Nextgen Healthcare Information Systems LLC, Newgen Software Technologies, Conifer Health Solutions, Medicity Inc.
3. What are the main segments of the US Health Information Exchange Industry?
The market segments include Implementation Model, Setup Type, Application, Exchange Type, Component.
4. Can you provide details about the market size?
The market size is estimated to be USD 0.66 Million as of 2022.
5. What are some drivers contributing to market growth?
Increasing Demand for Electronic Health Records Resulting in the Expansion of the Market; Government Support via Various Programs and Incentives; Reduction in Healthcare Cost and Improved Efficacy.
6. What are the notable trends driving market growth?
The Decentralized/Federated Model is Expected to Hold a Notable Market Share Over the Forecast Period.
7. Are there any restraints impacting market growth?
Huge Initial Infrastructural Investment and Slow Return on Investment; Data Privacy and Security Concerns.
8. Can you provide examples of recent developments in the market?
In October 2022, Mpowered Health launched its xChange, the United States consumer-mediated healthcare data exchange. The exchange enables health plans, health systems, and other healthcare organizations to request and obtain medical records from consumers with their consent.
9. What pricing options are available for accessing the report?
Pricing options include single-user, multi-user, and enterprise licenses priced at USD 3800, USD 4500, and USD 5800 respectively.
10. Is the market size provided in terms of value or volume?
The market size is provided in terms of value, measured in Million.
11. Are there any specific market keywords associated with the report?
Yes, the market keyword associated with the report is "US Health Information Exchange Industry," which aids in identifying and referencing the specific market segment covered.
12. How do I determine which pricing option suits my needs best?
The pricing options vary based on user requirements and access needs. Individual users may opt for single-user licenses, while businesses requiring broader access may choose multi-user or enterprise licenses for cost-effective access to the report.
13. Are there any additional resources or data provided in the US Health Information Exchange Industry report?
While the report offers comprehensive insights, it's advisable to review the specific contents or supplementary materials provided to ascertain if additional resources or data are available.
14. How can I stay updated on further developments or reports in the US Health Information Exchange Industry?
To stay informed about further developments, trends, and reports in the US Health Information Exchange Industry, consider subscribing to industry newsletters, following relevant companies and organizations, or regularly checking reputable industry news sources and publications.
Methodology
Step 1 - Identification of Relevant Samples Size from Population Database


Step 2 - Approaches for Defining Global Market Size (Value, Volume* & Price*)

Note*: In applicable scenarios
Step 3 - Data Sources
Primary Research
- Web Analytics
- Survey Reports
- Research Institute
- Latest Research Reports
- Opinion Leaders
Secondary Research
- Annual Reports
- White Paper
- Latest Press Release
- Industry Association
- Paid Database
- Investor Presentations

Step 4 - Data Triangulation
Involves using different sources of information in order to increase the validity of a study
These sources are likely to be stakeholders in a program - participants, other researchers, program staff, other community members, and so on.
Then we put all data in single framework & apply various statistical tools to find out the dynamic on the market.
During the analysis stage, feedback from the stakeholder groups would be compared to determine areas of agreement as well as areas of divergence