
Key Insights
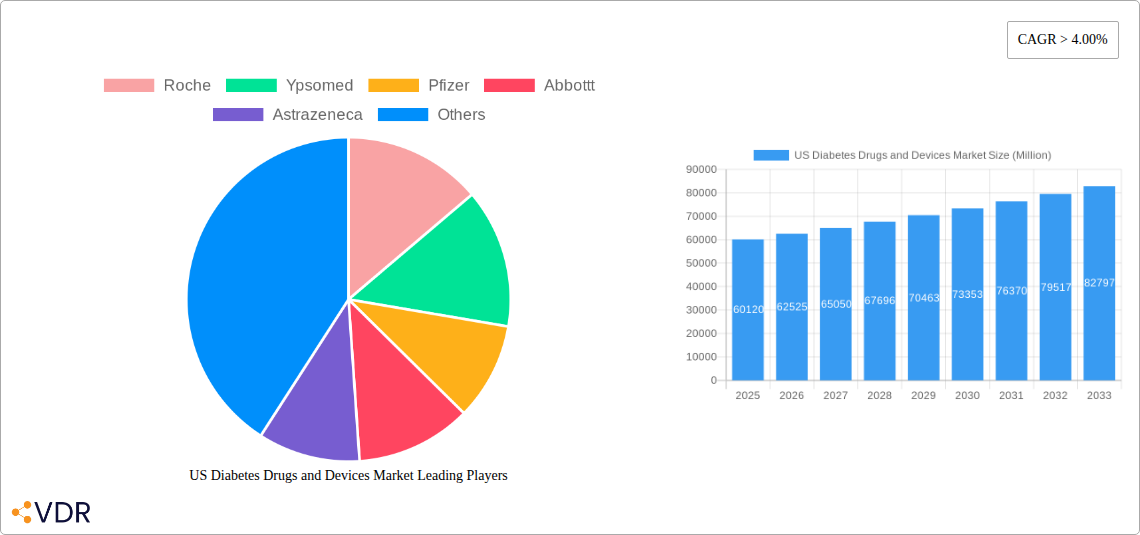
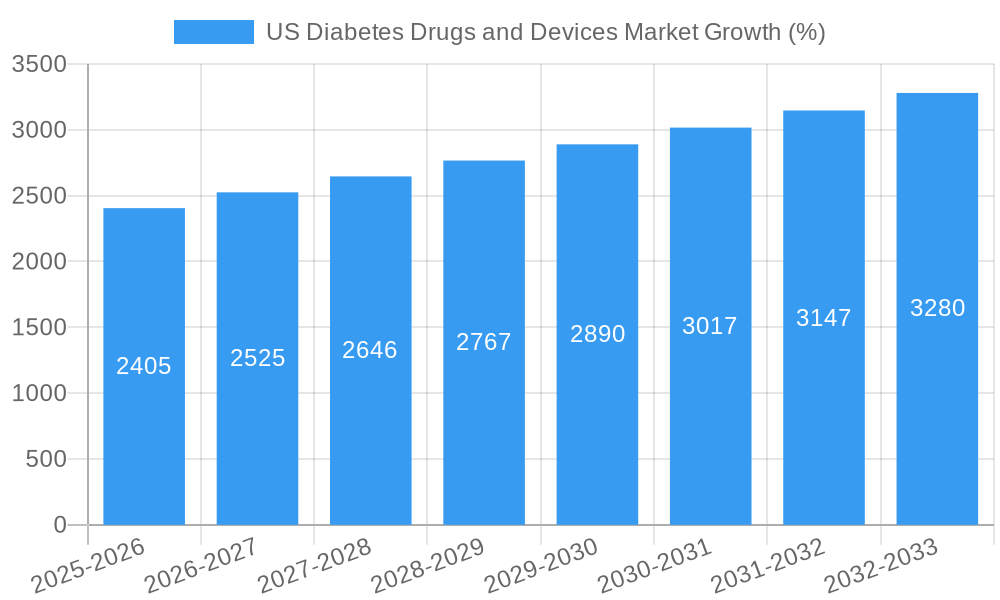
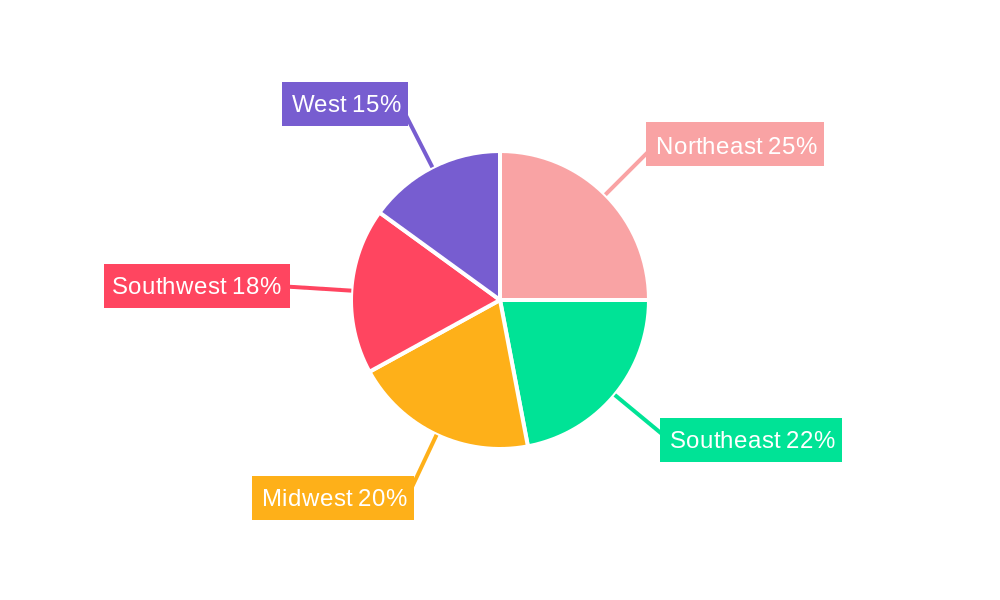
The US diabetes drugs and devices market, valued at $60.12 billion in 2025, is projected to experience robust growth, exceeding a 4% compound annual growth rate (CAGR) from 2025 to 2033. This expansion is driven by several key factors. The rising prevalence of diabetes, particularly type 2 diabetes, among the aging US population fuels significant demand for both drug therapies and advanced monitoring devices. Technological advancements in continuous glucose monitoring (CGM) systems, offering improved accuracy and convenience, are significantly impacting market growth. Furthermore, the increasing adoption of insulin pumps and other sophisticated management devices contributes to market expansion. The market is segmented by device types (monitoring devices, CGM systems, insulin pumps), drug categories (oral anti-diabetes drugs, insulin, non-insulin injectables, combination therapies), and distribution channels (online and offline). Major players like Roche, Abbott, Novo Nordisk, and Medtronic are actively involved in research and development, continuously introducing innovative products to cater to the evolving needs of the diabetic population. Competition is fierce, with companies focusing on improving product efficacy, affordability, and patient accessibility. While cost constraints and potential side effects of certain medications present some limitations, the overall market outlook remains positive, driven by the urgent need for effective diabetes management and the ongoing innovation in this critical healthcare sector. The geographical segmentation reveals strong market penetration across all US regions, with variations likely influenced by demographic factors and healthcare infrastructure.
The market's future growth will be further shaped by the increasing awareness of diabetes management and proactive healthcare initiatives. Government regulations and insurance coverage policies concerning diabetes care will also play a significant role. Furthermore, the integration of telehealth and remote patient monitoring technologies, coupled with the expansion of personalized medicine approaches tailored to specific patient profiles, are expected to boost market growth in the coming years. Expansion into new treatment modalities and the development of preventative therapies will create additional opportunities for market participants. Sustained investment in research and development is likely to produce advanced therapies that can improve outcomes and reduce the overall burden of managing diabetes in the United States.
US Diabetes Drugs and Devices Market: A Comprehensive Report (2019-2033)
This in-depth report provides a comprehensive analysis of the US Diabetes Drugs and Devices Market, encompassing market dynamics, growth trends, dominant segments, and key players. With a study period spanning 2019-2033, a base year of 2025, and a forecast period of 2025-2033, this report offers invaluable insights for industry professionals, investors, and stakeholders. The market is segmented into Devices (Monitoring Devices, Continuous Blood Glucose Monitoring, Management Devices) and Drugs (Oral Anti-Diabetes Drugs, Insulin Drugs, Combination Drugs, Non-Insulin Injectable Drugs), further analyzed across online and offline distribution channels. The total market size in 2025 is estimated at xx Million units.
US Diabetes Drugs and Devices Market Market Dynamics & Structure
The US diabetes drugs and devices market is characterized by a high degree of consolidation among key players, with Roche, Novo Nordisk, Eli Lilly, and Abbott holding significant market shares (combined market share xx%). Technological innovation, particularly in continuous glucose monitoring (CGM) and insulin delivery systems, is a major growth driver. Stringent regulatory frameworks imposed by the FDA significantly influence product development and market entry. Competitive pressure arises from the availability of generic drugs and the emergence of innovative therapies. The market also faces challenges from high treatment costs and patient adherence issues. The aging population and increasing prevalence of diabetes are significant market expansion factors. M&A activity has been relatively robust in recent years, with xx major deals reported between 2019 and 2024, indicating a drive toward market consolidation and expansion of product portfolios.
- Market Concentration: Highly concentrated, with top players holding xx% market share in 2025.
- Technological Innovation: CGMs and advanced insulin delivery systems are key innovation drivers.
- Regulatory Framework: FDA regulations significantly impact market entry and product development.
- Competitive Substitutes: Generic drugs and emerging therapies create competitive pressures.
- End-User Demographics: Aging population and rising diabetes prevalence fuel market growth.
- M&A Trends: xx major deals between 2019-2024 indicate consolidation and expansion.
US Diabetes Drugs and Devices Market Growth Trends & Insights
The US diabetes drugs and devices market has experienced substantial growth over the historical period (2019-2024), with a CAGR of xx%. This growth is projected to continue during the forecast period (2025-2033), albeit at a slightly moderated pace, with a projected CAGR of xx%. The increasing prevalence of type 2 diabetes, particularly among obese and sedentary individuals, is a key factor driving market expansion. Technological advancements, such as the development of more accurate and user-friendly CGM systems and advanced insulin pumps, have significantly improved diabetes management and patient outcomes, boosting market adoption rates. Consumer behavior shifts toward personalized medicine and telehealth are also influencing market growth. Market penetration of CGM devices is expected to reach xx% by 2033, indicating significant growth potential.
Dominant Regions, Countries, or Segments in US Diabetes Drugs and Devices Market
The largest segment within the US diabetes drugs and devices market in 2025 is the Insulin Drugs segment, representing xx% of the total market. This is followed by the Oral Anti-Diabetes Drugs segment, holding a xx% market share. Geographically, the highest growth is expected from the Southern states, driven by higher prevalence rates and improving access to healthcare. The offline distribution channel continues to dominate, although the online segment shows strong growth potential.
- Dominant Segment: Insulin Drugs (xx% market share in 2025)
- High Growth Segment: Online distribution channel (projected xx% CAGR 2025-2033)
- Geographic Growth Driver: Southern states (high prevalence rates and access to healthcare)
- Key Drivers: Increasing prevalence of diabetes, technological advancements, and improved access to care
US Diabetes Drugs and Devices Market Product Landscape
The market offers a diverse range of products, from traditional oral medications and insulin injections to advanced CGM systems and insulin pumps. Recent innovations focus on improving ease of use, accuracy, and integration with mobile health applications. The unique selling propositions of many products involve features such as improved accuracy, smaller device sizes, and seamless data integration. Technological advancements include the development of closed-loop systems that automatically adjust insulin delivery based on CGM readings, enhancing patient safety and convenience.
Key Drivers, Barriers & Challenges in US Diabetes Drugs and Devices Market
Key Drivers:
- Increasing prevalence of diabetes
- Technological advancements in CGM and insulin delivery systems
- Growing adoption of telehealth and personalized medicine
Challenges:
- High cost of treatment, creating access barriers
- Patient adherence issues
- Intense competition among established and emerging players
- Regulatory hurdles and lengthy approval processes for new products
Emerging Opportunities in US Diabetes Drugs and Devices Market
Emerging opportunities lie in the development of personalized medicine approaches to diabetes management, leveraging data analytics and artificial intelligence to tailor treatment plans. The expansion of telehealth services is another key area of growth, providing remote monitoring and support to patients. Furthermore, the development of innovative therapies, including stem cell-based treatments and new drug classes, present significant opportunities.
Growth Accelerators in the US Diabetes Drugs and Devices Market Industry
Long-term growth will be accelerated by continuous innovation in drug delivery systems, the increasing adoption of integrated solutions, such as CGM systems linked to insulin pumps, and the development of more convenient and user-friendly devices. Strategic partnerships between pharmaceutical companies and technology firms will further drive market expansion. The expansion into underserved populations and markets will also significantly contribute to the long-term growth of the US diabetes drugs and devices market.
Key Players Shaping the US Diabetes Drugs and Devices Market Market
- Roche
- Ypsomed
- Pfizer
- Abbott
- AstraZeneca
- Eli Lilly
- Sanofi
- Novartis
- Medtronic
- Tandem
- Insulet
- Novo Nordisk
- Dexcom
Notable Milestones in US Diabetes Drugs and Devices Market Sector
- June 2023: FDA approval of Lantidra, an allogeneic pancreatic islet cellular therapy for type 1 diabetes. This represents a significant advancement in treatment options for severe cases.
- January 2023: FDA approval of Bexagliflozin (Brenzavvy), a new oral SGLT2 inhibitor for type 2 diabetes. This expands treatment options for patients with type 2 diabetes.
In-Depth US Diabetes Drugs and Devices Market Market Outlook
The future of the US diabetes drugs and devices market is promising, driven by ongoing technological advancements, increasing prevalence of diabetes, and a growing focus on improved patient outcomes. Strategic partnerships, expansion into untapped markets, and the development of personalized medicine approaches will create substantial growth opportunities for companies in the sector. The market is poised for continued expansion, driven by innovations in both drug therapies and advanced medical devices.
US Diabetes Drugs and Devices Market Segmentation
-
1. Devices
-
1.1. Monitoring Devices
- 1.1.1. Self-monitoring Blood Glucose Devices
- 1.1.2. Continuous Blood Glucose Monitoring
-
1.2. Management Devices
- 1.2.1. Insulin Pump
- 1.2.2. Insulin Syringes
- 1.2.3. Insulin Cartridges
- 1.2.4. Disposable Pens
-
1.1. Monitoring Devices
-
2. Drugs
- 2.1. Oral Anti-Diabetes Drugs
- 2.2. Insulin Drugs
- 2.3. Combination Drugs
- 2.4. Non-Insulin Injectable Drugs
US Diabetes Drugs and Devices Market Segmentation By Geography
-
1. North America
- 1.1. United States
- 1.2. Canada
- 1.3. Mexico
-
2. South America
- 2.1. Brazil
- 2.2. Argentina
- 2.3. Rest of South America
-
3. Europe
- 3.1. United Kingdom
- 3.2. Germany
- 3.3. France
- 3.4. Italy
- 3.5. Spain
- 3.6. Russia
- 3.7. Benelux
- 3.8. Nordics
- 3.9. Rest of Europe
-
4. Middle East & Africa
- 4.1. Turkey
- 4.2. Israel
- 4.3. GCC
- 4.4. North Africa
- 4.5. South Africa
- 4.6. Rest of Middle East & Africa
-
5. Asia Pacific
- 5.1. China
- 5.2. India
- 5.3. Japan
- 5.4. South Korea
- 5.5. ASEAN
- 5.6. Oceania
- 5.7. Rest of Asia Pacific
US Diabetes Drugs and Devices Market REPORT HIGHLIGHTS
| Aspects | Details |
|---|---|
| Study Period | 2019-2033 |
| Base Year | 2024 |
| Estimated Year | 2025 |
| Forecast Period | 2025-2033 |
| Historical Period | 2019-2024 |
| Growth Rate | CAGR of > 4.00% from 2019-2033 |
| Segmentation |
|
Table of Contents
- 1. Introduction
- 1.1. Research Scope
- 1.2. Market Segmentation
- 1.3. Research Methodology
- 1.4. Definitions and Assumptions
- 2. Executive Summary
- 2.1. Introduction
- 3. Market Dynamics
- 3.1. Introduction
- 3.2. Market Drivers
- 3.2.1. ; The Rise in Global Prevalence of Cases of Obesity due to Modern Sedentary Lifestyles; Rise in Awareness and Disposable Income in Developed Economies
- 3.3. Market Restrains
- 3.3.1 ; Highly Cost of Branded Products in Emerging Countries; Severe Adverse Associated with Medication Including Seizures
- 3.3.2 Suicidal Attempts and Even Death; Adoption of Traditional Yoga and Herbal Products
- 3.4. Market Trends
- 3.4.1. Continuous Glucose Monitoring Segment is Expected to Witness Highest Growth Rate Over the Forecast Period
- 4. Market Factor Analysis
- 4.1. Porters Five Forces
- 4.2. Supply/Value Chain
- 4.3. PESTEL analysis
- 4.4. Market Entropy
- 4.5. Patent/Trademark Analysis
- 5. US Diabetes Drugs and Devices Market Analysis, Insights and Forecast, 2019-2031
- 5.1. Market Analysis, Insights and Forecast - by Devices
- 5.1.1. Monitoring Devices
- 5.1.1.1. Self-monitoring Blood Glucose Devices
- 5.1.1.2. Continuous Blood Glucose Monitoring
- 5.1.2. Management Devices
- 5.1.2.1. Insulin Pump
- 5.1.2.2. Insulin Syringes
- 5.1.2.3. Insulin Cartridges
- 5.1.2.4. Disposable Pens
- 5.1.1. Monitoring Devices
- 5.2. Market Analysis, Insights and Forecast - by Drugs
- 5.2.1. Oral Anti-Diabetes Drugs
- 5.2.2. Insulin Drugs
- 5.2.3. Combination Drugs
- 5.2.4. Non-Insulin Injectable Drugs
- 5.3. Market Analysis, Insights and Forecast - by Region
- 5.3.1. North America
- 5.3.2. South America
- 5.3.3. Europe
- 5.3.4. Middle East & Africa
- 5.3.5. Asia Pacific
- 5.1. Market Analysis, Insights and Forecast - by Devices
- 6. North America US Diabetes Drugs and Devices Market Analysis, Insights and Forecast, 2019-2031
- 6.1. Market Analysis, Insights and Forecast - by Devices
- 6.1.1. Monitoring Devices
- 6.1.1.1. Self-monitoring Blood Glucose Devices
- 6.1.1.2. Continuous Blood Glucose Monitoring
- 6.1.2. Management Devices
- 6.1.2.1. Insulin Pump
- 6.1.2.2. Insulin Syringes
- 6.1.2.3. Insulin Cartridges
- 6.1.2.4. Disposable Pens
- 6.1.1. Monitoring Devices
- 6.2. Market Analysis, Insights and Forecast - by Drugs
- 6.2.1. Oral Anti-Diabetes Drugs
- 6.2.2. Insulin Drugs
- 6.2.3. Combination Drugs
- 6.2.4. Non-Insulin Injectable Drugs
- 6.1. Market Analysis, Insights and Forecast - by Devices
- 7. South America US Diabetes Drugs and Devices Market Analysis, Insights and Forecast, 2019-2031
- 7.1. Market Analysis, Insights and Forecast - by Devices
- 7.1.1. Monitoring Devices
- 7.1.1.1. Self-monitoring Blood Glucose Devices
- 7.1.1.2. Continuous Blood Glucose Monitoring
- 7.1.2. Management Devices
- 7.1.2.1. Insulin Pump
- 7.1.2.2. Insulin Syringes
- 7.1.2.3. Insulin Cartridges
- 7.1.2.4. Disposable Pens
- 7.1.1. Monitoring Devices
- 7.2. Market Analysis, Insights and Forecast - by Drugs
- 7.2.1. Oral Anti-Diabetes Drugs
- 7.2.2. Insulin Drugs
- 7.2.3. Combination Drugs
- 7.2.4. Non-Insulin Injectable Drugs
- 7.1. Market Analysis, Insights and Forecast - by Devices
- 8. Europe US Diabetes Drugs and Devices Market Analysis, Insights and Forecast, 2019-2031
- 8.1. Market Analysis, Insights and Forecast - by Devices
- 8.1.1. Monitoring Devices
- 8.1.1.1. Self-monitoring Blood Glucose Devices
- 8.1.1.2. Continuous Blood Glucose Monitoring
- 8.1.2. Management Devices
- 8.1.2.1. Insulin Pump
- 8.1.2.2. Insulin Syringes
- 8.1.2.3. Insulin Cartridges
- 8.1.2.4. Disposable Pens
- 8.1.1. Monitoring Devices
- 8.2. Market Analysis, Insights and Forecast - by Drugs
- 8.2.1. Oral Anti-Diabetes Drugs
- 8.2.2. Insulin Drugs
- 8.2.3. Combination Drugs
- 8.2.4. Non-Insulin Injectable Drugs
- 8.1. Market Analysis, Insights and Forecast - by Devices
- 9. Middle East & Africa US Diabetes Drugs and Devices Market Analysis, Insights and Forecast, 2019-2031
- 9.1. Market Analysis, Insights and Forecast - by Devices
- 9.1.1. Monitoring Devices
- 9.1.1.1. Self-monitoring Blood Glucose Devices
- 9.1.1.2. Continuous Blood Glucose Monitoring
- 9.1.2. Management Devices
- 9.1.2.1. Insulin Pump
- 9.1.2.2. Insulin Syringes
- 9.1.2.3. Insulin Cartridges
- 9.1.2.4. Disposable Pens
- 9.1.1. Monitoring Devices
- 9.2. Market Analysis, Insights and Forecast - by Drugs
- 9.2.1. Oral Anti-Diabetes Drugs
- 9.2.2. Insulin Drugs
- 9.2.3. Combination Drugs
- 9.2.4. Non-Insulin Injectable Drugs
- 9.1. Market Analysis, Insights and Forecast - by Devices
- 10. Asia Pacific US Diabetes Drugs and Devices Market Analysis, Insights and Forecast, 2019-2031
- 10.1. Market Analysis, Insights and Forecast - by Devices
- 10.1.1. Monitoring Devices
- 10.1.1.1. Self-monitoring Blood Glucose Devices
- 10.1.1.2. Continuous Blood Glucose Monitoring
- 10.1.2. Management Devices
- 10.1.2.1. Insulin Pump
- 10.1.2.2. Insulin Syringes
- 10.1.2.3. Insulin Cartridges
- 10.1.2.4. Disposable Pens
- 10.1.1. Monitoring Devices
- 10.2. Market Analysis, Insights and Forecast - by Drugs
- 10.2.1. Oral Anti-Diabetes Drugs
- 10.2.2. Insulin Drugs
- 10.2.3. Combination Drugs
- 10.2.4. Non-Insulin Injectable Drugs
- 10.1. Market Analysis, Insights and Forecast - by Devices
- 11. Northeast US Diabetes Drugs and Devices Market Analysis, Insights and Forecast, 2019-2031
- 12. Southeast US Diabetes Drugs and Devices Market Analysis, Insights and Forecast, 2019-2031
- 13. Midwest US Diabetes Drugs and Devices Market Analysis, Insights and Forecast, 2019-2031
- 14. Southwest US Diabetes Drugs and Devices Market Analysis, Insights and Forecast, 2019-2031
- 15. West US Diabetes Drugs and Devices Market Analysis, Insights and Forecast, 2019-2031
- 16. Competitive Analysis
- 16.1. Market Share Analysis 2024
- 16.2. Company Profiles
- 16.2.1 Roche
- 16.2.1.1. Overview
- 16.2.1.2. Products
- 16.2.1.3. SWOT Analysis
- 16.2.1.4. Recent Developments
- 16.2.1.5. Financials (Based on Availability)
- 16.2.2 Ypsomed
- 16.2.2.1. Overview
- 16.2.2.2. Products
- 16.2.2.3. SWOT Analysis
- 16.2.2.4. Recent Developments
- 16.2.2.5. Financials (Based on Availability)
- 16.2.3 Pfizer
- 16.2.3.1. Overview
- 16.2.3.2. Products
- 16.2.3.3. SWOT Analysis
- 16.2.3.4. Recent Developments
- 16.2.3.5. Financials (Based on Availability)
- 16.2.4 Abbottt
- 16.2.4.1. Overview
- 16.2.4.2. Products
- 16.2.4.3. SWOT Analysis
- 16.2.4.4. Recent Developments
- 16.2.4.5. Financials (Based on Availability)
- 16.2.5 Astrazeneca
- 16.2.5.1. Overview
- 16.2.5.2. Products
- 16.2.5.3. SWOT Analysis
- 16.2.5.4. Recent Developments
- 16.2.5.5. Financials (Based on Availability)
- 16.2.6 Eli Lilly
- 16.2.6.1. Overview
- 16.2.6.2. Products
- 16.2.6.3. SWOT Analysis
- 16.2.6.4. Recent Developments
- 16.2.6.5. Financials (Based on Availability)
- 16.2.7 Sanofi
- 16.2.7.1. Overview
- 16.2.7.2. Products
- 16.2.7.3. SWOT Analysis
- 16.2.7.4. Recent Developments
- 16.2.7.5. Financials (Based on Availability)
- 16.2.8 Novartis
- 16.2.8.1. Overview
- 16.2.8.2. Products
- 16.2.8.3. SWOT Analysis
- 16.2.8.4. Recent Developments
- 16.2.8.5. Financials (Based on Availability)
- 16.2.9 Medtronic
- 16.2.9.1. Overview
- 16.2.9.2. Products
- 16.2.9.3. SWOT Analysis
- 16.2.9.4. Recent Developments
- 16.2.9.5. Financials (Based on Availability)
- 16.2.10 Tandem
- 16.2.10.1. Overview
- 16.2.10.2. Products
- 16.2.10.3. SWOT Analysis
- 16.2.10.4. Recent Developments
- 16.2.10.5. Financials (Based on Availability)
- 16.2.11 Insulet
- 16.2.11.1. Overview
- 16.2.11.2. Products
- 16.2.11.3. SWOT Analysis
- 16.2.11.4. Recent Developments
- 16.2.11.5. Financials (Based on Availability)
- 16.2.12 Novo Nordisk
- 16.2.12.1. Overview
- 16.2.12.2. Products
- 16.2.12.3. SWOT Analysis
- 16.2.12.4. Recent Developments
- 16.2.12.5. Financials (Based on Availability)
- 16.2.13 Dexcom
- 16.2.13.1. Overview
- 16.2.13.2. Products
- 16.2.13.3. SWOT Analysis
- 16.2.13.4. Recent Developments
- 16.2.13.5. Financials (Based on Availability)
- 16.2.1 Roche
List of Figures
- Figure 1: US Diabetes Drugs and Devices Market Revenue Breakdown (Million, %) by Product 2024 & 2032
- Figure 2: US Diabetes Drugs and Devices Market Share (%) by Company 2024
List of Tables
- Table 1: US Diabetes Drugs and Devices Market Revenue Million Forecast, by Region 2019 & 2032
- Table 2: US Diabetes Drugs and Devices Market Volume K Unit Forecast, by Region 2019 & 2032
- Table 3: US Diabetes Drugs and Devices Market Revenue Million Forecast, by Devices 2019 & 2032
- Table 4: US Diabetes Drugs and Devices Market Volume K Unit Forecast, by Devices 2019 & 2032
- Table 5: US Diabetes Drugs and Devices Market Revenue Million Forecast, by Drugs 2019 & 2032
- Table 6: US Diabetes Drugs and Devices Market Volume K Unit Forecast, by Drugs 2019 & 2032
- Table 7: US Diabetes Drugs and Devices Market Revenue Million Forecast, by Region 2019 & 2032
- Table 8: US Diabetes Drugs and Devices Market Volume K Unit Forecast, by Region 2019 & 2032
- Table 9: US Diabetes Drugs and Devices Market Revenue Million Forecast, by Country 2019 & 2032
- Table 10: US Diabetes Drugs and Devices Market Volume K Unit Forecast, by Country 2019 & 2032
- Table 11: Northeast US Diabetes Drugs and Devices Market Revenue (Million) Forecast, by Application 2019 & 2032
- Table 12: Northeast US Diabetes Drugs and Devices Market Volume (K Unit) Forecast, by Application 2019 & 2032
- Table 13: Southeast US Diabetes Drugs and Devices Market Revenue (Million) Forecast, by Application 2019 & 2032
- Table 14: Southeast US Diabetes Drugs and Devices Market Volume (K Unit) Forecast, by Application 2019 & 2032
- Table 15: Midwest US Diabetes Drugs and Devices Market Revenue (Million) Forecast, by Application 2019 & 2032
- Table 16: Midwest US Diabetes Drugs and Devices Market Volume (K Unit) Forecast, by Application 2019 & 2032
- Table 17: Southwest US Diabetes Drugs and Devices Market Revenue (Million) Forecast, by Application 2019 & 2032
- Table 18: Southwest US Diabetes Drugs and Devices Market Volume (K Unit) Forecast, by Application 2019 & 2032
- Table 19: West US Diabetes Drugs and Devices Market Revenue (Million) Forecast, by Application 2019 & 2032
- Table 20: West US Diabetes Drugs and Devices Market Volume (K Unit) Forecast, by Application 2019 & 2032
- Table 21: US Diabetes Drugs and Devices Market Revenue Million Forecast, by Devices 2019 & 2032
- Table 22: US Diabetes Drugs and Devices Market Volume K Unit Forecast, by Devices 2019 & 2032
- Table 23: US Diabetes Drugs and Devices Market Revenue Million Forecast, by Drugs 2019 & 2032
- Table 24: US Diabetes Drugs and Devices Market Volume K Unit Forecast, by Drugs 2019 & 2032
- Table 25: US Diabetes Drugs and Devices Market Revenue Million Forecast, by Country 2019 & 2032
- Table 26: US Diabetes Drugs and Devices Market Volume K Unit Forecast, by Country 2019 & 2032
- Table 27: United States US Diabetes Drugs and Devices Market Revenue (Million) Forecast, by Application 2019 & 2032
- Table 28: United States US Diabetes Drugs and Devices Market Volume (K Unit) Forecast, by Application 2019 & 2032
- Table 29: Canada US Diabetes Drugs and Devices Market Revenue (Million) Forecast, by Application 2019 & 2032
- Table 30: Canada US Diabetes Drugs and Devices Market Volume (K Unit) Forecast, by Application 2019 & 2032
- Table 31: Mexico US Diabetes Drugs and Devices Market Revenue (Million) Forecast, by Application 2019 & 2032
- Table 32: Mexico US Diabetes Drugs and Devices Market Volume (K Unit) Forecast, by Application 2019 & 2032
- Table 33: US Diabetes Drugs and Devices Market Revenue Million Forecast, by Devices 2019 & 2032
- Table 34: US Diabetes Drugs and Devices Market Volume K Unit Forecast, by Devices 2019 & 2032
- Table 35: US Diabetes Drugs and Devices Market Revenue Million Forecast, by Drugs 2019 & 2032
- Table 36: US Diabetes Drugs and Devices Market Volume K Unit Forecast, by Drugs 2019 & 2032
- Table 37: US Diabetes Drugs and Devices Market Revenue Million Forecast, by Country 2019 & 2032
- Table 38: US Diabetes Drugs and Devices Market Volume K Unit Forecast, by Country 2019 & 2032
- Table 39: Brazil US Diabetes Drugs and Devices Market Revenue (Million) Forecast, by Application 2019 & 2032
- Table 40: Brazil US Diabetes Drugs and Devices Market Volume (K Unit) Forecast, by Application 2019 & 2032
- Table 41: Argentina US Diabetes Drugs and Devices Market Revenue (Million) Forecast, by Application 2019 & 2032
- Table 42: Argentina US Diabetes Drugs and Devices Market Volume (K Unit) Forecast, by Application 2019 & 2032
- Table 43: Rest of South America US Diabetes Drugs and Devices Market Revenue (Million) Forecast, by Application 2019 & 2032
- Table 44: Rest of South America US Diabetes Drugs and Devices Market Volume (K Unit) Forecast, by Application 2019 & 2032
- Table 45: US Diabetes Drugs and Devices Market Revenue Million Forecast, by Devices 2019 & 2032
- Table 46: US Diabetes Drugs and Devices Market Volume K Unit Forecast, by Devices 2019 & 2032
- Table 47: US Diabetes Drugs and Devices Market Revenue Million Forecast, by Drugs 2019 & 2032
- Table 48: US Diabetes Drugs and Devices Market Volume K Unit Forecast, by Drugs 2019 & 2032
- Table 49: US Diabetes Drugs and Devices Market Revenue Million Forecast, by Country 2019 & 2032
- Table 50: US Diabetes Drugs and Devices Market Volume K Unit Forecast, by Country 2019 & 2032
- Table 51: United Kingdom US Diabetes Drugs and Devices Market Revenue (Million) Forecast, by Application 2019 & 2032
- Table 52: United Kingdom US Diabetes Drugs and Devices Market Volume (K Unit) Forecast, by Application 2019 & 2032
- Table 53: Germany US Diabetes Drugs and Devices Market Revenue (Million) Forecast, by Application 2019 & 2032
- Table 54: Germany US Diabetes Drugs and Devices Market Volume (K Unit) Forecast, by Application 2019 & 2032
- Table 55: France US Diabetes Drugs and Devices Market Revenue (Million) Forecast, by Application 2019 & 2032
- Table 56: France US Diabetes Drugs and Devices Market Volume (K Unit) Forecast, by Application 2019 & 2032
- Table 57: Italy US Diabetes Drugs and Devices Market Revenue (Million) Forecast, by Application 2019 & 2032
- Table 58: Italy US Diabetes Drugs and Devices Market Volume (K Unit) Forecast, by Application 2019 & 2032
- Table 59: Spain US Diabetes Drugs and Devices Market Revenue (Million) Forecast, by Application 2019 & 2032
- Table 60: Spain US Diabetes Drugs and Devices Market Volume (K Unit) Forecast, by Application 2019 & 2032
- Table 61: Russia US Diabetes Drugs and Devices Market Revenue (Million) Forecast, by Application 2019 & 2032
- Table 62: Russia US Diabetes Drugs and Devices Market Volume (K Unit) Forecast, by Application 2019 & 2032
- Table 63: Benelux US Diabetes Drugs and Devices Market Revenue (Million) Forecast, by Application 2019 & 2032
- Table 64: Benelux US Diabetes Drugs and Devices Market Volume (K Unit) Forecast, by Application 2019 & 2032
- Table 65: Nordics US Diabetes Drugs and Devices Market Revenue (Million) Forecast, by Application 2019 & 2032
- Table 66: Nordics US Diabetes Drugs and Devices Market Volume (K Unit) Forecast, by Application 2019 & 2032
- Table 67: Rest of Europe US Diabetes Drugs and Devices Market Revenue (Million) Forecast, by Application 2019 & 2032
- Table 68: Rest of Europe US Diabetes Drugs and Devices Market Volume (K Unit) Forecast, by Application 2019 & 2032
- Table 69: US Diabetes Drugs and Devices Market Revenue Million Forecast, by Devices 2019 & 2032
- Table 70: US Diabetes Drugs and Devices Market Volume K Unit Forecast, by Devices 2019 & 2032
- Table 71: US Diabetes Drugs and Devices Market Revenue Million Forecast, by Drugs 2019 & 2032
- Table 72: US Diabetes Drugs and Devices Market Volume K Unit Forecast, by Drugs 2019 & 2032
- Table 73: US Diabetes Drugs and Devices Market Revenue Million Forecast, by Country 2019 & 2032
- Table 74: US Diabetes Drugs and Devices Market Volume K Unit Forecast, by Country 2019 & 2032
- Table 75: Turkey US Diabetes Drugs and Devices Market Revenue (Million) Forecast, by Application 2019 & 2032
- Table 76: Turkey US Diabetes Drugs and Devices Market Volume (K Unit) Forecast, by Application 2019 & 2032
- Table 77: Israel US Diabetes Drugs and Devices Market Revenue (Million) Forecast, by Application 2019 & 2032
- Table 78: Israel US Diabetes Drugs and Devices Market Volume (K Unit) Forecast, by Application 2019 & 2032
- Table 79: GCC US Diabetes Drugs and Devices Market Revenue (Million) Forecast, by Application 2019 & 2032
- Table 80: GCC US Diabetes Drugs and Devices Market Volume (K Unit) Forecast, by Application 2019 & 2032
- Table 81: North Africa US Diabetes Drugs and Devices Market Revenue (Million) Forecast, by Application 2019 & 2032
- Table 82: North Africa US Diabetes Drugs and Devices Market Volume (K Unit) Forecast, by Application 2019 & 2032
- Table 83: South Africa US Diabetes Drugs and Devices Market Revenue (Million) Forecast, by Application 2019 & 2032
- Table 84: South Africa US Diabetes Drugs and Devices Market Volume (K Unit) Forecast, by Application 2019 & 2032
- Table 85: Rest of Middle East & Africa US Diabetes Drugs and Devices Market Revenue (Million) Forecast, by Application 2019 & 2032
- Table 86: Rest of Middle East & Africa US Diabetes Drugs and Devices Market Volume (K Unit) Forecast, by Application 2019 & 2032
- Table 87: US Diabetes Drugs and Devices Market Revenue Million Forecast, by Devices 2019 & 2032
- Table 88: US Diabetes Drugs and Devices Market Volume K Unit Forecast, by Devices 2019 & 2032
- Table 89: US Diabetes Drugs and Devices Market Revenue Million Forecast, by Drugs 2019 & 2032
- Table 90: US Diabetes Drugs and Devices Market Volume K Unit Forecast, by Drugs 2019 & 2032
- Table 91: US Diabetes Drugs and Devices Market Revenue Million Forecast, by Country 2019 & 2032
- Table 92: US Diabetes Drugs and Devices Market Volume K Unit Forecast, by Country 2019 & 2032
- Table 93: China US Diabetes Drugs and Devices Market Revenue (Million) Forecast, by Application 2019 & 2032
- Table 94: China US Diabetes Drugs and Devices Market Volume (K Unit) Forecast, by Application 2019 & 2032
- Table 95: India US Diabetes Drugs and Devices Market Revenue (Million) Forecast, by Application 2019 & 2032
- Table 96: India US Diabetes Drugs and Devices Market Volume (K Unit) Forecast, by Application 2019 & 2032
- Table 97: Japan US Diabetes Drugs and Devices Market Revenue (Million) Forecast, by Application 2019 & 2032
- Table 98: Japan US Diabetes Drugs and Devices Market Volume (K Unit) Forecast, by Application 2019 & 2032
- Table 99: South Korea US Diabetes Drugs and Devices Market Revenue (Million) Forecast, by Application 2019 & 2032
- Table 100: South Korea US Diabetes Drugs and Devices Market Volume (K Unit) Forecast, by Application 2019 & 2032
- Table 101: ASEAN US Diabetes Drugs and Devices Market Revenue (Million) Forecast, by Application 2019 & 2032
- Table 102: ASEAN US Diabetes Drugs and Devices Market Volume (K Unit) Forecast, by Application 2019 & 2032
- Table 103: Oceania US Diabetes Drugs and Devices Market Revenue (Million) Forecast, by Application 2019 & 2032
- Table 104: Oceania US Diabetes Drugs and Devices Market Volume (K Unit) Forecast, by Application 2019 & 2032
- Table 105: Rest of Asia Pacific US Diabetes Drugs and Devices Market Revenue (Million) Forecast, by Application 2019 & 2032
- Table 106: Rest of Asia Pacific US Diabetes Drugs and Devices Market Volume (K Unit) Forecast, by Application 2019 & 2032
Frequently Asked Questions
1. What is the projected Compound Annual Growth Rate (CAGR) of the US Diabetes Drugs and Devices Market?
The projected CAGR is approximately > 4.00%.
2. Which companies are prominent players in the US Diabetes Drugs and Devices Market?
Key companies in the market include Roche, Ypsomed, Pfizer, Abbottt, Astrazeneca, Eli Lilly, Sanofi, Novartis, Medtronic, Tandem, Insulet, Novo Nordisk, Dexcom.
3. What are the main segments of the US Diabetes Drugs and Devices Market?
The market segments include Devices, Drugs.
4. Can you provide details about the market size?
The market size is estimated to be USD 60.12 Million as of 2022.
5. What are some drivers contributing to market growth?
; The Rise in Global Prevalence of Cases of Obesity due to Modern Sedentary Lifestyles; Rise in Awareness and Disposable Income in Developed Economies.
6. What are the notable trends driving market growth?
Continuous Glucose Monitoring Segment is Expected to Witness Highest Growth Rate Over the Forecast Period.
7. Are there any restraints impacting market growth?
; Highly Cost of Branded Products in Emerging Countries; Severe Adverse Associated with Medication Including Seizures. Suicidal Attempts and Even Death; Adoption of Traditional Yoga and Herbal Products.
8. Can you provide examples of recent developments in the market?
June 2023: The initial allogeneic (donor) pancreatic islet cellular therapy made from deceased donor pancreatic cells, Lantidra, has been sanctioned by the U.S. Food and Drug Administration for the management of type 1 diabetes. Lantidra is specifically authorized for adults with type 1 diabetes who are incapable of achieving target glycated hemoglobin (average blood glucose levels) due to recurrent episodes of severe hypoglycemia (low blood sugar) despite intensive diabetes management and education.
9. What pricing options are available for accessing the report?
Pricing options include single-user, multi-user, and enterprise licenses priced at USD 3800, USD 4500, and USD 5800 respectively.
10. Is the market size provided in terms of value or volume?
The market size is provided in terms of value, measured in Million and volume, measured in K Unit.
11. Are there any specific market keywords associated with the report?
Yes, the market keyword associated with the report is "US Diabetes Drugs and Devices Market," which aids in identifying and referencing the specific market segment covered.
12. How do I determine which pricing option suits my needs best?
The pricing options vary based on user requirements and access needs. Individual users may opt for single-user licenses, while businesses requiring broader access may choose multi-user or enterprise licenses for cost-effective access to the report.
13. Are there any additional resources or data provided in the US Diabetes Drugs and Devices Market report?
While the report offers comprehensive insights, it's advisable to review the specific contents or supplementary materials provided to ascertain if additional resources or data are available.
14. How can I stay updated on further developments or reports in the US Diabetes Drugs and Devices Market?
To stay informed about further developments, trends, and reports in the US Diabetes Drugs and Devices Market, consider subscribing to industry newsletters, following relevant companies and organizations, or regularly checking reputable industry news sources and publications.
Methodology
Step 1 - Identification of Relevant Samples Size from Population Database


Step 2 - Approaches for Defining Global Market Size (Value, Volume* & Price*)

Note*: In applicable scenarios
Step 3 - Data Sources
Primary Research
- Web Analytics
- Survey Reports
- Research Institute
- Latest Research Reports
- Opinion Leaders
Secondary Research
- Annual Reports
- White Paper
- Latest Press Release
- Industry Association
- Paid Database
- Investor Presentations

Step 4 - Data Triangulation
Involves using different sources of information in order to increase the validity of a study
These sources are likely to be stakeholders in a program - participants, other researchers, program staff, other community members, and so on.
Then we put all data in single framework & apply various statistical tools to find out the dynamic on the market.
During the analysis stage, feedback from the stakeholder groups would be compared to determine areas of agreement as well as areas of divergence


