

Key Insights
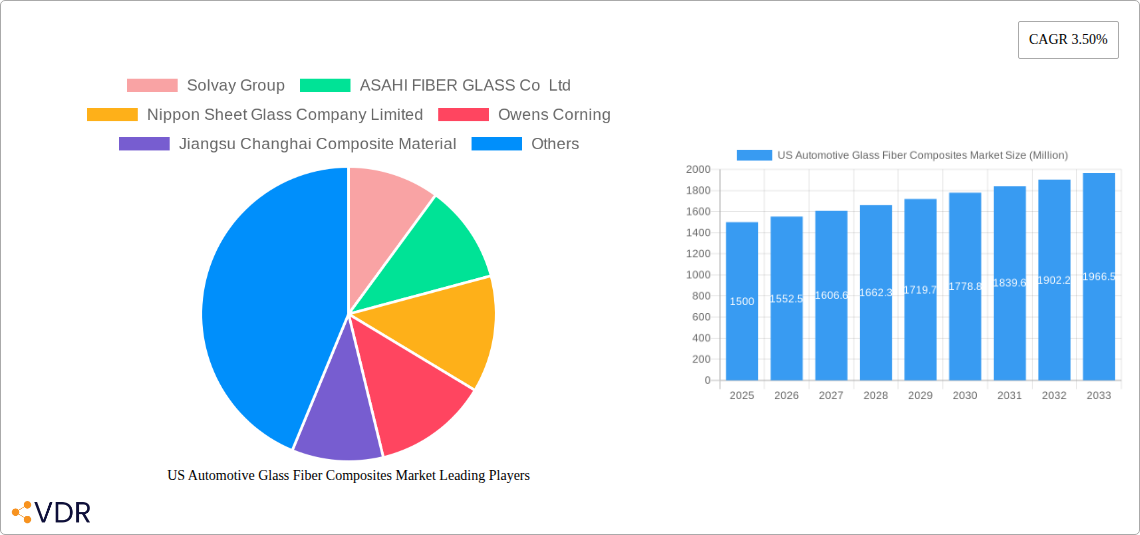
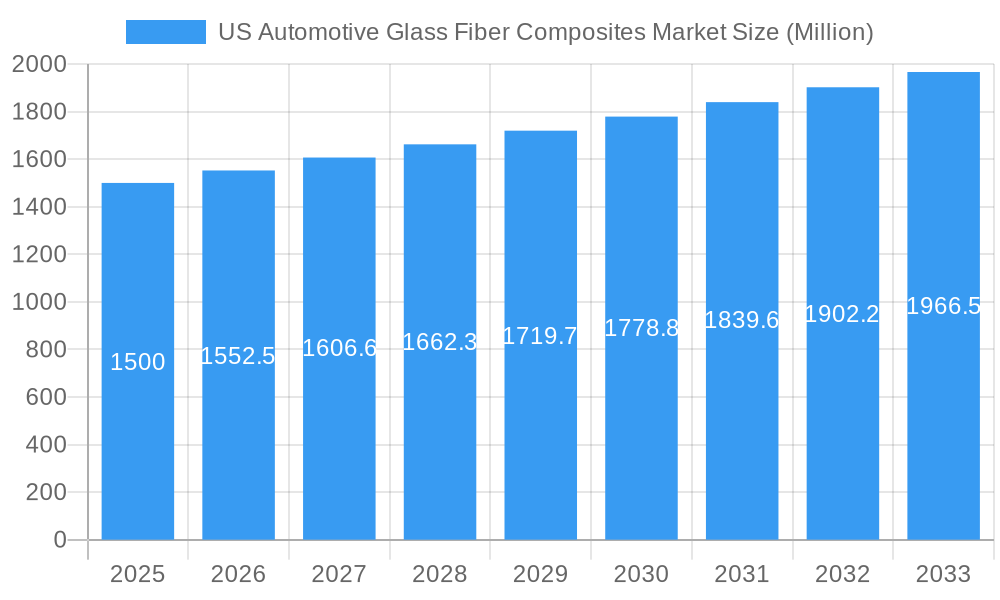
The US automotive glass fiber composites market is experiencing robust growth, driven by the increasing demand for lightweight vehicles to improve fuel efficiency and reduce emissions. The market's Compound Annual Growth Rate (CAGR) of 3.50% from 2019-2033 indicates a steady expansion, with significant potential for further acceleration. Key market segments include short, long, and continuous fiber thermoplastics (SFT, LFT, CFT), each catering to specific automotive applications. The application landscape is diverse, ranging from interior and exterior components to structural assemblies and powertrain parts. Major players like Solvay Group, Asahi Fiber Glass, and Owens Corning are driving innovation and shaping market dynamics through technological advancements and strategic partnerships. The Northeast and West regions of the US currently hold a larger market share due to established automotive manufacturing hubs and robust supply chains. However, growth is anticipated across all regions, fueled by increasing investments in automotive manufacturing facilities and the rising adoption of lightweight materials. The market's growth is further bolstered by stringent government regulations promoting fuel efficiency and the increasing popularity of electric vehicles, which necessitate lightweight components.
US Automotive Glass Fiber Composites Market Market Size (In Billion)
While the market presents significant opportunities, certain challenges remain. These include fluctuations in raw material prices, the complexity of manufacturing processes, and the need for continuous research and development to improve the performance and cost-effectiveness of glass fiber composites. Nevertheless, the long-term outlook remains positive, underpinned by continuous advancements in material science and a strong focus on sustainable manufacturing practices within the automotive industry. The market is expected to witness a further consolidation of major players, with increased focus on mergers and acquisitions to enhance market share and technological capabilities. The increasing demand for customized solutions and advanced composite materials will continue to propel the market's growth trajectory.
US Automotive Glass Fiber Composites Market Company Market Share
US Automotive Glass Fiber Composites Market: A Comprehensive Report (2019-2033)
This in-depth report provides a comprehensive analysis of the US Automotive Glass Fiber Composites Market, offering valuable insights for industry professionals, investors, and strategic decision-makers. The study covers the period from 2019 to 2033, with a base year of 2025 and a forecast period of 2025-2033. The report segments the market by intermediate type (Short Fiber Thermoplastic (SFT), Long Fiber Thermoplastic (LFT), Continuous Fiber Thermoplastic (CFT), Other Intermediate Types) and application type (Interior, Exterior, Structural Assembly, Power-train Components, Other Application Types). Key players analyzed include Solvay Group, ASAHI FIBER GLASS Co Ltd, Nippon Sheet Glass Company Limited, Owens Corning, Jiangsu Changhai Composite Material, 3B (Braj Binani Group), Veplas Group, and SAERTEX GmbH & Co KG. The market size is presented in million units.
US Automotive Glass Fiber Composites Market Market Dynamics & Structure
This section delves into the intricate dynamics shaping the US automotive glass fiber composites market. We analyze market concentration, revealing the market share held by leading players like Solvay Group and Owens Corning. Technological innovation, particularly in lightweighting materials and manufacturing processes, is a key driver. The report examines the impact of regulatory frameworks, such as fuel efficiency standards and emissions regulations, which are pushing the adoption of lightweight composites. The competitive landscape is explored, including the presence of substitute materials like carbon fiber and the implications of mergers and acquisitions (M&A) activity within the industry. We estimate that xx M&A deals occurred in the historical period (2019-2024), contributing to market consolidation. Innovation barriers, such as high upfront investment costs and the complexity of composite manufacturing, are also addressed.
- Market Concentration: Highly concentrated with top 5 players holding xx% market share in 2024.
- Technological Innovation: Focus on lightweighting, improved mechanical properties, and cost reduction.
- Regulatory Landscape: Stringent fuel efficiency standards drive demand for lightweight materials.
- Competitive Substitutes: Carbon fiber and other advanced materials pose competitive pressure.
- M&A Activity: xx M&A deals in 2019-2024, leading to market consolidation.
- End-User Demographics: Primarily driven by passenger vehicle and light commercial vehicle manufacturers.
US Automotive Glass Fiber Composites Market Growth Trends & Insights
This section provides a comprehensive analysis of the US Automotive Glass Fiber Composites Market, leveraging detailed market research data to illustrate market size evolution, adoption rates across diverse vehicle segments, and the profound impact of technological disruptions. We project a Compound Annual Growth Rate (CAGR) of **[Insert Specific CAGR Here, e.g., 7.5%]%** during the forecast period (2025-2033). This growth is primarily fueled by the escalating demand for fuel-efficient vehicles, driven by both consumer preference and stringent regulatory mandates, alongside the expanding integration of advanced driver-assistance systems (ADAS) which benefit from the inherent lightweight and performance characteristics of composites. Our analysis delves into the increasing integration of composites in critical structural components, examining market penetration rates for various applications and the observable consumer behavior shifts that increasingly favor lightweight, durable, and safer vehicles. Specific, quantifiable metrics such as the projected CAGR, detailed market penetration rates for different application types (e.g., body-in-white, interior components, under-the-hood parts), and the quantifiable impact of technological advancements on overall market size are meticulously presented. A detailed qualitative analysis further explores nuanced consumer preferences, highlighting the growing importance of enhanced vehicle safety features and optimized fuel economy in purchasing decisions.
Dominant Regions, Countries, or Segments in US Automotive Glass Fiber Composites Market
This section meticulously identifies the leading regions, countries, and market segments that are currently shaping and will continue to drive the US Automotive Glass Fiber Composites Market. Our analysis reveals that the **[Insert Dominant Region Here, e.g., Midwest]** region commands a dominant position in the market, propelled by a deeply entrenched and robust automotive manufacturing sector and significantly supportive government policies aimed at fostering innovation and advanced manufacturing. Among specific application types, the **structural assembly** segment is projected to exhibit the highest growth potential. This surge is directly attributable to the increasing strategic use of composites in lightweight vehicle bodies, chassis components, and other critical load-bearing structures, leading to substantial weight reduction and performance enhancements. Similarly, within intermediate types, the demand for **Long Fiber Thermoplastic (LFT)** composites is projected to decisively surpass that of Short Fiber Thermoplastic (SFT) by the year 2033, owing to LFT's superior mechanical properties and suitability for more demanding structural applications.
- Key Drivers: Sustained strong automotive production volumes in the [Insert Dominant Region Here, e.g., Midwest] region, supportive government incentives promoting the adoption of lightweight vehicle technologies, and a continuously increasing consumer and regulatory demand for improved fuel efficiency across the fleet.
- Dominant Segments: The Structural Assembly (Application Type) and LFT (Intermediate Type) segments are identified as exhibiting the most significant growth potential due to their critical role in achieving vehicle lightweighting and performance objectives.
- Market Share & Growth Potential: A detailed, granular breakdown of market share by geographical region, specific application type, and intermediate type is provided. This includes granularly projected growth rates and market penetration forecasts, offering a clear view of future market dynamics.
US Automotive Glass Fiber Composites Market Product Landscape
The US automotive glass fiber composites market showcases continuous innovation in material properties, manufacturing processes, and applications. Products are engineered to meet stringent automotive standards for durability, strength, and weight reduction. Manufacturers are focusing on developing high-performance composites with tailored properties to meet specific vehicle component requirements. This includes advancements in resin systems and fiber architectures to enhance performance and reduce production costs. Unique selling propositions often involve improved material strength-to-weight ratios and superior durability compared to traditional materials.
Key Drivers, Barriers & Challenges in US Automotive Glass Fiber Composites Market
Key Drivers: The relentless and increasing demand for lighter, more fuel-efficient vehicles is a paramount driver of market expansion. This is further amplified by increasingly stringent environmental regulations and proactive government incentives designed to accelerate the adoption of advanced composite materials. Concurrently, continuous technological advancements in material science are playing a crucial role, enabling the development of higher-performance, more cost-effective, and more easily processable composite solutions.
Challenges: Despite the strong growth trajectory, significant hurdles remain. High material costs when compared to traditional materials like steel and aluminum continue to present a barrier. The inherent complexity of manufacturing processes for certain composite components and potential supply chain disruptions, particularly concerning the availability and consistent quality of raw materials, pose considerable challenges. Furthermore, navigating regulatory hurdles and facing intense competition from alternative lightweighting materials, most notably carbon fiber composites, also act as restraints on market growth. We estimate that pervasive supply chain issues, particularly those experienced in 2022, resulted in an estimated **[Insert Specific Percentage Here, e.g., 10%]%** reduction in potential production capacity.
Emerging Opportunities in US Automotive Glass Fiber Composites Market
Emerging opportunities include the growing adoption of electric and hybrid vehicles, which require lightweight materials to extend range and improve efficiency. The use of composites in advanced driver-assistance systems (ADAS) and autonomous driving technologies presents a significant market potential. The development of bio-based and recycled composites addresses sustainability concerns and opens new avenues for growth.
Growth Accelerators in the US Automotive Glass Fiber Composites Market Industry
Technological breakthroughs in material science, such as the development of stronger and lighter composites, will significantly accelerate market growth. Strategic partnerships between material suppliers and automotive manufacturers are also crucial for driving innovation and market expansion. Investments in advanced manufacturing technologies, such as automated fiber placement and resin transfer molding, will enhance production efficiency and lower costs.
Key Players Shaping the US Automotive Glass Fiber Composites Market Market
- Solvay Group
- ASAHI FIBER GLASS Co Ltd
- Nippon Sheet Glass Company Limited
- Owens Corning
- Jiangsu Changhai Composite Material
- 3B (Braj Binani Group)
- Veplas Group
- SAERTEX GmbH & Co KG
Notable Milestones in US Automotive Glass Fiber Composites Market Sector
- 2020: Introduction of a new high-strength glass fiber by Owens Corning.
- 2021: Solvay Group announced a strategic partnership with an automotive manufacturer for composite component development.
- 2022: Significant investments in new composite manufacturing facilities by several key players.
- 2023: Launch of a new bio-based composite material by a leading supplier.
In-Depth US Automotive Glass Fiber Composites Market Market Outlook
The US automotive glass fiber composites market is demonstrably poised for sustained and robust growth in the coming years. This expansion will be primarily driven by the unyielding demand for lightweight, fuel-efficient, and environmentally conscious vehicles. The ongoing adoption of cutting-edge advanced manufacturing technologies, coupled with significant investments in the research and development of novel composite materials with enhanced properties, will further accelerate market expansion. Strategic partnerships, collaborative ventures, and substantial investments in R&D initiatives will play an absolutely crucial role in shaping the future trajectory of this dynamic and rapidly evolving market, thereby unlocking substantial and lucrative opportunities for all industry stakeholders.
US Automotive Glass Fiber Composites Market Segmentation
-
1. Intermediate Type
- 1.1. Short Fiber Thermoplastic (SFT)
- 1.2. Long Fiber Thermoplastic (LFT)
- 1.3. Continuous Fiber Thermoplastic (CFT)
- 1.4. Other Intermediate Types
-
2. Application Type
- 2.1. Interior
- 2.2. Exterior
- 2.3. Structural Assembly
- 2.4. Power-train Components
- 2.5. Other Application Types
US Automotive Glass Fiber Composites Market Segmentation By Geography
-
1. North America
- 1.1. United States
- 1.2. Canada
- 1.3. Mexico
-
2. South America
- 2.1. Brazil
- 2.2. Argentina
- 2.3. Rest of South America
-
3. Europe
- 3.1. United Kingdom
- 3.2. Germany
- 3.3. France
- 3.4. Italy
- 3.5. Spain
- 3.6. Russia
- 3.7. Benelux
- 3.8. Nordics
- 3.9. Rest of Europe
-
4. Middle East & Africa
- 4.1. Turkey
- 4.2. Israel
- 4.3. GCC
- 4.4. North Africa
- 4.5. South Africa
- 4.6. Rest of Middle East & Africa
-
5. Asia Pacific
- 5.1. China
- 5.2. India
- 5.3. Japan
- 5.4. South Korea
- 5.5. ASEAN
- 5.6. Oceania
- 5.7. Rest of Asia Pacific
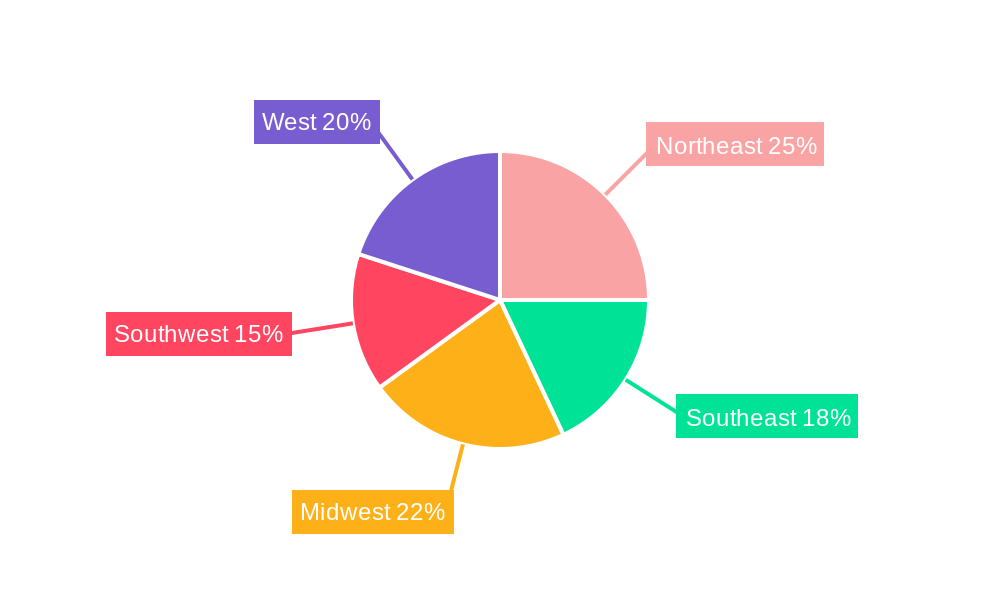
US Automotive Glass Fiber Composites Market Regional Market Share
Geographic Coverage of US Automotive Glass Fiber Composites Market
US Automotive Glass Fiber Composites Market REPORT HIGHLIGHTS
| Aspects | Details |
|---|---|
| Study Period | 2020-2034 |
| Base Year | 2025 |
| Estimated Year | 2026 |
| Forecast Period | 2026-2034 |
| Historical Period | 2020-2025 |
| Growth Rate | CAGR of 3.50% from 2020-2034 |
| Segmentation |
|
Table of Contents
- 1. Introduction
- 1.1. Research Scope
- 1.2. Market Segmentation
- 1.3. Research Objective
- 1.4. Definitions and Assumptions
- 2. Executive Summary
- 2.1. Market Snapshot
- 3. Market Dynamics
- 3.1. Market Drivers
- 3.2. Market Restrains
- 3.3. Market Trends
- 3.4. Market Opportunities
- 4. Market Factor Analysis
- 4.1. Porters Five Forces
- 4.1.1. Bargaining Power of Suppliers
- 4.1.2. Bargaining Power of Buyers
- 4.1.3. Threat of New Entrants
- 4.1.4. Threat of Substitutes
- 4.1.5. Competitive Rivalry
- 4.2. PESTEL analysis
- 4.3. BCG Analysis
- 4.3.1. Stars (High Growth, High Market Share)
- 4.3.2. Cash Cows (Low Growth, High Market Share)
- 4.3.3. Question Mark (High Growth, Low Market Share)
- 4.3.4. Dogs (Low Growth, Low Market Share)
- 4.4. Ansoff Matrix Analysis
- 4.5. Supply Chain Analysis
- 4.6. Regulatory Landscape
- 4.7. Current Market Potential and Opportunity Assessment (TAM–SAM–SOM Framework)
- 4.8. VDR Analyst Note
- 4.1. Porters Five Forces
- 5. Market Analysis, Insights and Forecast 2021-2033
- 5.1. Market Analysis, Insights and Forecast - by Intermediate Type
- 5.1.1. Short Fiber Thermoplastic (SFT)
- 5.1.2. Long Fiber Thermoplastic (LFT)
- 5.1.3. Continuous Fiber Thermoplastic (CFT)
- 5.1.4. Other Intermediate Types
- 5.2. Market Analysis, Insights and Forecast - by Application Type
- 5.2.1. Interior
- 5.2.2. Exterior
- 5.2.3. Structural Assembly
- 5.2.4. Power-train Components
- 5.2.5. Other Application Types
- 5.3. Market Analysis, Insights and Forecast - by Region
- 5.3.1. North America
- 5.3.2. South America
- 5.3.3. Europe
- 5.3.4. Middle East & Africa
- 5.3.5. Asia Pacific
- 5.1. Market Analysis, Insights and Forecast - by Intermediate Type
- 6. Global US Automotive Glass Fiber Composites Market Analysis, Insights and Forecast, 2021-2033
- 6.1. Market Analysis, Insights and Forecast - by Intermediate Type
- 6.1.1. Short Fiber Thermoplastic (SFT)
- 6.1.2. Long Fiber Thermoplastic (LFT)
- 6.1.3. Continuous Fiber Thermoplastic (CFT)
- 6.1.4. Other Intermediate Types
- 6.2. Market Analysis, Insights and Forecast - by Application Type
- 6.2.1. Interior
- 6.2.2. Exterior
- 6.2.3. Structural Assembly
- 6.2.4. Power-train Components
- 6.2.5. Other Application Types
- 6.1. Market Analysis, Insights and Forecast - by Intermediate Type
- 7. North America US Automotive Glass Fiber Composites Market Analysis, Insights and Forecast, 2021-2033
- 7.1. Market Analysis, Insights and Forecast - by Intermediate Type
- 7.1.1. Short Fiber Thermoplastic (SFT)
- 7.1.2. Long Fiber Thermoplastic (LFT)
- 7.1.3. Continuous Fiber Thermoplastic (CFT)
- 7.1.4. Other Intermediate Types
- 7.2. Market Analysis, Insights and Forecast - by Application Type
- 7.2.1. Interior
- 7.2.2. Exterior
- 7.2.3. Structural Assembly
- 7.2.4. Power-train Components
- 7.2.5. Other Application Types
- 7.1. Market Analysis, Insights and Forecast - by Intermediate Type
- 8. South America US Automotive Glass Fiber Composites Market Analysis, Insights and Forecast, 2021-2033
- 8.1. Market Analysis, Insights and Forecast - by Intermediate Type
- 8.1.1. Short Fiber Thermoplastic (SFT)
- 8.1.2. Long Fiber Thermoplastic (LFT)
- 8.1.3. Continuous Fiber Thermoplastic (CFT)
- 8.1.4. Other Intermediate Types
- 8.2. Market Analysis, Insights and Forecast - by Application Type
- 8.2.1. Interior
- 8.2.2. Exterior
- 8.2.3. Structural Assembly
- 8.2.4. Power-train Components
- 8.2.5. Other Application Types
- 8.1. Market Analysis, Insights and Forecast - by Intermediate Type
- 9. Europe US Automotive Glass Fiber Composites Market Analysis, Insights and Forecast, 2021-2033
- 9.1. Market Analysis, Insights and Forecast - by Intermediate Type
- 9.1.1. Short Fiber Thermoplastic (SFT)
- 9.1.2. Long Fiber Thermoplastic (LFT)
- 9.1.3. Continuous Fiber Thermoplastic (CFT)
- 9.1.4. Other Intermediate Types
- 9.2. Market Analysis, Insights and Forecast - by Application Type
- 9.2.1. Interior
- 9.2.2. Exterior
- 9.2.3. Structural Assembly
- 9.2.4. Power-train Components
- 9.2.5. Other Application Types
- 9.1. Market Analysis, Insights and Forecast - by Intermediate Type
- 10. Middle East & Africa US Automotive Glass Fiber Composites Market Analysis, Insights and Forecast, 2021-2033
- 10.1. Market Analysis, Insights and Forecast - by Intermediate Type
- 10.1.1. Short Fiber Thermoplastic (SFT)
- 10.1.2. Long Fiber Thermoplastic (LFT)
- 10.1.3. Continuous Fiber Thermoplastic (CFT)
- 10.1.4. Other Intermediate Types
- 10.2. Market Analysis, Insights and Forecast - by Application Type
- 10.2.1. Interior
- 10.2.2. Exterior
- 10.2.3. Structural Assembly
- 10.2.4. Power-train Components
- 10.2.5. Other Application Types
- 10.1. Market Analysis, Insights and Forecast - by Intermediate Type
- 11. Asia Pacific US Automotive Glass Fiber Composites Market Analysis, Insights and Forecast, 2021-2033
- 11.1. Market Analysis, Insights and Forecast - by Intermediate Type
- 11.1.1. Short Fiber Thermoplastic (SFT)
- 11.1.2. Long Fiber Thermoplastic (LFT)
- 11.1.3. Continuous Fiber Thermoplastic (CFT)
- 11.1.4. Other Intermediate Types
- 11.2. Market Analysis, Insights and Forecast - by Application Type
- 11.2.1. Interior
- 11.2.2. Exterior
- 11.2.3. Structural Assembly
- 11.2.4. Power-train Components
- 11.2.5. Other Application Types
- 11.1. Market Analysis, Insights and Forecast - by Intermediate Type
- 12. Competitive Analysis
- 12.1. Company Profiles
- 12.1.1 Solvay Group
- 12.1.1.1. Company Overview
- 12.1.1.2. Products
- 12.1.1.3. Company Financials
- 12.1.1.4. SWOT Analysis
- 12.1.2 ASAHI FIBER GLASS Co Ltd
- 12.1.2.1. Company Overview
- 12.1.2.2. Products
- 12.1.2.3. Company Financials
- 12.1.2.4. SWOT Analysis
- 12.1.3 Nippon Sheet Glass Company Limited
- 12.1.3.1. Company Overview
- 12.1.3.2. Products
- 12.1.3.3. Company Financials
- 12.1.3.4. SWOT Analysis
- 12.1.4 Owens Corning
- 12.1.4.1. Company Overview
- 12.1.4.2. Products
- 12.1.4.3. Company Financials
- 12.1.4.4. SWOT Analysis
- 12.1.5 Jiangsu Changhai Composite Material
- 12.1.5.1. Company Overview
- 12.1.5.2. Products
- 12.1.5.3. Company Financials
- 12.1.5.4. SWOT Analysis
- 12.1.6 3B (Braj Binani Group)
- 12.1.6.1. Company Overview
- 12.1.6.2. Products
- 12.1.6.3. Company Financials
- 12.1.6.4. SWOT Analysis
- 12.1.7 Veplas Group
- 12.1.7.1. Company Overview
- 12.1.7.2. Products
- 12.1.7.3. Company Financials
- 12.1.7.4. SWOT Analysis
- 12.1.8 SAERTEX GmbH & Co KG
- 12.1.8.1. Company Overview
- 12.1.8.2. Products
- 12.1.8.3. Company Financials
- 12.1.8.4. SWOT Analysis
- 12.1.1 Solvay Group
- 12.2. Market Entropy
- 12.2.1 Company's Key Areas Served
- 12.2.2 Recent Developments
- 12.3. Company Market Share Analysis 2025
- 12.3.1 Top 5 Companies Market Share Analysis
- 12.3.2 Top 3 Companies Market Share Analysis
- 12.4. List of Potential Customers
- 13. Research Methodology
List of Figures
- Figure 1: Global US Automotive Glass Fiber Composites Market Revenue Breakdown (Million, %) by Region 2025 & 2033
- Figure 2: North America US Automotive Glass Fiber Composites Market Revenue (Million), by Intermediate Type 2025 & 2033
- Figure 3: North America US Automotive Glass Fiber Composites Market Revenue Share (%), by Intermediate Type 2025 & 2033
- Figure 4: North America US Automotive Glass Fiber Composites Market Revenue (Million), by Application Type 2025 & 2033
- Figure 5: North America US Automotive Glass Fiber Composites Market Revenue Share (%), by Application Type 2025 & 2033
- Figure 6: North America US Automotive Glass Fiber Composites Market Revenue (Million), by Country 2025 & 2033
- Figure 7: North America US Automotive Glass Fiber Composites Market Revenue Share (%), by Country 2025 & 2033
- Figure 8: South America US Automotive Glass Fiber Composites Market Revenue (Million), by Intermediate Type 2025 & 2033
- Figure 9: South America US Automotive Glass Fiber Composites Market Revenue Share (%), by Intermediate Type 2025 & 2033
- Figure 10: South America US Automotive Glass Fiber Composites Market Revenue (Million), by Application Type 2025 & 2033
- Figure 11: South America US Automotive Glass Fiber Composites Market Revenue Share (%), by Application Type 2025 & 2033
- Figure 12: South America US Automotive Glass Fiber Composites Market Revenue (Million), by Country 2025 & 2033
- Figure 13: South America US Automotive Glass Fiber Composites Market Revenue Share (%), by Country 2025 & 2033
- Figure 14: Europe US Automotive Glass Fiber Composites Market Revenue (Million), by Intermediate Type 2025 & 2033
- Figure 15: Europe US Automotive Glass Fiber Composites Market Revenue Share (%), by Intermediate Type 2025 & 2033
- Figure 16: Europe US Automotive Glass Fiber Composites Market Revenue (Million), by Application Type 2025 & 2033
- Figure 17: Europe US Automotive Glass Fiber Composites Market Revenue Share (%), by Application Type 2025 & 2033
- Figure 18: Europe US Automotive Glass Fiber Composites Market Revenue (Million), by Country 2025 & 2033
- Figure 19: Europe US Automotive Glass Fiber Composites Market Revenue Share (%), by Country 2025 & 2033
- Figure 20: Middle East & Africa US Automotive Glass Fiber Composites Market Revenue (Million), by Intermediate Type 2025 & 2033
- Figure 21: Middle East & Africa US Automotive Glass Fiber Composites Market Revenue Share (%), by Intermediate Type 2025 & 2033
- Figure 22: Middle East & Africa US Automotive Glass Fiber Composites Market Revenue (Million), by Application Type 2025 & 2033
- Figure 23: Middle East & Africa US Automotive Glass Fiber Composites Market Revenue Share (%), by Application Type 2025 & 2033
- Figure 24: Middle East & Africa US Automotive Glass Fiber Composites Market Revenue (Million), by Country 2025 & 2033
- Figure 25: Middle East & Africa US Automotive Glass Fiber Composites Market Revenue Share (%), by Country 2025 & 2033
- Figure 26: Asia Pacific US Automotive Glass Fiber Composites Market Revenue (Million), by Intermediate Type 2025 & 2033
- Figure 27: Asia Pacific US Automotive Glass Fiber Composites Market Revenue Share (%), by Intermediate Type 2025 & 2033
- Figure 28: Asia Pacific US Automotive Glass Fiber Composites Market Revenue (Million), by Application Type 2025 & 2033
- Figure 29: Asia Pacific US Automotive Glass Fiber Composites Market Revenue Share (%), by Application Type 2025 & 2033
- Figure 30: Asia Pacific US Automotive Glass Fiber Composites Market Revenue (Million), by Country 2025 & 2033
- Figure 31: Asia Pacific US Automotive Glass Fiber Composites Market Revenue Share (%), by Country 2025 & 2033
List of Tables
- Table 1: Global US Automotive Glass Fiber Composites Market Revenue Million Forecast, by Intermediate Type 2020 & 2033
- Table 2: Global US Automotive Glass Fiber Composites Market Revenue Million Forecast, by Application Type 2020 & 2033
- Table 3: Global US Automotive Glass Fiber Composites Market Revenue Million Forecast, by Region 2020 & 2033
- Table 4: Global US Automotive Glass Fiber Composites Market Revenue Million Forecast, by Intermediate Type 2020 & 2033
- Table 5: Global US Automotive Glass Fiber Composites Market Revenue Million Forecast, by Application Type 2020 & 2033
- Table 6: Global US Automotive Glass Fiber Composites Market Revenue Million Forecast, by Country 2020 & 2033
- Table 7: United States US Automotive Glass Fiber Composites Market Revenue (Million) Forecast, by Application 2020 & 2033
- Table 8: Canada US Automotive Glass Fiber Composites Market Revenue (Million) Forecast, by Application 2020 & 2033
- Table 9: Mexico US Automotive Glass Fiber Composites Market Revenue (Million) Forecast, by Application 2020 & 2033
- Table 10: Global US Automotive Glass Fiber Composites Market Revenue Million Forecast, by Intermediate Type 2020 & 2033
- Table 11: Global US Automotive Glass Fiber Composites Market Revenue Million Forecast, by Application Type 2020 & 2033
- Table 12: Global US Automotive Glass Fiber Composites Market Revenue Million Forecast, by Country 2020 & 2033
- Table 13: Brazil US Automotive Glass Fiber Composites Market Revenue (Million) Forecast, by Application 2020 & 2033
- Table 14: Argentina US Automotive Glass Fiber Composites Market Revenue (Million) Forecast, by Application 2020 & 2033
- Table 15: Rest of South America US Automotive Glass Fiber Composites Market Revenue (Million) Forecast, by Application 2020 & 2033
- Table 16: Global US Automotive Glass Fiber Composites Market Revenue Million Forecast, by Intermediate Type 2020 & 2033
- Table 17: Global US Automotive Glass Fiber Composites Market Revenue Million Forecast, by Application Type 2020 & 2033
- Table 18: Global US Automotive Glass Fiber Composites Market Revenue Million Forecast, by Country 2020 & 2033
- Table 19: United Kingdom US Automotive Glass Fiber Composites Market Revenue (Million) Forecast, by Application 2020 & 2033
- Table 20: Germany US Automotive Glass Fiber Composites Market Revenue (Million) Forecast, by Application 2020 & 2033
- Table 21: France US Automotive Glass Fiber Composites Market Revenue (Million) Forecast, by Application 2020 & 2033
- Table 22: Italy US Automotive Glass Fiber Composites Market Revenue (Million) Forecast, by Application 2020 & 2033
- Table 23: Spain US Automotive Glass Fiber Composites Market Revenue (Million) Forecast, by Application 2020 & 2033
- Table 24: Russia US Automotive Glass Fiber Composites Market Revenue (Million) Forecast, by Application 2020 & 2033
- Table 25: Benelux US Automotive Glass Fiber Composites Market Revenue (Million) Forecast, by Application 2020 & 2033
- Table 26: Nordics US Automotive Glass Fiber Composites Market Revenue (Million) Forecast, by Application 2020 & 2033
- Table 27: Rest of Europe US Automotive Glass Fiber Composites Market Revenue (Million) Forecast, by Application 2020 & 2033
- Table 28: Global US Automotive Glass Fiber Composites Market Revenue Million Forecast, by Intermediate Type 2020 & 2033
- Table 29: Global US Automotive Glass Fiber Composites Market Revenue Million Forecast, by Application Type 2020 & 2033
- Table 30: Global US Automotive Glass Fiber Composites Market Revenue Million Forecast, by Country 2020 & 2033
- Table 31: Turkey US Automotive Glass Fiber Composites Market Revenue (Million) Forecast, by Application 2020 & 2033
- Table 32: Israel US Automotive Glass Fiber Composites Market Revenue (Million) Forecast, by Application 2020 & 2033
- Table 33: GCC US Automotive Glass Fiber Composites Market Revenue (Million) Forecast, by Application 2020 & 2033
- Table 34: North Africa US Automotive Glass Fiber Composites Market Revenue (Million) Forecast, by Application 2020 & 2033
- Table 35: South Africa US Automotive Glass Fiber Composites Market Revenue (Million) Forecast, by Application 2020 & 2033
- Table 36: Rest of Middle East & Africa US Automotive Glass Fiber Composites Market Revenue (Million) Forecast, by Application 2020 & 2033
- Table 37: Global US Automotive Glass Fiber Composites Market Revenue Million Forecast, by Intermediate Type 2020 & 2033
- Table 38: Global US Automotive Glass Fiber Composites Market Revenue Million Forecast, by Application Type 2020 & 2033
- Table 39: Global US Automotive Glass Fiber Composites Market Revenue Million Forecast, by Country 2020 & 2033
- Table 40: China US Automotive Glass Fiber Composites Market Revenue (Million) Forecast, by Application 2020 & 2033
- Table 41: India US Automotive Glass Fiber Composites Market Revenue (Million) Forecast, by Application 2020 & 2033
- Table 42: Japan US Automotive Glass Fiber Composites Market Revenue (Million) Forecast, by Application 2020 & 2033
- Table 43: South Korea US Automotive Glass Fiber Composites Market Revenue (Million) Forecast, by Application 2020 & 2033
- Table 44: ASEAN US Automotive Glass Fiber Composites Market Revenue (Million) Forecast, by Application 2020 & 2033
- Table 45: Oceania US Automotive Glass Fiber Composites Market Revenue (Million) Forecast, by Application 2020 & 2033
- Table 46: Rest of Asia Pacific US Automotive Glass Fiber Composites Market Revenue (Million) Forecast, by Application 2020 & 2033
Frequently Asked Questions
1. What is the projected Compound Annual Growth Rate (CAGR) of the US Automotive Glass Fiber Composites Market?
The projected CAGR is approximately 3.50%.
2. Which companies are prominent players in the US Automotive Glass Fiber Composites Market?
Key companies in the market include Solvay Group, ASAHI FIBER GLASS Co Ltd, Nippon Sheet Glass Company Limited, Owens Corning, Jiangsu Changhai Composite Material, 3B (Braj Binani Group), Veplas Group, SAERTEX GmbH & Co KG.
3. What are the main segments of the US Automotive Glass Fiber Composites Market?
The market segments include Intermediate Type, Application Type.
4. Can you provide details about the market size?
The market size is estimated to be USD XX Million as of 2022.
5. What are some drivers contributing to market growth?
Rise in Tourism Across Activities the Country.
6. What are the notable trends driving market growth?
Increasing Adoption of Glass Fiber Composites in Automobiles.
7. Are there any restraints impacting market growth?
Hike In Fuel Prices To Restrict The Market Growth.
8. Can you provide examples of recent developments in the market?
N/A
9. What pricing options are available for accessing the report?
Pricing options include single-user, multi-user, and enterprise licenses priced at USD 3800, USD 4500, and USD 5800 respectively.
10. Is the market size provided in terms of value or volume?
The market size is provided in terms of value, measured in Million.
11. Are there any specific market keywords associated with the report?
Yes, the market keyword associated with the report is "US Automotive Glass Fiber Composites Market," which aids in identifying and referencing the specific market segment covered.
12. How do I determine which pricing option suits my needs best?
The pricing options vary based on user requirements and access needs. Individual users may opt for single-user licenses, while businesses requiring broader access may choose multi-user or enterprise licenses for cost-effective access to the report.
13. Are there any additional resources or data provided in the US Automotive Glass Fiber Composites Market report?
While the report offers comprehensive insights, it's advisable to review the specific contents or supplementary materials provided to ascertain if additional resources or data are available.
14. How can I stay updated on further developments or reports in the US Automotive Glass Fiber Composites Market?
To stay informed about further developments, trends, and reports in the US Automotive Glass Fiber Composites Market, consider subscribing to industry newsletters, following relevant companies and organizations, or regularly checking reputable industry news sources and publications.
Methodology
Step 1 - Identification of Relevant Samples Size from Population Database


Step 2 - Approaches for Defining Global Market Size (Value, Volume* & Price*)

Note*: In applicable scenarios
Step 3 - Data Sources
Primary Research
- Web Analytics
- Survey Reports
- Research Institute
- Latest Research Reports
- Opinion Leaders
Secondary Research
- Annual Reports
- White Paper
- Latest Press Release
- Industry Association
- Paid Database
- Investor Presentations

Step 4 - Data Triangulation
Involves using different sources of information in order to increase the validity of a study
These sources are likely to be stakeholders in a program - participants, other researchers, program staff, other community members, and so on.
Then we put all data in single framework & apply various statistical tools to find out the dynamic on the market.
During the analysis stage, feedback from the stakeholder groups would be compared to determine areas of agreement as well as areas of divergence