

Key Insights
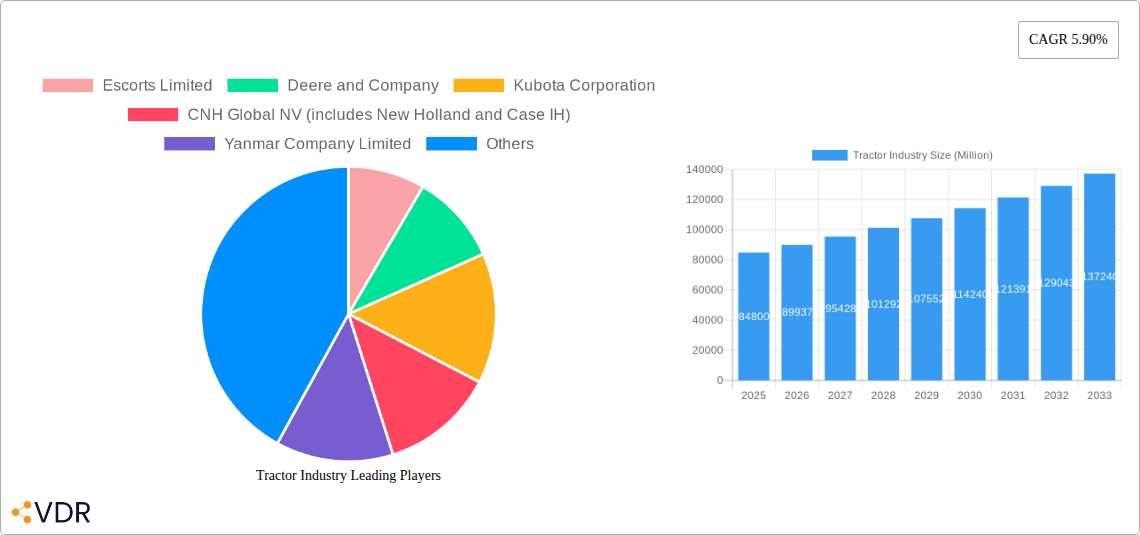
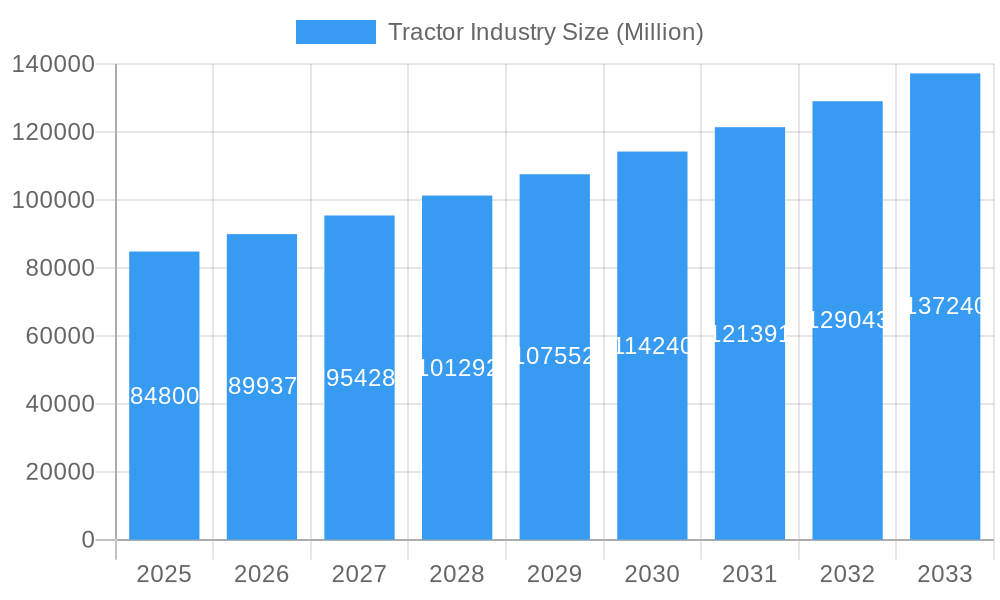
The global tractor industry, valued at $84.80 billion in 2025, is projected to experience robust growth, driven by a compound annual growth rate (CAGR) of 5.90% from 2025 to 2033. This expansion is fueled by several key factors. Increased agricultural productivity demands in developing economies, particularly in Asia-Pacific and parts of South America, are creating significant market opportunities. Furthermore, advancements in tractor technology, such as precision farming techniques, automation, and improved fuel efficiency, are enhancing operational efficiency and attracting farmers seeking higher yields and reduced operational costs. Government initiatives promoting agricultural modernization and mechanization in several regions further contribute to this positive growth trajectory. The market segmentation reveals a diverse landscape, with variations in demand across horsepower categories (below 40 HP, 40-100 HP, and above 100 HP) and drive types (two-wheel drive and four-wheel/all-wheel drive). The preference for specific horsepower and drive types will vary considerably based on regional agricultural practices and land characteristics. Leading players such as Deere & Company, Kubota Corporation, and Mahindra & Mahindra are strategically investing in research and development, expanding their product portfolios, and strengthening their distribution networks to capitalize on this expanding market.
Tractor Industry Market Size (In Billion)
Competition within the industry is intense, with established global players and regional manufacturers vying for market share. However, certain restraints are anticipated to moderate growth. Fluctuations in raw material prices, particularly steel and other components, can impact manufacturing costs and profitability. Economic downturns and adverse weather conditions can also negatively affect farmer investment and tractor demand. Additionally, stringent emission regulations in certain regions may necessitate costly technological upgrades, affecting the industry's profit margins. Despite these challenges, the long-term outlook for the tractor industry remains positive, driven by the ongoing need for agricultural mechanization and technological advancements, promising continued market expansion through 2033.
Tractor Industry Company Market Share
Tractor Industry Market Report: 2019-2033
This comprehensive report provides an in-depth analysis of the global tractor industry, covering market dynamics, growth trends, leading players, and future outlook. With a study period spanning 2019-2033, a base year of 2025, and a forecast period of 2025-2033, this report is an essential resource for industry professionals, investors, and anyone seeking to understand this vital sector. The report examines the parent market of agricultural machinery and the child market of tractors, providing granular insights into various segments. The global tractor market size is projected to reach xx Million units by 2033.
Tractor Industry Market Dynamics & Structure
The global tractor market is a moderately consolidated landscape, characterized by both established multinational corporations and regional players. Key factors shaping the market include technological advancements, stringent regulatory frameworks (emission norms, safety standards), the emergence of competitive product substitutes (automation, alternative fuels), shifting end-user demographics (younger farmers adopting technology), and ongoing mergers and acquisitions (M&A) activity. The market share of the top five players is estimated at xx% in 2025.
- Market Concentration: High, with a few major players holding significant market share.
- Technological Innovation: Driven by precision farming, automation, and alternative fuel technologies. Barriers include high R&D costs and integration complexities.
- Regulatory Landscape: Stringent emission standards and safety regulations influence product development and adoption.
- Competitive Substitutes: Growing interest in autonomous tractors and electric tractors poses a challenge to conventional models.
- End-User Demographics: A younger generation of farmers is more receptive to technology, driving demand for sophisticated tractors.
- M&A Activity: Strategic acquisitions and partnerships are reshaping the competitive landscape. xx M&A deals were recorded in the historical period.
Tractor Industry Growth Trends & Insights
The tractor industry has witnessed consistent growth over the historical period (2019-2024), driven primarily by increasing agricultural output, expanding cultivated land, and government initiatives promoting mechanized farming. The adoption rate of tractors, especially in developing economies, remains high. Technological disruptions, particularly the advent of precision farming technologies and autonomous systems, are fundamentally altering farming practices and boosting productivity. Consumer behavior is shifting towards advanced features, fuel efficiency, and ease of operation. The market is expected to exhibit a CAGR of xx% during the forecast period (2025-2033), reaching xx Million units by 2033. Market penetration in key regions varies significantly, with xx% penetration in developed economies and xx% in developing economies. The shift towards larger horsepower tractors and four-wheel-drive models also contributes to market growth.
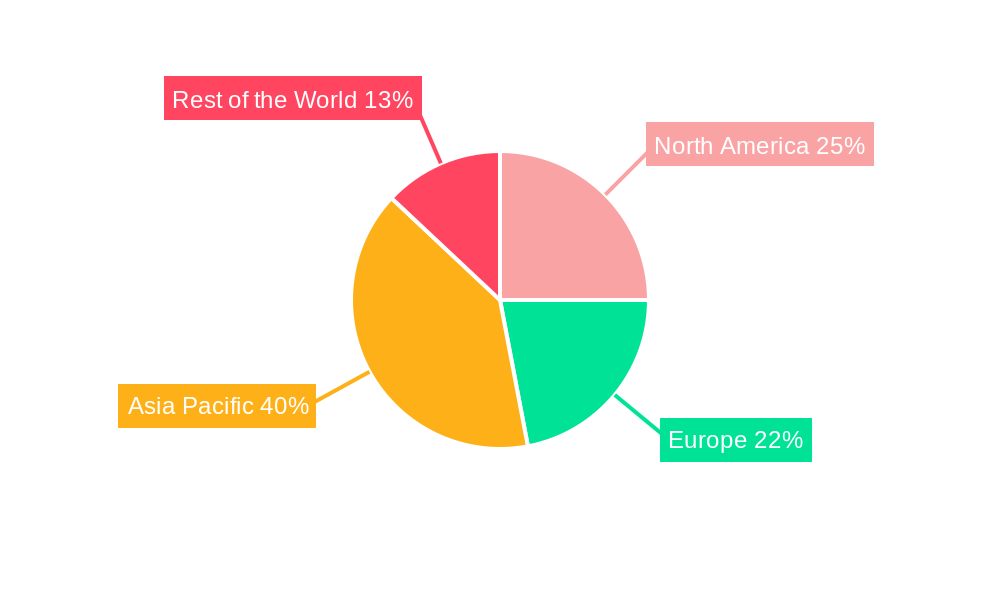
Dominant Regions, Countries, or Segments in Tractor Industry
The Asia-Pacific region dominates the global tractor market, driven by robust agricultural growth, supportive government policies, and increasing farmer incomes. India and China are the largest national markets. Within the segments, the 40 HP - 100 HP segment holds the largest market share, followed by the Above 100 HP segment, due to their adaptability to diverse farming applications and increasing farm sizes. The Four-wheel Drive/All-wheel Drive segment shows higher growth compared to Two-wheel Drive, driven by demand for enhanced traction and stability.
- Key Drivers in Asia-Pacific: Growing agricultural output, government subsidies, rising farmer income, and infrastructure development.
- Dominance Factors: Large agricultural land area, expanding farming practices, and increasing adoption of mechanization.
- Growth Potential: Untapped markets in several Asian and African countries.
Tractor Industry Product Landscape
Tractor technology is rapidly evolving, with advancements in engine efficiency, precision farming capabilities (GPS guidance, auto-steering), and connectivity features (remote diagnostics, data analytics). Modern tractors offer improved fuel economy, enhanced safety features, increased power output, and reduced maintenance needs. Key innovations include autonomous tractors, electric tractors, and tractors equipped with advanced sensors and AI-based systems for optimized farming practices. Unique selling propositions often focus on improved efficiency, reduced operating costs, and enhanced precision.
Key Drivers, Barriers & Challenges in Tractor Industry
Key Drivers: Technological advancements (automation, precision agriculture), rising agricultural output, government support for mechanization, and increasing farmer incomes are major drivers.
Challenges & Restraints: High initial investment costs, limited access to finance in developing regions, the dependence on fossil fuels, and supply chain disruptions pose significant challenges. Competition is intense, with established players and new entrants vying for market share. Fluctuations in commodity prices and unfavorable weather conditions can impact market demand.
Emerging Opportunities in Tractor Industry
The increasing demand for sustainable and efficient farming practices is creating significant opportunities for electric and autonomous tractors. Untapped markets in Africa and Latin America present potential for expansion. The integration of smart farming technologies (IoT, AI) and precision farming tools offers lucrative opportunities for tractor manufacturers. Growing demand for specialized tractors for specific crops and applications is another emerging trend.
Growth Accelerators in the Tractor Industry Industry
Technological innovation, particularly in automation and alternative fuels, is a key growth catalyst. Strategic partnerships between tractor manufacturers and technology providers, allowing for seamless integration of smart farming systems, are crucial. Expansion into untapped markets and developing regions is essential for sustained growth. Government initiatives promoting agricultural mechanization and providing financial assistance to farmers also play a critical role.
Key Players Shaping the Tractor Industry Market
- Escorts Limited
- Deere and Company
- Kubota Corporation
- CNH Global NV
- Yanmar Company Limited
- Kuhn Group (Subsidiary of Bucher Industries)
- Deutz-Fah
- Mahindra and Mahindra Corporation
- CLAAS KGaA mbH
- Tractors and Farm Equipment Limited (TAFE)
- AGCO Corporation
Notable Milestones in Tractor Industry Sector
- July 2022: Ashok Leyland introduced the AVTR 4220 and AVTR 4420 tractors.
- August 2022: Foxconn signed a contract with Monarch Tractor for manufacturing autonomous tractors.
- September 2022: KAMAZ PJSC announced plans to expand its gas vehicle range.
- May 2023: CNH planned a USD 50 million investment in the Indian farm machinery sector.
- October 2023: International Tractors Limited launched three new Solis tractor series, including an electric model.
- March 2024: Hyster Company provided APM Terminals with battery-powered terminal tractors.
In-Depth Tractor Industry Market Outlook
The tractor industry is poised for significant growth over the forecast period, driven by a combination of technological advancements, expanding global agriculture, and supportive government policies. Opportunities exist in developing economies, the adoption of sustainable farming practices, and the increasing integration of smart farming technologies. Strategic partnerships and investments in research and development will be critical for companies to maintain a competitive edge and capitalize on future market potential. The focus on precision agriculture, automation, and alternative fuels will continue to reshape the sector, creating new avenues for innovation and growth.
Tractor Industry Segmentation
-
1. Horsepower
- 1.1. Below 40 HP
- 1.2. 40 HP - 100 HP
- 1.3. Above 100 HP
-
2. Drive Type
- 2.1. Two-wheel Drive
- 2.2. Four-wheel Drive/All-wheel Drive
Tractor Industry Segmentation By Geography
-
1. North America
- 1.1. United States
- 1.2. Canada
- 1.3. Rest of North America
-
2. Europe
- 2.1. Germany
- 2.2. United Kingdom
- 2.3. France
- 2.4. Spain
- 2.5. Italy
- 2.6. Rest of Europe
-
3. Asia Pacific
- 3.1. China
- 3.2. Japan
- 3.3. India
- 3.4. South Korea
- 3.5. Rest of Asia Pacific
-
4. Rest of the World
- 4.1. South America
- 4.2. Middle East and Africa
Tractor Industry Regional Market Share
Geographic Coverage of Tractor Industry
Tractor Industry REPORT HIGHLIGHTS
| Aspects | Details |
|---|---|
| Study Period | 2020-2034 |
| Base Year | 2025 |
| Estimated Year | 2026 |
| Forecast Period | 2026-2034 |
| Historical Period | 2020-2025 |
| Growth Rate | CAGR of 5.90% from 2020-2034 |
| Segmentation |
|
Table of Contents
- 1. Introduction
- 1.1. Research Scope
- 1.2. Market Segmentation
- 1.3. Research Objective
- 1.4. Definitions and Assumptions
- 2. Executive Summary
- 2.1. Market Snapshot
- 3. Market Dynamics
- 3.1. Market Drivers
- 3.2. Market Restrains
- 3.3. Market Trends
- 3.4. Market Opportunities
- 4. Market Factor Analysis
- 4.1. Porters Five Forces
- 4.1.1. Bargaining Power of Suppliers
- 4.1.2. Bargaining Power of Buyers
- 4.1.3. Threat of New Entrants
- 4.1.4. Threat of Substitutes
- 4.1.5. Competitive Rivalry
- 4.2. PESTEL analysis
- 4.3. BCG Analysis
- 4.3.1. Stars (High Growth, High Market Share)
- 4.3.2. Cash Cows (Low Growth, High Market Share)
- 4.3.3. Question Mark (High Growth, Low Market Share)
- 4.3.4. Dogs (Low Growth, Low Market Share)
- 4.4. Ansoff Matrix Analysis
- 4.5. Supply Chain Analysis
- 4.6. Regulatory Landscape
- 4.7. Current Market Potential and Opportunity Assessment (TAM–SAM–SOM Framework)
- 4.8. VDR Analyst Note
- 4.1. Porters Five Forces
- 5. Market Analysis, Insights and Forecast 2021-2033
- 5.1. Market Analysis, Insights and Forecast - by Horsepower
- 5.1.1. Below 40 HP
- 5.1.2. 40 HP - 100 HP
- 5.1.3. Above 100 HP
- 5.2. Market Analysis, Insights and Forecast - by Drive Type
- 5.2.1. Two-wheel Drive
- 5.2.2. Four-wheel Drive/All-wheel Drive
- 5.3. Market Analysis, Insights and Forecast - by Region
- 5.3.1. North America
- 5.3.2. Europe
- 5.3.3. Asia Pacific
- 5.3.4. Rest of the World
- 5.1. Market Analysis, Insights and Forecast - by Horsepower
- 6. Global Tractor Industry Analysis, Insights and Forecast, 2021-2033
- 6.1. Market Analysis, Insights and Forecast - by Horsepower
- 6.1.1. Below 40 HP
- 6.1.2. 40 HP - 100 HP
- 6.1.3. Above 100 HP
- 6.2. Market Analysis, Insights and Forecast - by Drive Type
- 6.2.1. Two-wheel Drive
- 6.2.2. Four-wheel Drive/All-wheel Drive
- 6.1. Market Analysis, Insights and Forecast - by Horsepower
- 7. North America Tractor Industry Analysis, Insights and Forecast, 2021-2033
- 7.1. Market Analysis, Insights and Forecast - by Horsepower
- 7.1.1. Below 40 HP
- 7.1.2. 40 HP - 100 HP
- 7.1.3. Above 100 HP
- 7.2. Market Analysis, Insights and Forecast - by Drive Type
- 7.2.1. Two-wheel Drive
- 7.2.2. Four-wheel Drive/All-wheel Drive
- 7.1. Market Analysis, Insights and Forecast - by Horsepower
- 8. Europe Tractor Industry Analysis, Insights and Forecast, 2021-2033
- 8.1. Market Analysis, Insights and Forecast - by Horsepower
- 8.1.1. Below 40 HP
- 8.1.2. 40 HP - 100 HP
- 8.1.3. Above 100 HP
- 8.2. Market Analysis, Insights and Forecast - by Drive Type
- 8.2.1. Two-wheel Drive
- 8.2.2. Four-wheel Drive/All-wheel Drive
- 8.1. Market Analysis, Insights and Forecast - by Horsepower
- 9. Asia Pacific Tractor Industry Analysis, Insights and Forecast, 2021-2033
- 9.1. Market Analysis, Insights and Forecast - by Horsepower
- 9.1.1. Below 40 HP
- 9.1.2. 40 HP - 100 HP
- 9.1.3. Above 100 HP
- 9.2. Market Analysis, Insights and Forecast - by Drive Type
- 9.2.1. Two-wheel Drive
- 9.2.2. Four-wheel Drive/All-wheel Drive
- 9.1. Market Analysis, Insights and Forecast - by Horsepower
- 10. Rest of the World Tractor Industry Analysis, Insights and Forecast, 2021-2033
- 10.1. Market Analysis, Insights and Forecast - by Horsepower
- 10.1.1. Below 40 HP
- 10.1.2. 40 HP - 100 HP
- 10.1.3. Above 100 HP
- 10.2. Market Analysis, Insights and Forecast - by Drive Type
- 10.2.1. Two-wheel Drive
- 10.2.2. Four-wheel Drive/All-wheel Drive
- 10.1. Market Analysis, Insights and Forecast - by Horsepower
- 11. Competitive Analysis
- 11.1. Company Profiles
- 11.1.1 Escorts Limited
- 11.1.1.1. Company Overview
- 11.1.1.2. Products
- 11.1.1.3. Company Financials
- 11.1.1.4. SWOT Analysis
- 11.1.2 Deere and Company
- 11.1.2.1. Company Overview
- 11.1.2.2. Products
- 11.1.2.3. Company Financials
- 11.1.2.4. SWOT Analysis
- 11.1.3 Kubota Corporation
- 11.1.3.1. Company Overview
- 11.1.3.2. Products
- 11.1.3.3. Company Financials
- 11.1.3.4. SWOT Analysis
- 11.1.4 CNH Global NV (includes New Holland and Case IH)
- 11.1.4.1. Company Overview
- 11.1.4.2. Products
- 11.1.4.3. Company Financials
- 11.1.4.4. SWOT Analysis
- 11.1.5 Yanmar Company Limited
- 11.1.5.1. Company Overview
- 11.1.5.2. Products
- 11.1.5.3. Company Financials
- 11.1.5.4. SWOT Analysis
- 11.1.6 Kuhn Group (Subsidiary of Bucher Industries)
- 11.1.6.1. Company Overview
- 11.1.6.2. Products
- 11.1.6.3. Company Financials
- 11.1.6.4. SWOT Analysis
- 11.1.7 Deutz-Fah
- 11.1.7.1. Company Overview
- 11.1.7.2. Products
- 11.1.7.3. Company Financials
- 11.1.7.4. SWOT Analysis
- 11.1.8 Mahindra and Mahindra Corporation
- 11.1.8.1. Company Overview
- 11.1.8.2. Products
- 11.1.8.3. Company Financials
- 11.1.8.4. SWOT Analysis
- 11.1.9 CLAAS KGaA mbH
- 11.1.9.1. Company Overview
- 11.1.9.2. Products
- 11.1.9.3. Company Financials
- 11.1.9.4. SWOT Analysis
- 11.1.10 Tractors and Farm Equipment Limited (TAFE)
- 11.1.10.1. Company Overview
- 11.1.10.2. Products
- 11.1.10.3. Company Financials
- 11.1.10.4. SWOT Analysis
- 11.1.11 AGCO Corporation (includes Massey Ferguson Valtra Fendt and Challenger)
- 11.1.11.1. Company Overview
- 11.1.11.2. Products
- 11.1.11.3. Company Financials
- 11.1.11.4. SWOT Analysis
- 11.1.1 Escorts Limited
- 11.2. Market Entropy
- 11.2.1 Company's Key Areas Served
- 11.2.2 Recent Developments
- 11.3. Company Market Share Analysis 2025
- 11.3.1 Top 5 Companies Market Share Analysis
- 11.3.2 Top 3 Companies Market Share Analysis
- 11.4. List of Potential Customers
- 12. Research Methodology
List of Figures
- Figure 1: Global Tractor Industry Revenue Breakdown (Million, %) by Region 2025 & 2033
- Figure 2: North America Tractor Industry Revenue (Million), by Horsepower 2025 & 2033
- Figure 3: North America Tractor Industry Revenue Share (%), by Horsepower 2025 & 2033
- Figure 4: North America Tractor Industry Revenue (Million), by Drive Type 2025 & 2033
- Figure 5: North America Tractor Industry Revenue Share (%), by Drive Type 2025 & 2033
- Figure 6: North America Tractor Industry Revenue (Million), by Country 2025 & 2033
- Figure 7: North America Tractor Industry Revenue Share (%), by Country 2025 & 2033
- Figure 8: Europe Tractor Industry Revenue (Million), by Horsepower 2025 & 2033
- Figure 9: Europe Tractor Industry Revenue Share (%), by Horsepower 2025 & 2033
- Figure 10: Europe Tractor Industry Revenue (Million), by Drive Type 2025 & 2033
- Figure 11: Europe Tractor Industry Revenue Share (%), by Drive Type 2025 & 2033
- Figure 12: Europe Tractor Industry Revenue (Million), by Country 2025 & 2033
- Figure 13: Europe Tractor Industry Revenue Share (%), by Country 2025 & 2033
- Figure 14: Asia Pacific Tractor Industry Revenue (Million), by Horsepower 2025 & 2033
- Figure 15: Asia Pacific Tractor Industry Revenue Share (%), by Horsepower 2025 & 2033
- Figure 16: Asia Pacific Tractor Industry Revenue (Million), by Drive Type 2025 & 2033
- Figure 17: Asia Pacific Tractor Industry Revenue Share (%), by Drive Type 2025 & 2033
- Figure 18: Asia Pacific Tractor Industry Revenue (Million), by Country 2025 & 2033
- Figure 19: Asia Pacific Tractor Industry Revenue Share (%), by Country 2025 & 2033
- Figure 20: Rest of the World Tractor Industry Revenue (Million), by Horsepower 2025 & 2033
- Figure 21: Rest of the World Tractor Industry Revenue Share (%), by Horsepower 2025 & 2033
- Figure 22: Rest of the World Tractor Industry Revenue (Million), by Drive Type 2025 & 2033
- Figure 23: Rest of the World Tractor Industry Revenue Share (%), by Drive Type 2025 & 2033
- Figure 24: Rest of the World Tractor Industry Revenue (Million), by Country 2025 & 2033
- Figure 25: Rest of the World Tractor Industry Revenue Share (%), by Country 2025 & 2033
List of Tables
- Table 1: Global Tractor Industry Revenue Million Forecast, by Horsepower 2020 & 2033
- Table 2: Global Tractor Industry Revenue Million Forecast, by Drive Type 2020 & 2033
- Table 3: Global Tractor Industry Revenue Million Forecast, by Region 2020 & 2033
- Table 4: Global Tractor Industry Revenue Million Forecast, by Horsepower 2020 & 2033
- Table 5: Global Tractor Industry Revenue Million Forecast, by Drive Type 2020 & 2033
- Table 6: Global Tractor Industry Revenue Million Forecast, by Country 2020 & 2033
- Table 7: United States Tractor Industry Revenue (Million) Forecast, by Application 2020 & 2033
- Table 8: Canada Tractor Industry Revenue (Million) Forecast, by Application 2020 & 2033
- Table 9: Rest of North America Tractor Industry Revenue (Million) Forecast, by Application 2020 & 2033
- Table 10: Global Tractor Industry Revenue Million Forecast, by Horsepower 2020 & 2033
- Table 11: Global Tractor Industry Revenue Million Forecast, by Drive Type 2020 & 2033
- Table 12: Global Tractor Industry Revenue Million Forecast, by Country 2020 & 2033
- Table 13: Germany Tractor Industry Revenue (Million) Forecast, by Application 2020 & 2033
- Table 14: United Kingdom Tractor Industry Revenue (Million) Forecast, by Application 2020 & 2033
- Table 15: France Tractor Industry Revenue (Million) Forecast, by Application 2020 & 2033
- Table 16: Spain Tractor Industry Revenue (Million) Forecast, by Application 2020 & 2033
- Table 17: Italy Tractor Industry Revenue (Million) Forecast, by Application 2020 & 2033
- Table 18: Rest of Europe Tractor Industry Revenue (Million) Forecast, by Application 2020 & 2033
- Table 19: Global Tractor Industry Revenue Million Forecast, by Horsepower 2020 & 2033
- Table 20: Global Tractor Industry Revenue Million Forecast, by Drive Type 2020 & 2033
- Table 21: Global Tractor Industry Revenue Million Forecast, by Country 2020 & 2033
- Table 22: China Tractor Industry Revenue (Million) Forecast, by Application 2020 & 2033
- Table 23: Japan Tractor Industry Revenue (Million) Forecast, by Application 2020 & 2033
- Table 24: India Tractor Industry Revenue (Million) Forecast, by Application 2020 & 2033
- Table 25: South Korea Tractor Industry Revenue (Million) Forecast, by Application 2020 & 2033
- Table 26: Rest of Asia Pacific Tractor Industry Revenue (Million) Forecast, by Application 2020 & 2033
- Table 27: Global Tractor Industry Revenue Million Forecast, by Horsepower 2020 & 2033
- Table 28: Global Tractor Industry Revenue Million Forecast, by Drive Type 2020 & 2033
- Table 29: Global Tractor Industry Revenue Million Forecast, by Country 2020 & 2033
- Table 30: South America Tractor Industry Revenue (Million) Forecast, by Application 2020 & 2033
- Table 31: Middle East and Africa Tractor Industry Revenue (Million) Forecast, by Application 2020 & 2033
Frequently Asked Questions
1. What is the projected Compound Annual Growth Rate (CAGR) of the Tractor Industry?
The projected CAGR is approximately 5.90%.
2. Which companies are prominent players in the Tractor Industry?
Key companies in the market include Escorts Limited, Deere and Company, Kubota Corporation, CNH Global NV (includes New Holland and Case IH), Yanmar Company Limited, Kuhn Group (Subsidiary of Bucher Industries), Deutz-Fah, Mahindra and Mahindra Corporation, CLAAS KGaA mbH, Tractors and Farm Equipment Limited (TAFE), AGCO Corporation (includes Massey Ferguson Valtra Fendt and Challenger).
3. What are the main segments of the Tractor Industry?
The market segments include Horsepower, Drive Type.
4. Can you provide details about the market size?
The market size is estimated to be USD 84.80 Million as of 2022.
5. What are some drivers contributing to market growth?
Rising Residential Activities in Addition to Consumer Spending to Enhance Market Demand.
6. What are the notable trends driving market growth?
The Below 40 HP Tractors Segment's Growth is Expected to be Bolstered over the Next Five Years.
7. Are there any restraints impacting market growth?
Rising Electric Vehicle Adoption to Hinder Market Growth in the Long Run.
8. Can you provide examples of recent developments in the market?
March 2024: Hyster Company announced an agreement to provide APM Terminals with 10 battery-powered terminal tractors for their location at the Port of Mobile in Alabama. The electric terminal tractors, which are scheduled to be delivered in 2024, are part of a USD 60 million investment in port equipment electrification pilots by APM Terminals.
9. What pricing options are available for accessing the report?
Pricing options include single-user, multi-user, and enterprise licenses priced at USD 4750, USD 5250, and USD 8750 respectively.
10. Is the market size provided in terms of value or volume?
The market size is provided in terms of value, measured in Million.
11. Are there any specific market keywords associated with the report?
Yes, the market keyword associated with the report is "Tractor Industry," which aids in identifying and referencing the specific market segment covered.
12. How do I determine which pricing option suits my needs best?
The pricing options vary based on user requirements and access needs. Individual users may opt for single-user licenses, while businesses requiring broader access may choose multi-user or enterprise licenses for cost-effective access to the report.
13. Are there any additional resources or data provided in the Tractor Industry report?
While the report offers comprehensive insights, it's advisable to review the specific contents or supplementary materials provided to ascertain if additional resources or data are available.
14. How can I stay updated on further developments or reports in the Tractor Industry?
To stay informed about further developments, trends, and reports in the Tractor Industry, consider subscribing to industry newsletters, following relevant companies and organizations, or regularly checking reputable industry news sources and publications.
Methodology
Step 1 - Identification of Relevant Samples Size from Population Database


Step 2 - Approaches for Defining Global Market Size (Value, Volume* & Price*)

Note*: In applicable scenarios
Step 3 - Data Sources
Primary Research
- Web Analytics
- Survey Reports
- Research Institute
- Latest Research Reports
- Opinion Leaders
Secondary Research
- Annual Reports
- White Paper
- Latest Press Release
- Industry Association
- Paid Database
- Investor Presentations

Step 4 - Data Triangulation
Involves using different sources of information in order to increase the validity of a study
These sources are likely to be stakeholders in a program - participants, other researchers, program staff, other community members, and so on.
Then we put all data in single framework & apply various statistical tools to find out the dynamic on the market.
During the analysis stage, feedback from the stakeholder groups would be compared to determine areas of agreement as well as areas of divergence