

Key Insights
The global toys and games market is poised for substantial growth, projected to expand at a Compound Annual Growth Rate (CAGR) of 0.7% from 2025 to 2033. This expansion is fueled by rising disposable incomes, particularly in emerging economies, driving increased consumer spending on recreational products. The burgeoning digital gaming sector, encompassing mobile games and e-sports, significantly contributes to market dynamism. Innovations in toy design, integrating augmented reality (AR) and virtual reality (VR), are enhancing interactive experiences and broadening consumer appeal across age demographics. The market is segmented across diverse categories including games and puzzles, video games, construction toys, dolls and accessories, and outdoor and sports equipment. While e-commerce channels are experiencing robust growth due to convenience, traditional offline retail continues to maintain a significant market presence, offering immediate product access and in-person experiences. Key industry leaders such as Mattel, Hasbro, Lego, and Bandai Namco are actively shaping market trends through innovation, brand development, and strategic acquisitions.
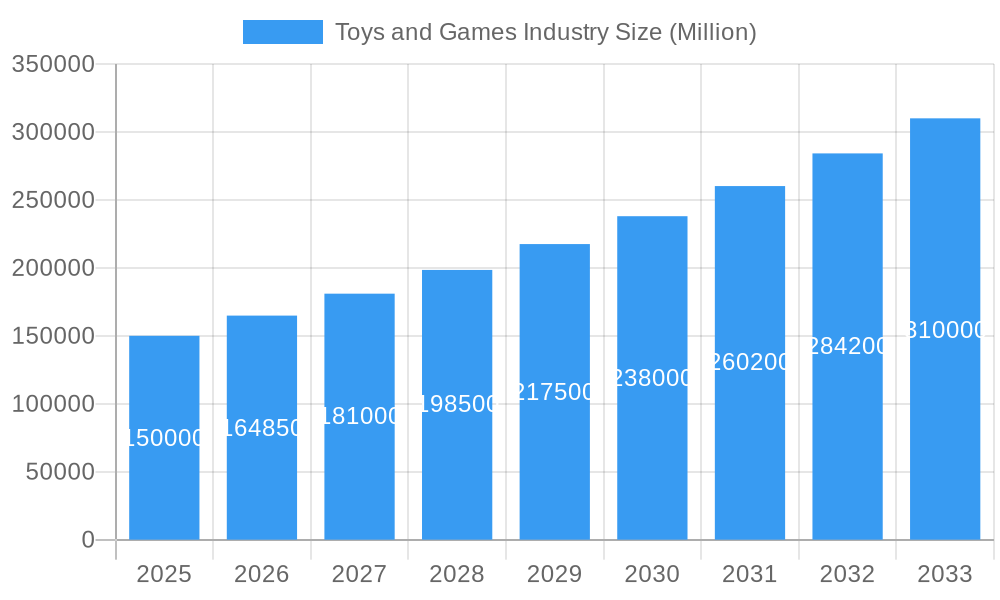
Toys and Games Industry Market Size (In Billion)
Key challenges for the market include volatility in raw material prices and potential supply chain disruptions, impacting production costs. Intensifying competition, especially from niche players, necessitates ongoing innovation and strategic adaptation. Evolving consumer preferences and rapid technological advancements demand agility in product development and marketing. Regional market dynamics vary, with North America and Asia Pacific currently dominating market share, while other regions present considerable growth potential. Effective market penetration and localization strategies are critical for capitalizing on these opportunities. The continuous evolution of consumer tastes and technological innovation will remain pivotal in shaping the future trajectory of the toys and games industry, requiring manufacturers to consistently deliver engaging and novel products.
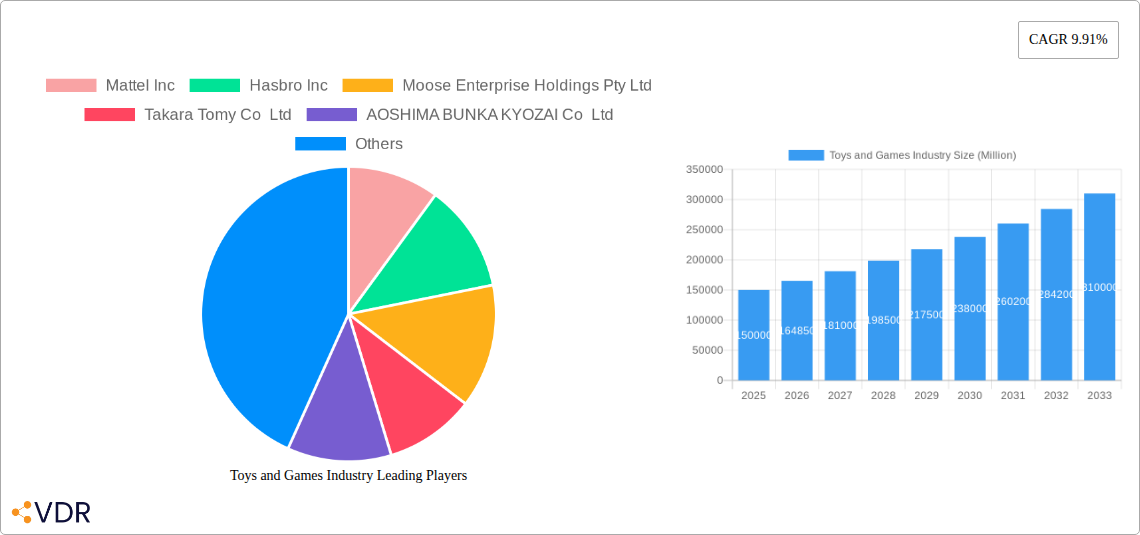
Toys and Games Industry Company Market Share
This comprehensive report offers an in-depth analysis of the Toys and Games industry, detailing market dynamics, growth trajectories, dominant segments, product portfolios, key stakeholders, and future projections. The analysis covers the period from 2019 to 2033, with 2025 serving as the base year. Market size is projected to reach 1.7 billion by the end of the forecast period. The report utilizes extensive market research and data analytics to provide actionable insights for industry professionals, investors, and stakeholders.
Toys and Games Industry Market Dynamics & Structure
The global toys and games market is a dynamic landscape shaped by several interconnected factors. Market concentration is moderate, with key players like Mattel Inc, Hasbro Inc, and Lego Group holding significant shares but facing competition from numerous smaller players and regional brands. Technological innovation, particularly in areas like augmented reality (AR) and virtual reality (VR) integration, is a key driver, enhancing the play experience and creating new product categories. However, innovation barriers, such as high R&D costs and the need for skilled workforce, can hinder the speed of technological adoption.
Regulatory frameworks related to product safety and marketing practices influence industry operations. Competitive product substitutes, such as digital entertainment and online gaming, pose challenges, forcing traditional toy companies to adapt. End-user demographics show a shift towards more diverse and inclusive toy offerings, reflecting changing societal values. Finally, mergers and acquisitions (M&A) activity remains prevalent, with larger companies seeking to expand their portfolios and market reach.
- Market Concentration: Moderately concentrated, with top 5 players holding xx% market share in 2024.
- M&A Activity: xx deals recorded between 2019 and 2024, valued at approximately xx Million units.
- Innovation Barriers: High R&D costs, skilled labor shortages, and intellectual property protection issues.
- Regulatory Landscape: Stringent safety regulations and evolving marketing standards influence product development and marketing strategies.
Toys and Games Industry Growth Trends & Insights
The global toys and games market experienced significant growth during the historical period (2019-2024), driven by factors such as rising disposable incomes, increasing urbanization, and the growing popularity of collectible toys. The market size increased from xx Million units in 2019 to xx Million units in 2024, with a Compound Annual Growth Rate (CAGR) of xx%. This growth is expected to continue in the forecast period (2025-2033), albeit at a slightly moderated pace. Technological disruptions, such as the rise of interactive toys and smart toys, have significantly influenced consumer behavior and shaped market segments. The increasing adoption of online channels for purchasing toys and games is another significant trend, impacting traditional retail models. Consumer behavior shifts are characterized by increased demand for educational toys, sustainable and ethically sourced products, and toys promoting creativity and STEM learning.
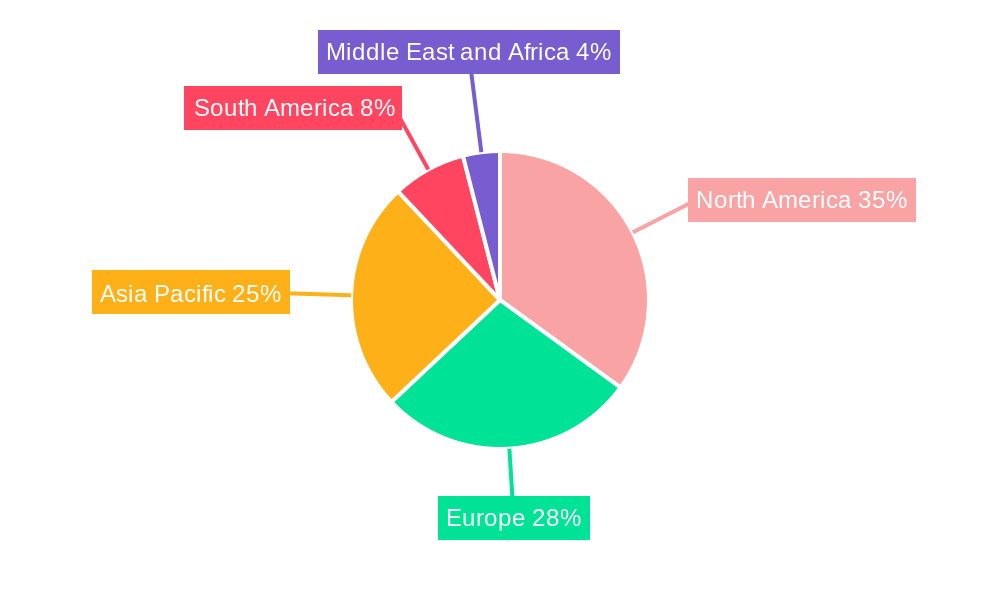
Dominant Regions, Countries, or Segments in Toys and Games Industry
The North American region, particularly the United States, holds a leading position in the global toys and games market, followed by Europe and Asia-Pacific. Within product types, construction toys (Lego, etc.), dolls and accessories, and outdoor and sports toys represent significant segments, each exhibiting distinct growth patterns. The online channel is experiencing rapid expansion, while the offline channel continues to hold a strong market share, with the balance influenced by regional differences in e-commerce penetration rates and retail infrastructure.
- Leading Region: North America (xx% market share in 2024)
- Fastest-Growing Segment: Video games (xx% CAGR projected 2025-2033)
- Key Drivers: Increasing disposable incomes in emerging markets, strong demand for educational and interactive toys.
- Dominance Factors: Established retail infrastructure in developed markets, strong intellectual property protection, and robust marketing capabilities of major players.
Toys and Games Industry Product Landscape
The toys and games industry offers a diverse product portfolio, including traditional toys, video games, board games, puzzles, and educational toys. Technological advancements have led to the development of interactive and smart toys that incorporate features such as AR, VR, and voice recognition. These innovations enhance the play experience, provide educational benefits, and cater to evolving consumer preferences. The unique selling propositions (USPs) of many products focus on unique designs, intellectual property licensing, and brand recognition.
Key Drivers, Barriers & Challenges in Toys and Games Industry
Key Drivers:
- Rising disposable incomes and increased spending on children's entertainment.
- Growing demand for educational and interactive toys.
- Technological advancements, such as AR/VR integration and smart toy development.
- Expanding e-commerce platforms and online marketplaces.
Key Challenges:
- Intense competition from both established and emerging players.
- Supply chain disruptions affecting production and distribution.
- Safety regulations and stringent quality control requirements.
- Fluctuations in raw material costs and economic instability impacting affordability.
Emerging Opportunities in Toys and Games Industry
The toys and games industry presents exciting emerging opportunities, particularly in untapped markets, such as developing economies and niche segments. The demand for sustainable and ethically-sourced toys is also increasing, creating opportunities for eco-friendly product development. The integration of technology continues to drive opportunities for innovation, including interactive toys that promote STEM education and personalized play experiences.
Growth Accelerators in the Toys and Games Industry Industry
Long-term growth in the toys and games industry will be fueled by continued technological innovation, strategic partnerships between toy companies and technology firms, and expansion into new geographic markets. The development of educational and interactive toys that cater to diverse learning styles will also propel growth.
Key Players Shaping the Toys and Games Industry Market
- Mattel Inc
- Hasbro Inc
- Moose Enterprise Holdings Pty Ltd
- Takara Tomy Co Ltd
- AOSHIMA BUNKA KYOZAI Co Ltd
- Lego Group
- Simba-Dickie Group
- Tru Kids Inc
- Spin Master Ltd
- Bandai Namco Holdings Inc
Notable Milestones in Toys and Games Industry Sector
- September 2022: Mattel introduced Bruno the Brake Car, the first autistic character in the iconic Thomas & Friends franchise, promoting inclusivity and representation.
- September 2022: The Lego Group announced a new Lego Marvel Black Panther Set, capitalizing on the popularity of Marvel superheroes and expanding its licensed product line.
- October 2022: The Lego Group announced the Lego Marvel Studios Release, The Iron Man Hulkbuster set, leveraging the success of Marvel Cinematic Universe films to drive sales.
In-Depth Toys and Games Industry Market Outlook
The future of the toys and games industry is bright, with strong growth potential driven by sustained demand, technological advancements, and ongoing market expansion. Strategic partnerships, innovative product development, and a focus on sustainability and inclusivity will be key factors in shaping the industry's trajectory. Companies that successfully adapt to evolving consumer preferences and leverage technology to enhance the play experience will be best positioned for long-term success.
Toys and Games Industry Segmentation
-
1. Product Type
- 1.1. Games and Puzzles
- 1.2. Video Games
- 1.3. Construction Toys
- 1.4. Dolls and Accessories
- 1.5. Outdoor and Sports Toys
- 1.6. Other Product Types
-
2. Distribution Channel
- 2.1. Online Channel
- 2.2. Offline Channel
Toys and Games Industry Segmentation By Geography
-
1. North America
- 1.1. United States
- 1.2. Canada
- 1.3. Mexico
- 1.4. Rest of North America
-
2. Europe
- 2.1. Spain
- 2.2. United Kingdom
- 2.3. Germany
- 2.4. France
- 2.5. Italy
- 2.6. Russia
- 2.7. Rest of Europe
-
3. Asia Pacific
- 3.1. China
- 3.2. Japan
- 3.3. India
- 3.4. Australia
- 3.5. Rest of Asia Pacific
-
4. South America
- 4.1. Brazil
- 4.2. Argentina
- 4.3. Rest of South America
-
5. Middle East and Africa
- 5.1. South Africa
- 5.2. Saudi Arabia
- 5.3. Rest of Middle East and Africa
Toys and Games Industry Regional Market Share
Geographic Coverage of Toys and Games Industry
Toys and Games Industry REPORT HIGHLIGHTS
| Aspects | Details |
|---|---|
| Study Period | 2020-2034 |
| Base Year | 2025 |
| Estimated Year | 2026 |
| Forecast Period | 2026-2034 |
| Historical Period | 2020-2025 |
| Growth Rate | CAGR of 0.7% from 2020-2034 |
| Segmentation |
|
Table of Contents
- 1. Introduction
- 1.1. Research Scope
- 1.2. Market Segmentation
- 1.3. Research Objective
- 1.4. Definitions and Assumptions
- 2. Executive Summary
- 2.1. Market Snapshot
- 3. Market Dynamics
- 3.1. Market Drivers
- 3.2. Market Restrains
- 3.3. Market Trends
- 3.4. Market Opportunities
- 4. Market Factor Analysis
- 4.1. Porters Five Forces
- 4.1.1. Bargaining Power of Suppliers
- 4.1.2. Bargaining Power of Buyers
- 4.1.3. Threat of New Entrants
- 4.1.4. Threat of Substitutes
- 4.1.5. Competitive Rivalry
- 4.2. PESTEL analysis
- 4.3. BCG Analysis
- 4.3.1. Stars (High Growth, High Market Share)
- 4.3.2. Cash Cows (Low Growth, High Market Share)
- 4.3.3. Question Mark (High Growth, Low Market Share)
- 4.3.4. Dogs (Low Growth, Low Market Share)
- 4.4. Ansoff Matrix Analysis
- 4.5. Supply Chain Analysis
- 4.6. Regulatory Landscape
- 4.7. Current Market Potential and Opportunity Assessment (TAM–SAM–SOM Framework)
- 4.8. VDR Analyst Note
- 4.1. Porters Five Forces
- 5. Market Analysis, Insights and Forecast 2021-2033
- 5.1. Market Analysis, Insights and Forecast - by Product Type
- 5.1.1. Games and Puzzles
- 5.1.2. Video Games
- 5.1.3. Construction Toys
- 5.1.4. Dolls and Accessories
- 5.1.5. Outdoor and Sports Toys
- 5.1.6. Other Product Types
- 5.2. Market Analysis, Insights and Forecast - by Distribution Channel
- 5.2.1. Online Channel
- 5.2.2. Offline Channel
- 5.3. Market Analysis, Insights and Forecast - by Region
- 5.3.1. North America
- 5.3.2. Europe
- 5.3.3. Asia Pacific
- 5.3.4. South America
- 5.3.5. Middle East and Africa
- 5.1. Market Analysis, Insights and Forecast - by Product Type
- 6. Global Toys and Games Industry Analysis, Insights and Forecast, 2021-2033
- 6.1. Market Analysis, Insights and Forecast - by Product Type
- 6.1.1. Games and Puzzles
- 6.1.2. Video Games
- 6.1.3. Construction Toys
- 6.1.4. Dolls and Accessories
- 6.1.5. Outdoor and Sports Toys
- 6.1.6. Other Product Types
- 6.2. Market Analysis, Insights and Forecast - by Distribution Channel
- 6.2.1. Online Channel
- 6.2.2. Offline Channel
- 6.1. Market Analysis, Insights and Forecast - by Product Type
- 7. North America Toys and Games Industry Analysis, Insights and Forecast, 2021-2033
- 7.1. Market Analysis, Insights and Forecast - by Product Type
- 7.1.1. Games and Puzzles
- 7.1.2. Video Games
- 7.1.3. Construction Toys
- 7.1.4. Dolls and Accessories
- 7.1.5. Outdoor and Sports Toys
- 7.1.6. Other Product Types
- 7.2. Market Analysis, Insights and Forecast - by Distribution Channel
- 7.2.1. Online Channel
- 7.2.2. Offline Channel
- 7.1. Market Analysis, Insights and Forecast - by Product Type
- 8. Europe Toys and Games Industry Analysis, Insights and Forecast, 2021-2033
- 8.1. Market Analysis, Insights and Forecast - by Product Type
- 8.1.1. Games and Puzzles
- 8.1.2. Video Games
- 8.1.3. Construction Toys
- 8.1.4. Dolls and Accessories
- 8.1.5. Outdoor and Sports Toys
- 8.1.6. Other Product Types
- 8.2. Market Analysis, Insights and Forecast - by Distribution Channel
- 8.2.1. Online Channel
- 8.2.2. Offline Channel
- 8.1. Market Analysis, Insights and Forecast - by Product Type
- 9. Asia Pacific Toys and Games Industry Analysis, Insights and Forecast, 2021-2033
- 9.1. Market Analysis, Insights and Forecast - by Product Type
- 9.1.1. Games and Puzzles
- 9.1.2. Video Games
- 9.1.3. Construction Toys
- 9.1.4. Dolls and Accessories
- 9.1.5. Outdoor and Sports Toys
- 9.1.6. Other Product Types
- 9.2. Market Analysis, Insights and Forecast - by Distribution Channel
- 9.2.1. Online Channel
- 9.2.2. Offline Channel
- 9.1. Market Analysis, Insights and Forecast - by Product Type
- 10. South America Toys and Games Industry Analysis, Insights and Forecast, 2021-2033
- 10.1. Market Analysis, Insights and Forecast - by Product Type
- 10.1.1. Games and Puzzles
- 10.1.2. Video Games
- 10.1.3. Construction Toys
- 10.1.4. Dolls and Accessories
- 10.1.5. Outdoor and Sports Toys
- 10.1.6. Other Product Types
- 10.2. Market Analysis, Insights and Forecast - by Distribution Channel
- 10.2.1. Online Channel
- 10.2.2. Offline Channel
- 10.1. Market Analysis, Insights and Forecast - by Product Type
- 11. Middle East and Africa Toys and Games Industry Analysis, Insights and Forecast, 2021-2033
- 11.1. Market Analysis, Insights and Forecast - by Product Type
- 11.1.1. Games and Puzzles
- 11.1.2. Video Games
- 11.1.3. Construction Toys
- 11.1.4. Dolls and Accessories
- 11.1.5. Outdoor and Sports Toys
- 11.1.6. Other Product Types
- 11.2. Market Analysis, Insights and Forecast - by Distribution Channel
- 11.2.1. Online Channel
- 11.2.2. Offline Channel
- 11.1. Market Analysis, Insights and Forecast - by Product Type
- 12. Competitive Analysis
- 12.1. Company Profiles
- 12.1.1 Mattel Inc
- 12.1.1.1. Company Overview
- 12.1.1.2. Products
- 12.1.1.3. Company Financials
- 12.1.1.4. SWOT Analysis
- 12.1.2 Hasbro Inc
- 12.1.2.1. Company Overview
- 12.1.2.2. Products
- 12.1.2.3. Company Financials
- 12.1.2.4. SWOT Analysis
- 12.1.3 Moose Enterprise Holdings Pty Ltd
- 12.1.3.1. Company Overview
- 12.1.3.2. Products
- 12.1.3.3. Company Financials
- 12.1.3.4. SWOT Analysis
- 12.1.4 Takara Tomy Co Ltd
- 12.1.4.1. Company Overview
- 12.1.4.2. Products
- 12.1.4.3. Company Financials
- 12.1.4.4. SWOT Analysis
- 12.1.5 AOSHIMA BUNKA KYOZAI Co Ltd
- 12.1.5.1. Company Overview
- 12.1.5.2. Products
- 12.1.5.3. Company Financials
- 12.1.5.4. SWOT Analysis
- 12.1.6 Lego Group
- 12.1.6.1. Company Overview
- 12.1.6.2. Products
- 12.1.6.3. Company Financials
- 12.1.6.4. SWOT Analysis
- 12.1.7 Simba-Dickie Group
- 12.1.7.1. Company Overview
- 12.1.7.2. Products
- 12.1.7.3. Company Financials
- 12.1.7.4. SWOT Analysis
- 12.1.8 Tru Kids Inc *List Not Exhaustive
- 12.1.8.1. Company Overview
- 12.1.8.2. Products
- 12.1.8.3. Company Financials
- 12.1.8.4. SWOT Analysis
- 12.1.9 Spin Master Ltd
- 12.1.9.1. Company Overview
- 12.1.9.2. Products
- 12.1.9.3. Company Financials
- 12.1.9.4. SWOT Analysis
- 12.1.10 Bandai Namco Holdings Inc
- 12.1.10.1. Company Overview
- 12.1.10.2. Products
- 12.1.10.3. Company Financials
- 12.1.10.4. SWOT Analysis
- 12.1.1 Mattel Inc
- 12.2. Market Entropy
- 12.2.1 Company's Key Areas Served
- 12.2.2 Recent Developments
- 12.3. Company Market Share Analysis 2025
- 12.3.1 Top 5 Companies Market Share Analysis
- 12.3.2 Top 3 Companies Market Share Analysis
- 12.4. List of Potential Customers
- 13. Research Methodology
List of Figures
- Figure 1: Global Toys and Games Industry Revenue Breakdown (billion, %) by Region 2025 & 2033
- Figure 2: Global Toys and Games Industry Volume Breakdown (K Units, %) by Region 2025 & 2033
- Figure 3: North America Toys and Games Industry Revenue (billion), by Product Type 2025 & 2033
- Figure 4: North America Toys and Games Industry Volume (K Units), by Product Type 2025 & 2033
- Figure 5: North America Toys and Games Industry Revenue Share (%), by Product Type 2025 & 2033
- Figure 6: North America Toys and Games Industry Volume Share (%), by Product Type 2025 & 2033
- Figure 7: North America Toys and Games Industry Revenue (billion), by Distribution Channel 2025 & 2033
- Figure 8: North America Toys and Games Industry Volume (K Units), by Distribution Channel 2025 & 2033
- Figure 9: North America Toys and Games Industry Revenue Share (%), by Distribution Channel 2025 & 2033
- Figure 10: North America Toys and Games Industry Volume Share (%), by Distribution Channel 2025 & 2033
- Figure 11: North America Toys and Games Industry Revenue (billion), by Country 2025 & 2033
- Figure 12: North America Toys and Games Industry Volume (K Units), by Country 2025 & 2033
- Figure 13: North America Toys and Games Industry Revenue Share (%), by Country 2025 & 2033
- Figure 14: North America Toys and Games Industry Volume Share (%), by Country 2025 & 2033
- Figure 15: Europe Toys and Games Industry Revenue (billion), by Product Type 2025 & 2033
- Figure 16: Europe Toys and Games Industry Volume (K Units), by Product Type 2025 & 2033
- Figure 17: Europe Toys and Games Industry Revenue Share (%), by Product Type 2025 & 2033
- Figure 18: Europe Toys and Games Industry Volume Share (%), by Product Type 2025 & 2033
- Figure 19: Europe Toys and Games Industry Revenue (billion), by Distribution Channel 2025 & 2033
- Figure 20: Europe Toys and Games Industry Volume (K Units), by Distribution Channel 2025 & 2033
- Figure 21: Europe Toys and Games Industry Revenue Share (%), by Distribution Channel 2025 & 2033
- Figure 22: Europe Toys and Games Industry Volume Share (%), by Distribution Channel 2025 & 2033
- Figure 23: Europe Toys and Games Industry Revenue (billion), by Country 2025 & 2033
- Figure 24: Europe Toys and Games Industry Volume (K Units), by Country 2025 & 2033
- Figure 25: Europe Toys and Games Industry Revenue Share (%), by Country 2025 & 2033
- Figure 26: Europe Toys and Games Industry Volume Share (%), by Country 2025 & 2033
- Figure 27: Asia Pacific Toys and Games Industry Revenue (billion), by Product Type 2025 & 2033
- Figure 28: Asia Pacific Toys and Games Industry Volume (K Units), by Product Type 2025 & 2033
- Figure 29: Asia Pacific Toys and Games Industry Revenue Share (%), by Product Type 2025 & 2033
- Figure 30: Asia Pacific Toys and Games Industry Volume Share (%), by Product Type 2025 & 2033
- Figure 31: Asia Pacific Toys and Games Industry Revenue (billion), by Distribution Channel 2025 & 2033
- Figure 32: Asia Pacific Toys and Games Industry Volume (K Units), by Distribution Channel 2025 & 2033
- Figure 33: Asia Pacific Toys and Games Industry Revenue Share (%), by Distribution Channel 2025 & 2033
- Figure 34: Asia Pacific Toys and Games Industry Volume Share (%), by Distribution Channel 2025 & 2033
- Figure 35: Asia Pacific Toys and Games Industry Revenue (billion), by Country 2025 & 2033
- Figure 36: Asia Pacific Toys and Games Industry Volume (K Units), by Country 2025 & 2033
- Figure 37: Asia Pacific Toys and Games Industry Revenue Share (%), by Country 2025 & 2033
- Figure 38: Asia Pacific Toys and Games Industry Volume Share (%), by Country 2025 & 2033
- Figure 39: South America Toys and Games Industry Revenue (billion), by Product Type 2025 & 2033
- Figure 40: South America Toys and Games Industry Volume (K Units), by Product Type 2025 & 2033
- Figure 41: South America Toys and Games Industry Revenue Share (%), by Product Type 2025 & 2033
- Figure 42: South America Toys and Games Industry Volume Share (%), by Product Type 2025 & 2033
- Figure 43: South America Toys and Games Industry Revenue (billion), by Distribution Channel 2025 & 2033
- Figure 44: South America Toys and Games Industry Volume (K Units), by Distribution Channel 2025 & 2033
- Figure 45: South America Toys and Games Industry Revenue Share (%), by Distribution Channel 2025 & 2033
- Figure 46: South America Toys and Games Industry Volume Share (%), by Distribution Channel 2025 & 2033
- Figure 47: South America Toys and Games Industry Revenue (billion), by Country 2025 & 2033
- Figure 48: South America Toys and Games Industry Volume (K Units), by Country 2025 & 2033
- Figure 49: South America Toys and Games Industry Revenue Share (%), by Country 2025 & 2033
- Figure 50: South America Toys and Games Industry Volume Share (%), by Country 2025 & 2033
- Figure 51: Middle East and Africa Toys and Games Industry Revenue (billion), by Product Type 2025 & 2033
- Figure 52: Middle East and Africa Toys and Games Industry Volume (K Units), by Product Type 2025 & 2033
- Figure 53: Middle East and Africa Toys and Games Industry Revenue Share (%), by Product Type 2025 & 2033
- Figure 54: Middle East and Africa Toys and Games Industry Volume Share (%), by Product Type 2025 & 2033
- Figure 55: Middle East and Africa Toys and Games Industry Revenue (billion), by Distribution Channel 2025 & 2033
- Figure 56: Middle East and Africa Toys and Games Industry Volume (K Units), by Distribution Channel 2025 & 2033
- Figure 57: Middle East and Africa Toys and Games Industry Revenue Share (%), by Distribution Channel 2025 & 2033
- Figure 58: Middle East and Africa Toys and Games Industry Volume Share (%), by Distribution Channel 2025 & 2033
- Figure 59: Middle East and Africa Toys and Games Industry Revenue (billion), by Country 2025 & 2033
- Figure 60: Middle East and Africa Toys and Games Industry Volume (K Units), by Country 2025 & 2033
- Figure 61: Middle East and Africa Toys and Games Industry Revenue Share (%), by Country 2025 & 2033
- Figure 62: Middle East and Africa Toys and Games Industry Volume Share (%), by Country 2025 & 2033
List of Tables
- Table 1: Global Toys and Games Industry Revenue billion Forecast, by Product Type 2020 & 2033
- Table 2: Global Toys and Games Industry Volume K Units Forecast, by Product Type 2020 & 2033
- Table 3: Global Toys and Games Industry Revenue billion Forecast, by Distribution Channel 2020 & 2033
- Table 4: Global Toys and Games Industry Volume K Units Forecast, by Distribution Channel 2020 & 2033
- Table 5: Global Toys and Games Industry Revenue billion Forecast, by Region 2020 & 2033
- Table 6: Global Toys and Games Industry Volume K Units Forecast, by Region 2020 & 2033
- Table 7: Global Toys and Games Industry Revenue billion Forecast, by Product Type 2020 & 2033
- Table 8: Global Toys and Games Industry Volume K Units Forecast, by Product Type 2020 & 2033
- Table 9: Global Toys and Games Industry Revenue billion Forecast, by Distribution Channel 2020 & 2033
- Table 10: Global Toys and Games Industry Volume K Units Forecast, by Distribution Channel 2020 & 2033
- Table 11: Global Toys and Games Industry Revenue billion Forecast, by Country 2020 & 2033
- Table 12: Global Toys and Games Industry Volume K Units Forecast, by Country 2020 & 2033
- Table 13: United States Toys and Games Industry Revenue (billion) Forecast, by Application 2020 & 2033
- Table 14: United States Toys and Games Industry Volume (K Units) Forecast, by Application 2020 & 2033
- Table 15: Canada Toys and Games Industry Revenue (billion) Forecast, by Application 2020 & 2033
- Table 16: Canada Toys and Games Industry Volume (K Units) Forecast, by Application 2020 & 2033
- Table 17: Mexico Toys and Games Industry Revenue (billion) Forecast, by Application 2020 & 2033
- Table 18: Mexico Toys and Games Industry Volume (K Units) Forecast, by Application 2020 & 2033
- Table 19: Rest of North America Toys and Games Industry Revenue (billion) Forecast, by Application 2020 & 2033
- Table 20: Rest of North America Toys and Games Industry Volume (K Units) Forecast, by Application 2020 & 2033
- Table 21: Global Toys and Games Industry Revenue billion Forecast, by Product Type 2020 & 2033
- Table 22: Global Toys and Games Industry Volume K Units Forecast, by Product Type 2020 & 2033
- Table 23: Global Toys and Games Industry Revenue billion Forecast, by Distribution Channel 2020 & 2033
- Table 24: Global Toys and Games Industry Volume K Units Forecast, by Distribution Channel 2020 & 2033
- Table 25: Global Toys and Games Industry Revenue billion Forecast, by Country 2020 & 2033
- Table 26: Global Toys and Games Industry Volume K Units Forecast, by Country 2020 & 2033
- Table 27: Spain Toys and Games Industry Revenue (billion) Forecast, by Application 2020 & 2033
- Table 28: Spain Toys and Games Industry Volume (K Units) Forecast, by Application 2020 & 2033
- Table 29: United Kingdom Toys and Games Industry Revenue (billion) Forecast, by Application 2020 & 2033
- Table 30: United Kingdom Toys and Games Industry Volume (K Units) Forecast, by Application 2020 & 2033
- Table 31: Germany Toys and Games Industry Revenue (billion) Forecast, by Application 2020 & 2033
- Table 32: Germany Toys and Games Industry Volume (K Units) Forecast, by Application 2020 & 2033
- Table 33: France Toys and Games Industry Revenue (billion) Forecast, by Application 2020 & 2033
- Table 34: France Toys and Games Industry Volume (K Units) Forecast, by Application 2020 & 2033
- Table 35: Italy Toys and Games Industry Revenue (billion) Forecast, by Application 2020 & 2033
- Table 36: Italy Toys and Games Industry Volume (K Units) Forecast, by Application 2020 & 2033
- Table 37: Russia Toys and Games Industry Revenue (billion) Forecast, by Application 2020 & 2033
- Table 38: Russia Toys and Games Industry Volume (K Units) Forecast, by Application 2020 & 2033
- Table 39: Rest of Europe Toys and Games Industry Revenue (billion) Forecast, by Application 2020 & 2033
- Table 40: Rest of Europe Toys and Games Industry Volume (K Units) Forecast, by Application 2020 & 2033
- Table 41: Global Toys and Games Industry Revenue billion Forecast, by Product Type 2020 & 2033
- Table 42: Global Toys and Games Industry Volume K Units Forecast, by Product Type 2020 & 2033
- Table 43: Global Toys and Games Industry Revenue billion Forecast, by Distribution Channel 2020 & 2033
- Table 44: Global Toys and Games Industry Volume K Units Forecast, by Distribution Channel 2020 & 2033
- Table 45: Global Toys and Games Industry Revenue billion Forecast, by Country 2020 & 2033
- Table 46: Global Toys and Games Industry Volume K Units Forecast, by Country 2020 & 2033
- Table 47: China Toys and Games Industry Revenue (billion) Forecast, by Application 2020 & 2033
- Table 48: China Toys and Games Industry Volume (K Units) Forecast, by Application 2020 & 2033
- Table 49: Japan Toys and Games Industry Revenue (billion) Forecast, by Application 2020 & 2033
- Table 50: Japan Toys and Games Industry Volume (K Units) Forecast, by Application 2020 & 2033
- Table 51: India Toys and Games Industry Revenue (billion) Forecast, by Application 2020 & 2033
- Table 52: India Toys and Games Industry Volume (K Units) Forecast, by Application 2020 & 2033
- Table 53: Australia Toys and Games Industry Revenue (billion) Forecast, by Application 2020 & 2033
- Table 54: Australia Toys and Games Industry Volume (K Units) Forecast, by Application 2020 & 2033
- Table 55: Rest of Asia Pacific Toys and Games Industry Revenue (billion) Forecast, by Application 2020 & 2033
- Table 56: Rest of Asia Pacific Toys and Games Industry Volume (K Units) Forecast, by Application 2020 & 2033
- Table 57: Global Toys and Games Industry Revenue billion Forecast, by Product Type 2020 & 2033
- Table 58: Global Toys and Games Industry Volume K Units Forecast, by Product Type 2020 & 2033
- Table 59: Global Toys and Games Industry Revenue billion Forecast, by Distribution Channel 2020 & 2033
- Table 60: Global Toys and Games Industry Volume K Units Forecast, by Distribution Channel 2020 & 2033
- Table 61: Global Toys and Games Industry Revenue billion Forecast, by Country 2020 & 2033
- Table 62: Global Toys and Games Industry Volume K Units Forecast, by Country 2020 & 2033
- Table 63: Brazil Toys and Games Industry Revenue (billion) Forecast, by Application 2020 & 2033
- Table 64: Brazil Toys and Games Industry Volume (K Units) Forecast, by Application 2020 & 2033
- Table 65: Argentina Toys and Games Industry Revenue (billion) Forecast, by Application 2020 & 2033
- Table 66: Argentina Toys and Games Industry Volume (K Units) Forecast, by Application 2020 & 2033
- Table 67: Rest of South America Toys and Games Industry Revenue (billion) Forecast, by Application 2020 & 2033
- Table 68: Rest of South America Toys and Games Industry Volume (K Units) Forecast, by Application 2020 & 2033
- Table 69: Global Toys and Games Industry Revenue billion Forecast, by Product Type 2020 & 2033
- Table 70: Global Toys and Games Industry Volume K Units Forecast, by Product Type 2020 & 2033
- Table 71: Global Toys and Games Industry Revenue billion Forecast, by Distribution Channel 2020 & 2033
- Table 72: Global Toys and Games Industry Volume K Units Forecast, by Distribution Channel 2020 & 2033
- Table 73: Global Toys and Games Industry Revenue billion Forecast, by Country 2020 & 2033
- Table 74: Global Toys and Games Industry Volume K Units Forecast, by Country 2020 & 2033
- Table 75: South Africa Toys and Games Industry Revenue (billion) Forecast, by Application 2020 & 2033
- Table 76: South Africa Toys and Games Industry Volume (K Units) Forecast, by Application 2020 & 2033
- Table 77: Saudi Arabia Toys and Games Industry Revenue (billion) Forecast, by Application 2020 & 2033
- Table 78: Saudi Arabia Toys and Games Industry Volume (K Units) Forecast, by Application 2020 & 2033
- Table 79: Rest of Middle East and Africa Toys and Games Industry Revenue (billion) Forecast, by Application 2020 & 2033
- Table 80: Rest of Middle East and Africa Toys and Games Industry Volume (K Units) Forecast, by Application 2020 & 2033
Frequently Asked Questions
1. What is the projected Compound Annual Growth Rate (CAGR) of the Toys and Games Industry?
The projected CAGR is approximately 0.7%.
2. Which companies are prominent players in the Toys and Games Industry?
Key companies in the market include Mattel Inc, Hasbro Inc, Moose Enterprise Holdings Pty Ltd, Takara Tomy Co Ltd, AOSHIMA BUNKA KYOZAI Co Ltd, Lego Group, Simba-Dickie Group, Tru Kids Inc *List Not Exhaustive, Spin Master Ltd, Bandai Namco Holdings Inc.
3. What are the main segments of the Toys and Games Industry?
The market segments include Product Type, Distribution Channel.
4. Can you provide details about the market size?
The market size is estimated to be USD 1.7 billion as of 2022.
5. What are some drivers contributing to market growth?
Growing Appeal for Multi-functional and Damage Control Hair Care Products; Prevalence of Different Hair Concerns Remains the Major Driving Force.
6. What are the notable trends driving market growth?
Influence of Technology is Promoting Video Games.
7. Are there any restraints impacting market growth?
Growing Availability of Counterfeit Products.
8. Can you provide examples of recent developments in the market?
October 2022: The Lego Group announced the Lego Marvel Studios Release, The Iron Man Hulkbuster set, featuring Iron Man as he appeared in Infinity Saga - Age of Ultron, a mega-hit film.
9. What pricing options are available for accessing the report?
Pricing options include single-user, multi-user, and enterprise licenses priced at USD 4750, USD 5250, and USD 8750 respectively.
10. Is the market size provided in terms of value or volume?
The market size is provided in terms of value, measured in billion and volume, measured in K Units.
11. Are there any specific market keywords associated with the report?
Yes, the market keyword associated with the report is "Toys and Games Industry," which aids in identifying and referencing the specific market segment covered.
12. How do I determine which pricing option suits my needs best?
The pricing options vary based on user requirements and access needs. Individual users may opt for single-user licenses, while businesses requiring broader access may choose multi-user or enterprise licenses for cost-effective access to the report.
13. Are there any additional resources or data provided in the Toys and Games Industry report?
While the report offers comprehensive insights, it's advisable to review the specific contents or supplementary materials provided to ascertain if additional resources or data are available.
14. How can I stay updated on further developments or reports in the Toys and Games Industry?
To stay informed about further developments, trends, and reports in the Toys and Games Industry, consider subscribing to industry newsletters, following relevant companies and organizations, or regularly checking reputable industry news sources and publications.
Methodology
Step 1 - Identification of Relevant Samples Size from Population Database


Step 2 - Approaches for Defining Global Market Size (Value, Volume* & Price*)

Note*: In applicable scenarios
Step 3 - Data Sources
Primary Research
- Web Analytics
- Survey Reports
- Research Institute
- Latest Research Reports
- Opinion Leaders
Secondary Research
- Annual Reports
- White Paper
- Latest Press Release
- Industry Association
- Paid Database
- Investor Presentations

Step 4 - Data Triangulation
Involves using different sources of information in order to increase the validity of a study
These sources are likely to be stakeholders in a program - participants, other researchers, program staff, other community members, and so on.
Then we put all data in single framework & apply various statistical tools to find out the dynamic on the market.
During the analysis stage, feedback from the stakeholder groups would be compared to determine areas of agreement as well as areas of divergence