

Key Insights
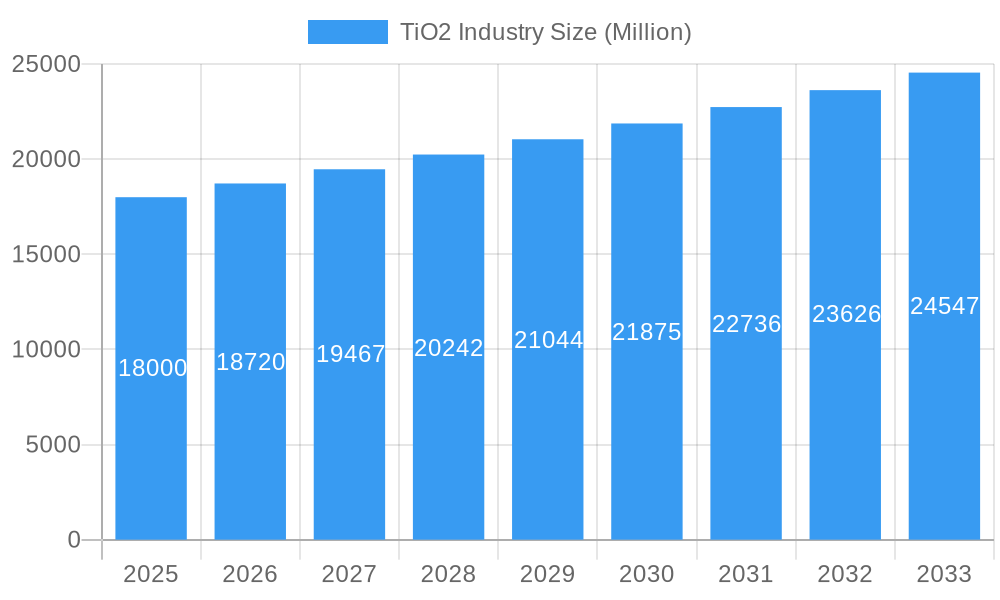
The global titanium dioxide (TiO2) market, valued at approximately $19.06 billion in 2025, is poised for significant expansion. Projections indicate a compound annual growth rate (CAGR) of 7.1% through 2033. This growth is primarily attributed to escalating demand from key sectors, including paints and coatings, where TiO2's exceptional brightening and opacity properties are essential. The plastics industry also represents a major consumer, leveraging TiO2 for its UV protection and color enhancement benefits. Sustained growth is further supported by increasing global construction and infrastructure development, which drives demand for paints and coatings, and the expanding packaging sector's reliance on plastics. Advancements in TiO2 production technologies, emphasizing enhanced pigment efficiency and environmental sustainability, are also pivotal. Challenges include fluctuating raw material costs and environmental considerations associated with TiO2 manufacturing. The market is segmented by grade (rutile and anatase) and key geographies: North America, Europe, and Asia Pacific are leading consumption regions.
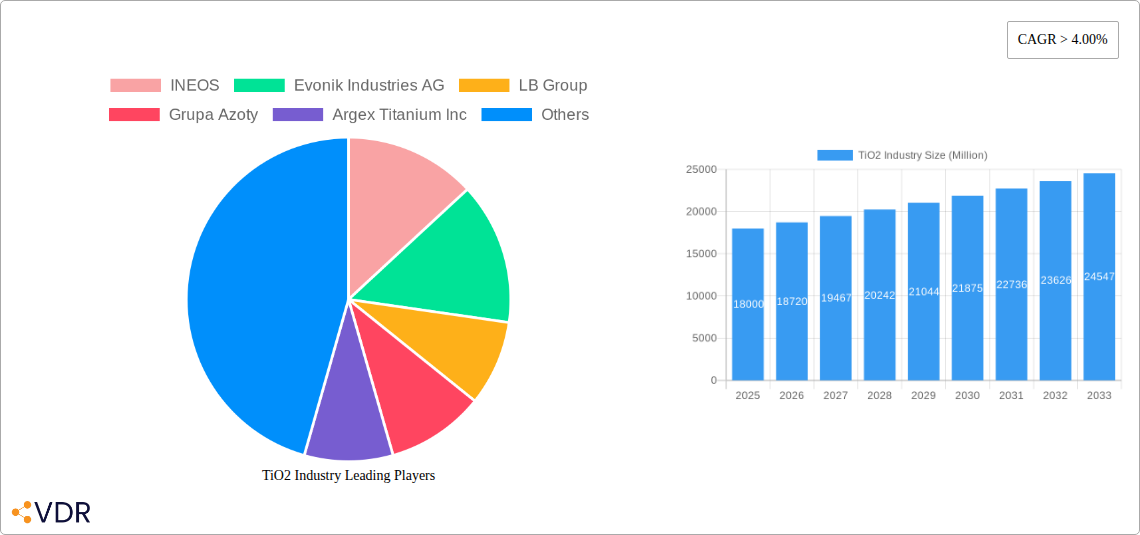
TiO2 Industry Market Size (In Billion)
Regional TiO2 consumption patterns mirror global economic and industrial trends. Asia Pacific, led by China and India, is a substantial and rapidly expanding market driven by vigorous construction and industrial output. North America and Europe, mature markets, demonstrate consistent growth from ongoing infrastructure projects and replacement demand. South America and the Middle East & Africa (MEA) are projected to experience moderate growth, fueled by economic development and increasing industrialization. While paints and coatings remain the dominant application segment, the plastics and paper & pulp sectors are exhibiting promising growth, influenced by consumer preferences for durable and visually appealing products. The future trajectory of the TiO2 market depends on harmonizing sustainable production with the growing global demand for this versatile pigment. Continuous innovation in pigment technology and responsible raw material sourcing will be critical for long-term industry success.
TiO2 Industry Company Market Share
TiO2 Industry Market Report: 2019-2033
This comprehensive report provides a detailed analysis of the TiO2 industry, encompassing market dynamics, growth trends, regional performance, key players, and future outlook. The study period covers 2019-2033, with a base year of 2025 and a forecast period of 2025-2033. This in-depth analysis is crucial for industry professionals, investors, and anyone seeking a comprehensive understanding of this vital market.
TiO2 Industry Market Dynamics & Structure
The TiO2 market is characterized by moderate concentration, with several major players holding significant market share. Technological innovation, driven by the demand for enhanced performance and sustainability, is a key driver. Stringent environmental regulations influence production processes and product formulations. Competitive substitutes, such as alternative pigments, exert pressure on pricing and market share. End-user demographics, particularly in the paints & coatings and plastics sectors, significantly impact demand. M&A activity has shaped the industry landscape, leading to consolidation and shifts in market power.
- Market Concentration: The top 10 companies hold approximately xx% of the global market share in 2025.
- Technological Innovation: Focus on developing more sustainable and efficient TiO2 production methods, including chloride and sulfate processes.
- Regulatory Framework: Stringent environmental regulations concerning heavy metal content and waste disposal are shaping production practices.
- Competitive Substitutes: Alternative pigments, such as zinc oxide and iron oxides, present competitive challenges.
- M&A Trends: Consolidation through mergers and acquisitions is expected to continue, driving further industry restructuring. xx M&A deals were recorded between 2019-2024, totaling an estimated value of xx Million.
TiO2 Industry Growth Trends & Insights
The TiO2 market exhibited a CAGR of xx% during the historical period (2019-2024), driven by strong demand from key application segments. The market size is projected to reach xx Million in 2025 and xx Million by 2033, demonstrating continued, albeit moderated, growth. Technological advancements, particularly in nanotechnology, are enabling the development of higher-performance TiO2 products. Shifting consumer preferences towards sustainable and eco-friendly materials are influencing product development and market adoption. The increasing adoption of TiO2 in emerging applications further contributes to market expansion.
Dominant Regions, Countries, or Segments in TiO2 Industry
Asia Pacific dominates the global TiO2 market, driven by robust economic growth, expanding infrastructure projects, and increased demand from various industries. Within this region, China and India are leading consumers. In terms of application segments, paints and coatings remain the largest consumer of TiO2, followed by plastics. Rutile grade holds a larger market share than anatase due to its superior properties.
- Key Drivers:
- Strong economic growth in Asia Pacific.
- Expanding construction and infrastructure development.
- Growing demand from the automotive and electronics industries.
- Dominance Factors:
- High consumption in developing economies.
- Favorable government policies and incentives.
- Established manufacturing base and lower production costs in certain regions.
TiO2 Industry Product Landscape
The TiO2 product landscape is characterized by a range of grades (rutile and anatase) with varying particle sizes and surface treatments. These variations cater to specific application requirements, offering customized performance characteristics. Recent innovations focus on enhancing brightness, opacity, and dispersibility while addressing sustainability concerns. The development of high-performance TiO2 with improved UV resistance and weatherability is a key focus area.
Key Drivers, Barriers & Challenges in TiO2 Industry
Key Drivers: Growing demand from the construction, automotive, and packaging sectors; advancements in TiO2 nanotechnology leading to improved performance in various applications; government initiatives promoting infrastructure development and industrial growth.
Key Challenges: Fluctuations in raw material prices (e.g., ilmenite); stringent environmental regulations impacting production costs; intense competition among major players; supply chain disruptions impacting availability and pricing. For example, the disruption of ilmenite supply in 2024 caused a price increase of xx Million.
Emerging Opportunities in TiO2 Industry
Emerging opportunities lie in the development of sustainable TiO2 production methods, the exploration of new applications in advanced materials and electronics, and tapping into emerging markets with rising disposable income. The growing demand for high-performance TiO2 in specialized applications like self-cleaning coatings and water purification systems presents significant growth potential.
Growth Accelerators in the TiO2 Industry
Strategic partnerships between TiO2 manufacturers and end-users to co-develop innovative solutions; technological breakthroughs enabling greater efficiency and sustainability in production processes; expansion into new geographical markets; government incentives promoting the use of sustainable and high-performance materials.
Key Players Shaping the TiO2 Industry Market
- INEOS
- Evonik Industries AG
- LB Group
- Grupa Azoty
- Argex Titanium Inc
- Kemipex
- Venator Materials PLC
- TAYCA
- The Chemours Company
- Tronox Holdings PLC
- Precheza
- KRONOS Worldwide Inc
- The Kish Company Inc
Notable Milestones in TiO2 Industry Sector
- August 2022: Chemours commenced mining at its new Florida sand mine, boosting TiO2 production capacity.
- January 2022: LB Group invested CNY 1 billion (USD 157.6 million) in a new 200ktpa TiO2 pigment finishing plant in Xiangyang.
In-Depth TiO2 Industry Market Outlook
The TiO2 market is poised for sustained growth, driven by technological advancements, increasing demand from key applications, and expansion into new markets. Strategic partnerships, investments in sustainable production methods, and the development of innovative products will shape the future of the industry. The focus on sustainability and higher performance materials will drive market expansion and create lucrative opportunities for key players.
TiO2 Industry Segmentation
-
1. Grade
- 1.1. Rutile
- 1.2. Anatase
-
2. Application
- 2.1. Paints and Coatings
- 2.2. Plastics
- 2.3. Paper and Pulp
- 2.4. Cosmetics
- 2.5. Other Applications (Leather, Textiles)
TiO2 Industry Segmentation By Geography
-
1. Asia Pacific
- 1.1. China
- 1.2. India
- 1.3. Japan
- 1.4. South Korea
- 1.5. Rest of Asia Pacific
-
2. North America
- 2.1. United States
- 2.2. Canada
- 2.3. Mexico
-
3. Europe
- 3.1. Germany
- 3.2. United Kingdom
- 3.3. France
- 3.4. Italy
- 3.5. Rest of Europe
-
4. South America
- 4.1. Brazil
- 4.2. Argentina
- 4.3. Rest of South America
-
5. Middle East and Africa
- 5.1. Saudi Arabia
- 5.2. South Africa
- 5.3. Rest of Middle East and Africa
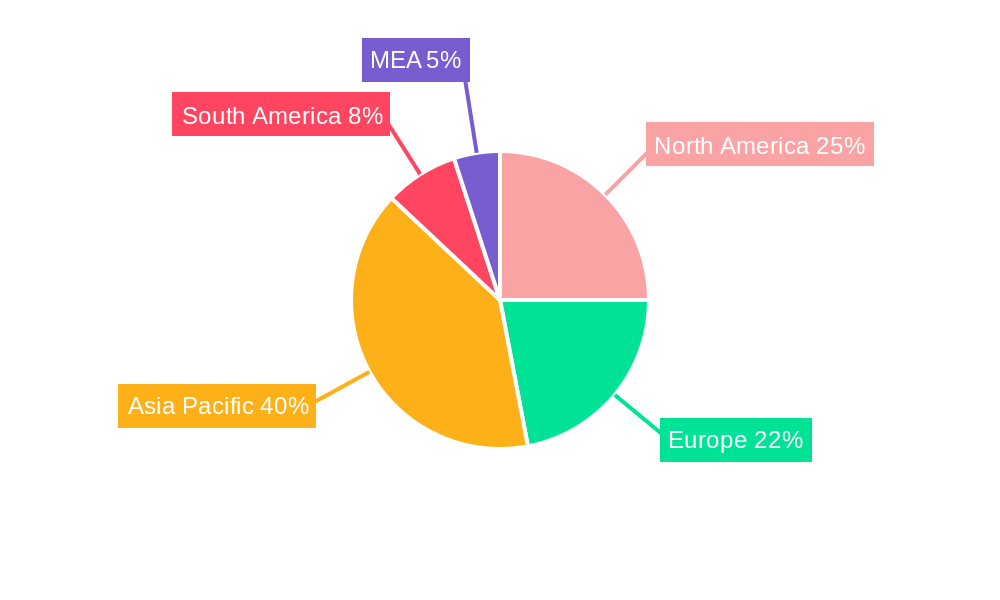
TiO2 Industry Regional Market Share
Geographic Coverage of TiO2 Industry
TiO2 Industry REPORT HIGHLIGHTS
| Aspects | Details |
|---|---|
| Study Period | 2020-2034 |
| Base Year | 2025 |
| Estimated Year | 2026 |
| Forecast Period | 2026-2034 |
| Historical Period | 2020-2025 |
| Growth Rate | CAGR of 7.1% from 2020-2034 |
| Segmentation |
|
Table of Contents
- 1. Introduction
- 1.1. Research Scope
- 1.2. Market Segmentation
- 1.3. Research Objective
- 1.4. Definitions and Assumptions
- 2. Executive Summary
- 2.1. Market Snapshot
- 3. Market Dynamics
- 3.1. Market Drivers
- 3.2. Market Restrains
- 3.3. Market Trends
- 3.4. Market Opportunities
- 4. Market Factor Analysis
- 4.1. Porters Five Forces
- 4.1.1. Bargaining Power of Suppliers
- 4.1.2. Bargaining Power of Buyers
- 4.1.3. Threat of New Entrants
- 4.1.4. Threat of Substitutes
- 4.1.5. Competitive Rivalry
- 4.2. PESTEL analysis
- 4.3. BCG Analysis
- 4.3.1. Stars (High Growth, High Market Share)
- 4.3.2. Cash Cows (Low Growth, High Market Share)
- 4.3.3. Question Mark (High Growth, Low Market Share)
- 4.3.4. Dogs (Low Growth, Low Market Share)
- 4.4. Ansoff Matrix Analysis
- 4.5. Supply Chain Analysis
- 4.6. Regulatory Landscape
- 4.7. Current Market Potential and Opportunity Assessment (TAM–SAM–SOM Framework)
- 4.8. VDR Analyst Note
- 4.1. Porters Five Forces
- 5. Market Analysis, Insights and Forecast 2021-2033
- 5.1. Market Analysis, Insights and Forecast - by Grade
- 5.1.1. Rutile
- 5.1.2. Anatase
- 5.2. Market Analysis, Insights and Forecast - by Application
- 5.2.1. Paints and Coatings
- 5.2.2. Plastics
- 5.2.3. Paper and Pulp
- 5.2.4. Cosmetics
- 5.2.5. Other Applications (Leather, Textiles)
- 5.3. Market Analysis, Insights and Forecast - by Region
- 5.3.1. Asia Pacific
- 5.3.2. North America
- 5.3.3. Europe
- 5.3.4. South America
- 5.3.5. Middle East and Africa
- 5.1. Market Analysis, Insights and Forecast - by Grade
- 6. Global TiO2 Industry Analysis, Insights and Forecast, 2021-2033
- 6.1. Market Analysis, Insights and Forecast - by Grade
- 6.1.1. Rutile
- 6.1.2. Anatase
- 6.2. Market Analysis, Insights and Forecast - by Application
- 6.2.1. Paints and Coatings
- 6.2.2. Plastics
- 6.2.3. Paper and Pulp
- 6.2.4. Cosmetics
- 6.2.5. Other Applications (Leather, Textiles)
- 6.1. Market Analysis, Insights and Forecast - by Grade
- 7. Asia Pacific TiO2 Industry Analysis, Insights and Forecast, 2021-2033
- 7.1. Market Analysis, Insights and Forecast - by Grade
- 7.1.1. Rutile
- 7.1.2. Anatase
- 7.2. Market Analysis, Insights and Forecast - by Application
- 7.2.1. Paints and Coatings
- 7.2.2. Plastics
- 7.2.3. Paper and Pulp
- 7.2.4. Cosmetics
- 7.2.5. Other Applications (Leather, Textiles)
- 7.1. Market Analysis, Insights and Forecast - by Grade
- 8. North America TiO2 Industry Analysis, Insights and Forecast, 2021-2033
- 8.1. Market Analysis, Insights and Forecast - by Grade
- 8.1.1. Rutile
- 8.1.2. Anatase
- 8.2. Market Analysis, Insights and Forecast - by Application
- 8.2.1. Paints and Coatings
- 8.2.2. Plastics
- 8.2.3. Paper and Pulp
- 8.2.4. Cosmetics
- 8.2.5. Other Applications (Leather, Textiles)
- 8.1. Market Analysis, Insights and Forecast - by Grade
- 9. Europe TiO2 Industry Analysis, Insights and Forecast, 2021-2033
- 9.1. Market Analysis, Insights and Forecast - by Grade
- 9.1.1. Rutile
- 9.1.2. Anatase
- 9.2. Market Analysis, Insights and Forecast - by Application
- 9.2.1. Paints and Coatings
- 9.2.2. Plastics
- 9.2.3. Paper and Pulp
- 9.2.4. Cosmetics
- 9.2.5. Other Applications (Leather, Textiles)
- 9.1. Market Analysis, Insights and Forecast - by Grade
- 10. South America TiO2 Industry Analysis, Insights and Forecast, 2021-2033
- 10.1. Market Analysis, Insights and Forecast - by Grade
- 10.1.1. Rutile
- 10.1.2. Anatase
- 10.2. Market Analysis, Insights and Forecast - by Application
- 10.2.1. Paints and Coatings
- 10.2.2. Plastics
- 10.2.3. Paper and Pulp
- 10.2.4. Cosmetics
- 10.2.5. Other Applications (Leather, Textiles)
- 10.1. Market Analysis, Insights and Forecast - by Grade
- 11. Middle East and Africa TiO2 Industry Analysis, Insights and Forecast, 2021-2033
- 11.1. Market Analysis, Insights and Forecast - by Grade
- 11.1.1. Rutile
- 11.1.2. Anatase
- 11.2. Market Analysis, Insights and Forecast - by Application
- 11.2.1. Paints and Coatings
- 11.2.2. Plastics
- 11.2.3. Paper and Pulp
- 11.2.4. Cosmetics
- 11.2.5. Other Applications (Leather, Textiles)
- 11.1. Market Analysis, Insights and Forecast - by Grade
- 12. Competitive Analysis
- 12.1. Company Profiles
- 12.1.1 INEOS
- 12.1.1.1. Company Overview
- 12.1.1.2. Products
- 12.1.1.3. Company Financials
- 12.1.1.4. SWOT Analysis
- 12.1.2 Evonik Industries AG
- 12.1.2.1. Company Overview
- 12.1.2.2. Products
- 12.1.2.3. Company Financials
- 12.1.2.4. SWOT Analysis
- 12.1.3 LB Group
- 12.1.3.1. Company Overview
- 12.1.3.2. Products
- 12.1.3.3. Company Financials
- 12.1.3.4. SWOT Analysis
- 12.1.4 Grupa Azoty
- 12.1.4.1. Company Overview
- 12.1.4.2. Products
- 12.1.4.3. Company Financials
- 12.1.4.4. SWOT Analysis
- 12.1.5 Argex Titanium Inc
- 12.1.5.1. Company Overview
- 12.1.5.2. Products
- 12.1.5.3. Company Financials
- 12.1.5.4. SWOT Analysis
- 12.1.6 Kemipex
- 12.1.6.1. Company Overview
- 12.1.6.2. Products
- 12.1.6.3. Company Financials
- 12.1.6.4. SWOT Analysis
- 12.1.7 Venator Materials PLC
- 12.1.7.1. Company Overview
- 12.1.7.2. Products
- 12.1.7.3. Company Financials
- 12.1.7.4. SWOT Analysis
- 12.1.8 TAYCA
- 12.1.8.1. Company Overview
- 12.1.8.2. Products
- 12.1.8.3. Company Financials
- 12.1.8.4. SWOT Analysis
- 12.1.9 The Chemours Company
- 12.1.9.1. Company Overview
- 12.1.9.2. Products
- 12.1.9.3. Company Financials
- 12.1.9.4. SWOT Analysis
- 12.1.10 Tronox Holdings PLC
- 12.1.10.1. Company Overview
- 12.1.10.2. Products
- 12.1.10.3. Company Financials
- 12.1.10.4. SWOT Analysis
- 12.1.11 Precheza
- 12.1.11.1. Company Overview
- 12.1.11.2. Products
- 12.1.11.3. Company Financials
- 12.1.11.4. SWOT Analysis
- 12.1.12 KRONOS Worldwide Inc
- 12.1.12.1. Company Overview
- 12.1.12.2. Products
- 12.1.12.3. Company Financials
- 12.1.12.4. SWOT Analysis
- 12.1.13 The Kish Company Inc
- 12.1.13.1. Company Overview
- 12.1.13.2. Products
- 12.1.13.3. Company Financials
- 12.1.13.4. SWOT Analysis
- 12.1.1 INEOS
- 12.2. Market Entropy
- 12.2.1 Company's Key Areas Served
- 12.2.2 Recent Developments
- 12.3. Company Market Share Analysis 2025
- 12.3.1 Top 5 Companies Market Share Analysis
- 12.3.2 Top 3 Companies Market Share Analysis
- 12.4. List of Potential Customers
- 13. Research Methodology
List of Figures
- Figure 1: Global TiO2 Industry Revenue Breakdown (billion, %) by Region 2025 & 2033
- Figure 2: Global TiO2 Industry Volume Breakdown (K Tons, %) by Region 2025 & 2033
- Figure 3: Asia Pacific TiO2 Industry Revenue (billion), by Grade 2025 & 2033
- Figure 4: Asia Pacific TiO2 Industry Volume (K Tons), by Grade 2025 & 2033
- Figure 5: Asia Pacific TiO2 Industry Revenue Share (%), by Grade 2025 & 2033
- Figure 6: Asia Pacific TiO2 Industry Volume Share (%), by Grade 2025 & 2033
- Figure 7: Asia Pacific TiO2 Industry Revenue (billion), by Application 2025 & 2033
- Figure 8: Asia Pacific TiO2 Industry Volume (K Tons), by Application 2025 & 2033
- Figure 9: Asia Pacific TiO2 Industry Revenue Share (%), by Application 2025 & 2033
- Figure 10: Asia Pacific TiO2 Industry Volume Share (%), by Application 2025 & 2033
- Figure 11: Asia Pacific TiO2 Industry Revenue (billion), by Country 2025 & 2033
- Figure 12: Asia Pacific TiO2 Industry Volume (K Tons), by Country 2025 & 2033
- Figure 13: Asia Pacific TiO2 Industry Revenue Share (%), by Country 2025 & 2033
- Figure 14: Asia Pacific TiO2 Industry Volume Share (%), by Country 2025 & 2033
- Figure 15: North America TiO2 Industry Revenue (billion), by Grade 2025 & 2033
- Figure 16: North America TiO2 Industry Volume (K Tons), by Grade 2025 & 2033
- Figure 17: North America TiO2 Industry Revenue Share (%), by Grade 2025 & 2033
- Figure 18: North America TiO2 Industry Volume Share (%), by Grade 2025 & 2033
- Figure 19: North America TiO2 Industry Revenue (billion), by Application 2025 & 2033
- Figure 20: North America TiO2 Industry Volume (K Tons), by Application 2025 & 2033
- Figure 21: North America TiO2 Industry Revenue Share (%), by Application 2025 & 2033
- Figure 22: North America TiO2 Industry Volume Share (%), by Application 2025 & 2033
- Figure 23: North America TiO2 Industry Revenue (billion), by Country 2025 & 2033
- Figure 24: North America TiO2 Industry Volume (K Tons), by Country 2025 & 2033
- Figure 25: North America TiO2 Industry Revenue Share (%), by Country 2025 & 2033
- Figure 26: North America TiO2 Industry Volume Share (%), by Country 2025 & 2033
- Figure 27: Europe TiO2 Industry Revenue (billion), by Grade 2025 & 2033
- Figure 28: Europe TiO2 Industry Volume (K Tons), by Grade 2025 & 2033
- Figure 29: Europe TiO2 Industry Revenue Share (%), by Grade 2025 & 2033
- Figure 30: Europe TiO2 Industry Volume Share (%), by Grade 2025 & 2033
- Figure 31: Europe TiO2 Industry Revenue (billion), by Application 2025 & 2033
- Figure 32: Europe TiO2 Industry Volume (K Tons), by Application 2025 & 2033
- Figure 33: Europe TiO2 Industry Revenue Share (%), by Application 2025 & 2033
- Figure 34: Europe TiO2 Industry Volume Share (%), by Application 2025 & 2033
- Figure 35: Europe TiO2 Industry Revenue (billion), by Country 2025 & 2033
- Figure 36: Europe TiO2 Industry Volume (K Tons), by Country 2025 & 2033
- Figure 37: Europe TiO2 Industry Revenue Share (%), by Country 2025 & 2033
- Figure 38: Europe TiO2 Industry Volume Share (%), by Country 2025 & 2033
- Figure 39: South America TiO2 Industry Revenue (billion), by Grade 2025 & 2033
- Figure 40: South America TiO2 Industry Volume (K Tons), by Grade 2025 & 2033
- Figure 41: South America TiO2 Industry Revenue Share (%), by Grade 2025 & 2033
- Figure 42: South America TiO2 Industry Volume Share (%), by Grade 2025 & 2033
- Figure 43: South America TiO2 Industry Revenue (billion), by Application 2025 & 2033
- Figure 44: South America TiO2 Industry Volume (K Tons), by Application 2025 & 2033
- Figure 45: South America TiO2 Industry Revenue Share (%), by Application 2025 & 2033
- Figure 46: South America TiO2 Industry Volume Share (%), by Application 2025 & 2033
- Figure 47: South America TiO2 Industry Revenue (billion), by Country 2025 & 2033
- Figure 48: South America TiO2 Industry Volume (K Tons), by Country 2025 & 2033
- Figure 49: South America TiO2 Industry Revenue Share (%), by Country 2025 & 2033
- Figure 50: South America TiO2 Industry Volume Share (%), by Country 2025 & 2033
- Figure 51: Middle East and Africa TiO2 Industry Revenue (billion), by Grade 2025 & 2033
- Figure 52: Middle East and Africa TiO2 Industry Volume (K Tons), by Grade 2025 & 2033
- Figure 53: Middle East and Africa TiO2 Industry Revenue Share (%), by Grade 2025 & 2033
- Figure 54: Middle East and Africa TiO2 Industry Volume Share (%), by Grade 2025 & 2033
- Figure 55: Middle East and Africa TiO2 Industry Revenue (billion), by Application 2025 & 2033
- Figure 56: Middle East and Africa TiO2 Industry Volume (K Tons), by Application 2025 & 2033
- Figure 57: Middle East and Africa TiO2 Industry Revenue Share (%), by Application 2025 & 2033
- Figure 58: Middle East and Africa TiO2 Industry Volume Share (%), by Application 2025 & 2033
- Figure 59: Middle East and Africa TiO2 Industry Revenue (billion), by Country 2025 & 2033
- Figure 60: Middle East and Africa TiO2 Industry Volume (K Tons), by Country 2025 & 2033
- Figure 61: Middle East and Africa TiO2 Industry Revenue Share (%), by Country 2025 & 2033
- Figure 62: Middle East and Africa TiO2 Industry Volume Share (%), by Country 2025 & 2033
List of Tables
- Table 1: Global TiO2 Industry Revenue billion Forecast, by Grade 2020 & 2033
- Table 2: Global TiO2 Industry Volume K Tons Forecast, by Grade 2020 & 2033
- Table 3: Global TiO2 Industry Revenue billion Forecast, by Application 2020 & 2033
- Table 4: Global TiO2 Industry Volume K Tons Forecast, by Application 2020 & 2033
- Table 5: Global TiO2 Industry Revenue billion Forecast, by Region 2020 & 2033
- Table 6: Global TiO2 Industry Volume K Tons Forecast, by Region 2020 & 2033
- Table 7: Global TiO2 Industry Revenue billion Forecast, by Grade 2020 & 2033
- Table 8: Global TiO2 Industry Volume K Tons Forecast, by Grade 2020 & 2033
- Table 9: Global TiO2 Industry Revenue billion Forecast, by Application 2020 & 2033
- Table 10: Global TiO2 Industry Volume K Tons Forecast, by Application 2020 & 2033
- Table 11: Global TiO2 Industry Revenue billion Forecast, by Country 2020 & 2033
- Table 12: Global TiO2 Industry Volume K Tons Forecast, by Country 2020 & 2033
- Table 13: China TiO2 Industry Revenue (billion) Forecast, by Application 2020 & 2033
- Table 14: China TiO2 Industry Volume (K Tons) Forecast, by Application 2020 & 2033
- Table 15: India TiO2 Industry Revenue (billion) Forecast, by Application 2020 & 2033
- Table 16: India TiO2 Industry Volume (K Tons) Forecast, by Application 2020 & 2033
- Table 17: Japan TiO2 Industry Revenue (billion) Forecast, by Application 2020 & 2033
- Table 18: Japan TiO2 Industry Volume (K Tons) Forecast, by Application 2020 & 2033
- Table 19: South Korea TiO2 Industry Revenue (billion) Forecast, by Application 2020 & 2033
- Table 20: South Korea TiO2 Industry Volume (K Tons) Forecast, by Application 2020 & 2033
- Table 21: Rest of Asia Pacific TiO2 Industry Revenue (billion) Forecast, by Application 2020 & 2033
- Table 22: Rest of Asia Pacific TiO2 Industry Volume (K Tons) Forecast, by Application 2020 & 2033
- Table 23: Global TiO2 Industry Revenue billion Forecast, by Grade 2020 & 2033
- Table 24: Global TiO2 Industry Volume K Tons Forecast, by Grade 2020 & 2033
- Table 25: Global TiO2 Industry Revenue billion Forecast, by Application 2020 & 2033
- Table 26: Global TiO2 Industry Volume K Tons Forecast, by Application 2020 & 2033
- Table 27: Global TiO2 Industry Revenue billion Forecast, by Country 2020 & 2033
- Table 28: Global TiO2 Industry Volume K Tons Forecast, by Country 2020 & 2033
- Table 29: United States TiO2 Industry Revenue (billion) Forecast, by Application 2020 & 2033
- Table 30: United States TiO2 Industry Volume (K Tons) Forecast, by Application 2020 & 2033
- Table 31: Canada TiO2 Industry Revenue (billion) Forecast, by Application 2020 & 2033
- Table 32: Canada TiO2 Industry Volume (K Tons) Forecast, by Application 2020 & 2033
- Table 33: Mexico TiO2 Industry Revenue (billion) Forecast, by Application 2020 & 2033
- Table 34: Mexico TiO2 Industry Volume (K Tons) Forecast, by Application 2020 & 2033
- Table 35: Global TiO2 Industry Revenue billion Forecast, by Grade 2020 & 2033
- Table 36: Global TiO2 Industry Volume K Tons Forecast, by Grade 2020 & 2033
- Table 37: Global TiO2 Industry Revenue billion Forecast, by Application 2020 & 2033
- Table 38: Global TiO2 Industry Volume K Tons Forecast, by Application 2020 & 2033
- Table 39: Global TiO2 Industry Revenue billion Forecast, by Country 2020 & 2033
- Table 40: Global TiO2 Industry Volume K Tons Forecast, by Country 2020 & 2033
- Table 41: Germany TiO2 Industry Revenue (billion) Forecast, by Application 2020 & 2033
- Table 42: Germany TiO2 Industry Volume (K Tons) Forecast, by Application 2020 & 2033
- Table 43: United Kingdom TiO2 Industry Revenue (billion) Forecast, by Application 2020 & 2033
- Table 44: United Kingdom TiO2 Industry Volume (K Tons) Forecast, by Application 2020 & 2033
- Table 45: France TiO2 Industry Revenue (billion) Forecast, by Application 2020 & 2033
- Table 46: France TiO2 Industry Volume (K Tons) Forecast, by Application 2020 & 2033
- Table 47: Italy TiO2 Industry Revenue (billion) Forecast, by Application 2020 & 2033
- Table 48: Italy TiO2 Industry Volume (K Tons) Forecast, by Application 2020 & 2033
- Table 49: Rest of Europe TiO2 Industry Revenue (billion) Forecast, by Application 2020 & 2033
- Table 50: Rest of Europe TiO2 Industry Volume (K Tons) Forecast, by Application 2020 & 2033
- Table 51: Global TiO2 Industry Revenue billion Forecast, by Grade 2020 & 2033
- Table 52: Global TiO2 Industry Volume K Tons Forecast, by Grade 2020 & 2033
- Table 53: Global TiO2 Industry Revenue billion Forecast, by Application 2020 & 2033
- Table 54: Global TiO2 Industry Volume K Tons Forecast, by Application 2020 & 2033
- Table 55: Global TiO2 Industry Revenue billion Forecast, by Country 2020 & 2033
- Table 56: Global TiO2 Industry Volume K Tons Forecast, by Country 2020 & 2033
- Table 57: Brazil TiO2 Industry Revenue (billion) Forecast, by Application 2020 & 2033
- Table 58: Brazil TiO2 Industry Volume (K Tons) Forecast, by Application 2020 & 2033
- Table 59: Argentina TiO2 Industry Revenue (billion) Forecast, by Application 2020 & 2033
- Table 60: Argentina TiO2 Industry Volume (K Tons) Forecast, by Application 2020 & 2033
- Table 61: Rest of South America TiO2 Industry Revenue (billion) Forecast, by Application 2020 & 2033
- Table 62: Rest of South America TiO2 Industry Volume (K Tons) Forecast, by Application 2020 & 2033
- Table 63: Global TiO2 Industry Revenue billion Forecast, by Grade 2020 & 2033
- Table 64: Global TiO2 Industry Volume K Tons Forecast, by Grade 2020 & 2033
- Table 65: Global TiO2 Industry Revenue billion Forecast, by Application 2020 & 2033
- Table 66: Global TiO2 Industry Volume K Tons Forecast, by Application 2020 & 2033
- Table 67: Global TiO2 Industry Revenue billion Forecast, by Country 2020 & 2033
- Table 68: Global TiO2 Industry Volume K Tons Forecast, by Country 2020 & 2033
- Table 69: Saudi Arabia TiO2 Industry Revenue (billion) Forecast, by Application 2020 & 2033
- Table 70: Saudi Arabia TiO2 Industry Volume (K Tons) Forecast, by Application 2020 & 2033
- Table 71: South Africa TiO2 Industry Revenue (billion) Forecast, by Application 2020 & 2033
- Table 72: South Africa TiO2 Industry Volume (K Tons) Forecast, by Application 2020 & 2033
- Table 73: Rest of Middle East and Africa TiO2 Industry Revenue (billion) Forecast, by Application 2020 & 2033
- Table 74: Rest of Middle East and Africa TiO2 Industry Volume (K Tons) Forecast, by Application 2020 & 2033
Frequently Asked Questions
1. What is the projected Compound Annual Growth Rate (CAGR) of the TiO2 Industry?
The projected CAGR is approximately 7.1%.
2. Which companies are prominent players in the TiO2 Industry?
Key companies in the market include INEOS, Evonik Industries AG, LB Group, Grupa Azoty, Argex Titanium Inc, Kemipex, Venator Materials PLC, TAYCA, The Chemours Company, Tronox Holdings PLC, Precheza, KRONOS Worldwide Inc, The Kish Company Inc.
3. What are the main segments of the TiO2 Industry?
The market segments include Grade, Application.
4. Can you provide details about the market size?
The market size is estimated to be USD 19.06 billion as of 2022.
5. What are some drivers contributing to market growth?
Rapidly Increasing Demand for Paints and Coatings; Other Drivers.
6. What are the notable trends driving market growth?
Paints and Coatings Segment is Expected to Dominate the Market.
7. Are there any restraints impacting market growth?
Toxicity and Stringent Environmental Policies of Titanium Dioxide; Other Restraints.
8. Can you provide examples of recent developments in the market?
In August 2022, Chemours started mining at its newest sand mine in Florida, which will increase the company's titanium oxide production. Chemours will get ilmenite from the mine, which will be used in their chloride-based TiO2 synthesis process. The site's mining life should be eight years.
9. What pricing options are available for accessing the report?
Pricing options include single-user, multi-user, and enterprise licenses priced at USD 4750, USD 5250, and USD 8750 respectively.
10. Is the market size provided in terms of value or volume?
The market size is provided in terms of value, measured in billion and volume, measured in K Tons.
11. Are there any specific market keywords associated with the report?
Yes, the market keyword associated with the report is "TiO2 Industry," which aids in identifying and referencing the specific market segment covered.
12. How do I determine which pricing option suits my needs best?
The pricing options vary based on user requirements and access needs. Individual users may opt for single-user licenses, while businesses requiring broader access may choose multi-user or enterprise licenses for cost-effective access to the report.
13. Are there any additional resources or data provided in the TiO2 Industry report?
While the report offers comprehensive insights, it's advisable to review the specific contents or supplementary materials provided to ascertain if additional resources or data are available.
14. How can I stay updated on further developments or reports in the TiO2 Industry?
To stay informed about further developments, trends, and reports in the TiO2 Industry, consider subscribing to industry newsletters, following relevant companies and organizations, or regularly checking reputable industry news sources and publications.
Methodology
Step 1 - Identification of Relevant Samples Size from Population Database


Step 2 - Approaches for Defining Global Market Size (Value, Volume* & Price*)

Note*: In applicable scenarios
Step 3 - Data Sources
Primary Research
- Web Analytics
- Survey Reports
- Research Institute
- Latest Research Reports
- Opinion Leaders
Secondary Research
- Annual Reports
- White Paper
- Latest Press Release
- Industry Association
- Paid Database
- Investor Presentations

Step 4 - Data Triangulation
Involves using different sources of information in order to increase the validity of a study
These sources are likely to be stakeholders in a program - participants, other researchers, program staff, other community members, and so on.
Then we put all data in single framework & apply various statistical tools to find out the dynamic on the market.
During the analysis stage, feedback from the stakeholder groups would be compared to determine areas of agreement as well as areas of divergence