

Key Insights
The global thin-wall container market is poised for substantial expansion, driven by rising demand across a spectrum of end-use industries. Key growth drivers include the inherent lightweight properties of these containers, which reduce transportation costs and environmental impact, their remarkable versatility for diverse product applications, and a growing consumer preference for convenient, recyclable packaging solutions. The market is projected to achieve a Compound Annual Growth Rate (CAGR) of 6.27%, reaching an estimated market size of 43.94 billion by 2025. Segmentation analysis highlights significant growth opportunities within materials such as polypropylene (PP) and polyethylene terephthalate (PET), attributed to their cost-effectiveness and recyclability. The food & beverage sector is a primary demand driver, followed by the cosmetics and pharmaceuticals industries. Geographically, North America and Europe currently dominate market share, while the Asia-Pacific region is anticipated to experience the most rapid growth due to escalating consumption and industrialization. The competitive landscape is characterized by a blend of established corporations and agile regional enterprises, fostering innovation and market dynamism. Key challenges revolve around raw material price volatility and evolving regulations on plastic waste management, necessitating strategic investments in sustainable packaging technologies.
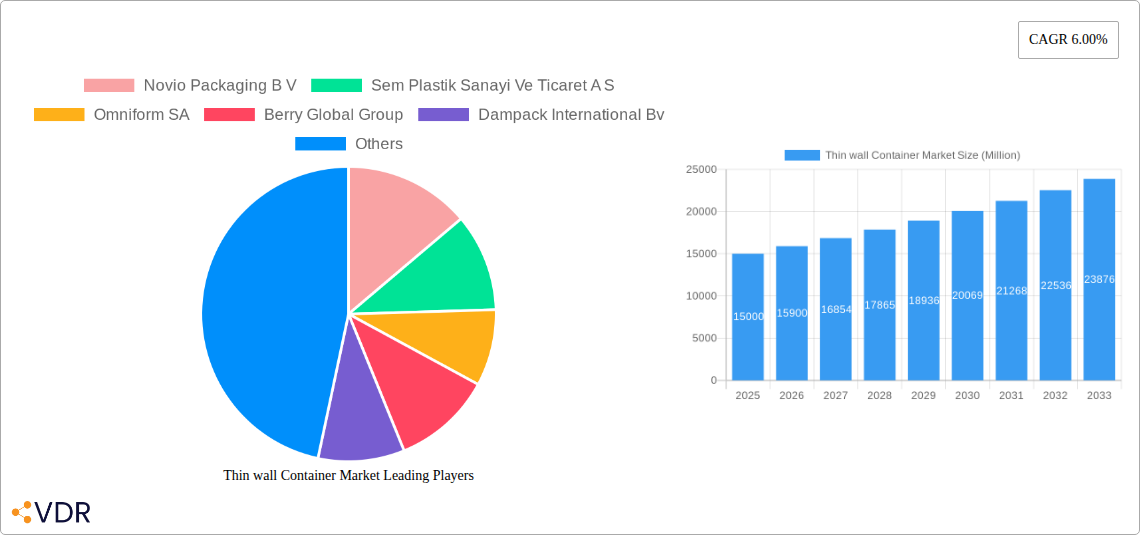
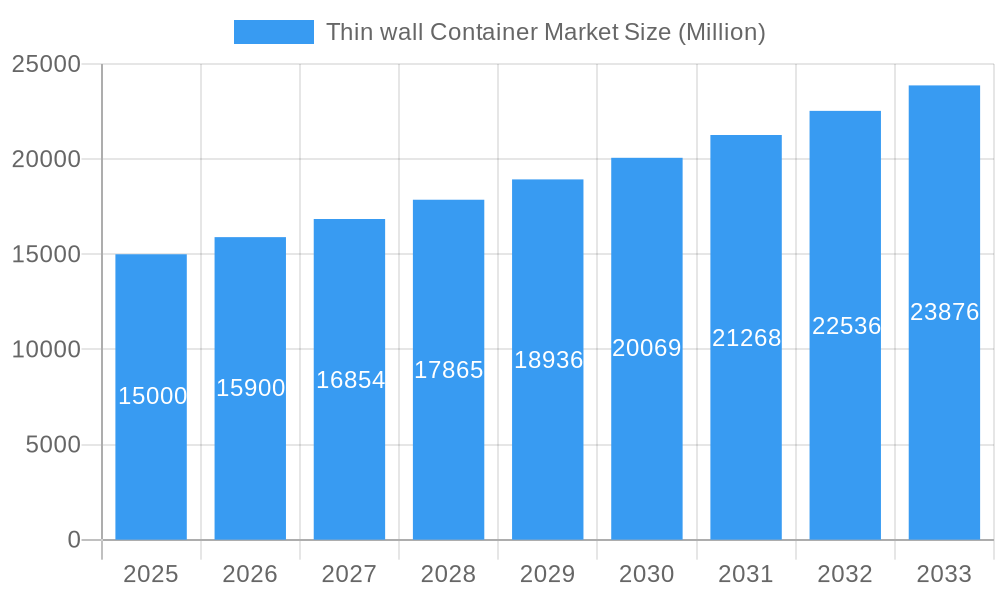
Thin wall Container Market Market Size (In Billion)
The burgeoning e-commerce sector and the increasing demand for single-serve and ready-to-eat meal options are further catalyzing market growth. Advancements in thin-wall container manufacturing, including enhanced barrier properties and extended product shelf life, are also significant contributors. Companies are actively investing in research and development to pioneer eco-friendly and sustainable alternatives, aligning with escalating consumer demand for environmentally conscious packaging. This emphasis on sustainability, coupled with technological progress, is expected to redefine future market trajectories, promoting the adoption of recyclable and biodegradable materials. Anticipated intensification of competition will see new entrants and existing players competing through differentiated product offerings, superior customer service, and strategic collaborations.
Thin wall Container Market Company Market Share
Thin Wall Container Market: A Comprehensive Report (2019-2033)
This comprehensive report provides a detailed analysis of the global thin wall container market, encompassing market dynamics, growth trends, regional dominance, product landscape, key challenges, emerging opportunities, and a look at the key players shaping this dynamic industry. The study period covers 2019-2033, with 2025 as the base and estimated year. The forecast period spans 2025-2033, and the historical period encompasses 2019-2024. The report serves as an invaluable resource for industry professionals, investors, and strategic decision-makers seeking a deep understanding of this vital sector within the broader packaging industry. Market values are presented in million units.
Thin Wall Container Market Market Dynamics & Structure
The thin wall container market is characterized by moderate concentration, with several key players holding significant market share. Technological innovation, particularly in materials science and manufacturing processes, is a crucial driver of growth. Stringent regulatory frameworks regarding food safety and environmental sustainability significantly influence product development and market access. The market faces competition from alternative packaging solutions, such as paperboard and flexible packaging, while mergers and acquisitions (M&A) activity contributes to market consolidation and expansion. Over the historical period (2019-2024), approximately xx M&A deals were recorded, resulting in a xx% increase in market concentration.
- Market Concentration: Moderately concentrated, with top 5 players holding approximately xx% market share in 2024.
- Technological Innovation: Focus on lightweighting, improved barrier properties, and sustainable materials (e.g., bioplastics).
- Regulatory Framework: Stringent regulations regarding food contact materials and recyclability are driving innovation in sustainable packaging solutions.
- Competitive Substitutes: Paperboard, flexible films, and alternative materials present competitive pressure.
- End-User Demographics: Growing demand from the food & beverage, pharmaceutical and cosmetic sectors.
- M&A Trends: Consolidation through acquisitions and mergers is expected to continue, driving market concentration further. Innovation barriers include high R&D costs and stringent regulatory approvals.
Thin Wall Container Market Growth Trends & Insights
The global thin wall container market experienced significant growth during the historical period (2019-2024), driven by increasing demand from various end-user industries. The market size reached xx million units in 2024, exhibiting a Compound Annual Growth Rate (CAGR) of xx% from 2019 to 2024. This growth is attributed to factors such as rising disposable incomes, changing consumer preferences towards convenient packaging, and the expanding food and beverage industry. Technological advancements, like the introduction of lightweight and sustainable materials, have further boosted market adoption. The forecast period (2025-2033) is projected to witness sustained growth, with a projected CAGR of xx%, driven by increasing demand from emerging economies and continued innovation in materials and manufacturing processes. Market penetration is expected to increase from xx% in 2024 to xx% by 2033. Consumer behavior shifts towards eco-friendly packaging will also play a significant role in shaping the market’s future.
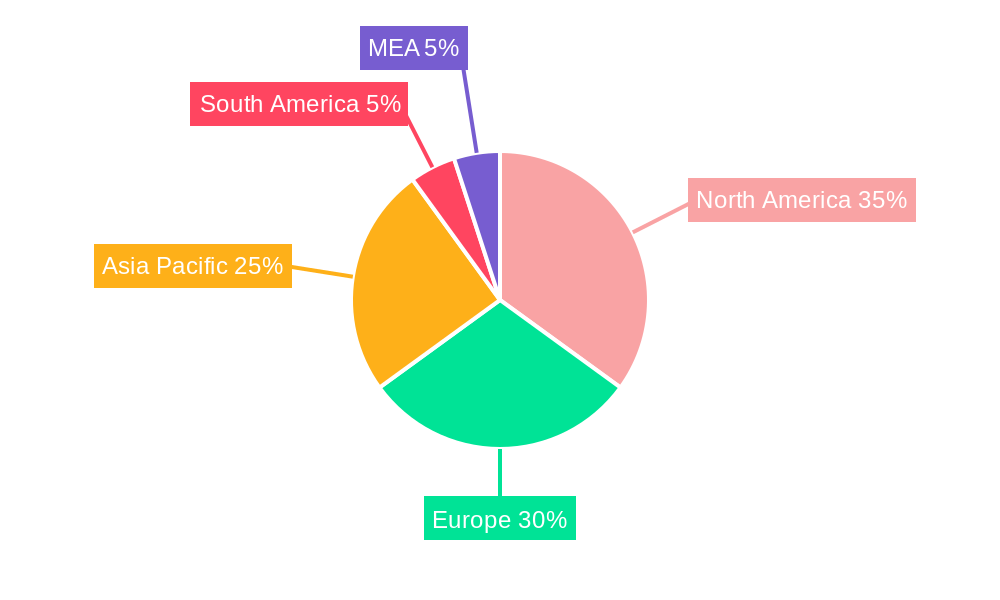
Dominant Regions, Countries, or Segments in Thin Wall Container Market
North America currently holds the largest market share in the thin wall container market, followed by Europe and Asia Pacific. Within materials, Polypropylene (PP) dominates due to its versatility, cost-effectiveness, and recyclability, holding approximately xx% market share in 2024. The Food & Beverage sector is the largest end-user segment, accounting for approximately xx% of total demand in 2024. Within product types, tubs and jars are the most dominant, with a combined market share of xx% in 2024.
- North America Dominance: Driven by high consumption in the food & beverage and pharmaceutical sectors, coupled with strong regulatory support for sustainable packaging.
- European Market: Strong presence of established players and high demand for recyclable and eco-friendly options.
- Asia Pacific Growth: Rapid industrialization and urbanization fueling increasing demand across various end-use industries.
- PP Material Dominance: Versatility, cost-effectiveness, and recyclability makes it a preferred choice for manufacturers.
- Food & Beverage Sector Leadership: High demand for lightweight and convenient packaging solutions for food products.
- Tubs and Jars: High demand driven by suitability for various products and ease of use.
Thin Wall Container Market Product Landscape
The thin wall container market showcases ongoing innovation in materials, design, and functionality. Lightweight designs minimize material usage and reduce transportation costs, while advancements in barrier properties enhance product shelf life and preservation. Unique selling propositions often focus on improved sustainability (e.g., recyclability, compostability), enhanced convenience (e.g., easy opening, resealability), and customized designs to meet specific product needs. Recent advancements include the incorporation of antimicrobial additives and the development of containers with integrated sensors for improved product tracking.
Key Drivers, Barriers & Challenges in Thin Wall Container Market
Key Drivers:
- Rising demand from food & beverage, pharmaceutical, and cosmetic industries.
- Growing preference for lightweight and convenient packaging.
- Advancements in material science leading to improved barrier properties and sustainability.
- Favorable government regulations promoting sustainable packaging solutions.
Challenges & Restraints:
- Fluctuations in raw material prices impacting profitability.
- Stringent regulatory compliance requirements leading to higher manufacturing costs.
- Intense competition among existing and new market entrants.
- Supply chain disruptions and logistics challenges. Estimated xx% increase in manufacturing costs due to supply chain issues in 2024.
Emerging Opportunities in Thin Wall Container Market
- Expanding demand in emerging economies.
- Growing interest in sustainable and eco-friendly packaging options (bioplastics, recycled content).
- Development of innovative functionalities, such as integrated sensors and tamper-evident closures.
- Customization and personalization options catering to specific brand and product requirements.
Growth Accelerators in the Thin Wall Container Market Industry
Technological breakthroughs in materials science and manufacturing processes are key growth accelerators. Strategic partnerships between packaging manufacturers and brand owners facilitate innovation and market penetration. Expansion into new markets and product segments, particularly in developing economies, offers significant growth potential. The growing focus on sustainable packaging solutions further propels market expansion.
Key Players Shaping the Thin Wall Container Market Market
- Novio Packaging B V
- Sem Plastik Sanayi Ve Ticaret A S
- Omniform SA
- Berry Global Group
- Dampack International Bv
- Takween Advanced Industries
- Insta Polypack
- Faerch Plast A/S
- Plastipak Industries INC
- JRD International
- Greiner Packaging International GmbH
- Silgan Holdings Inc
- Groupe Guillin SA
- Saudi Basic Industries Corporation
- Double H Plastics INC
Notable Milestones in Thin Wall Container Market Sector
- 2020: Introduction of a new biodegradable polypropylene by Faerch Plast A/S.
- 2021: Berry Global Group acquires a major competitor, expanding its market share.
- 2022: New EU regulations on recyclable packaging implemented.
- 2023: Several key players invest heavily in R&D for sustainable packaging solutions.
- 2024: Launch of several innovative thin-wall container designs with enhanced barrier properties.
In-Depth Thin Wall Container Market Market Outlook
The thin wall container market is poised for robust growth over the forecast period (2025-2033), driven by technological advancements, increasing demand from key end-use industries, and a growing focus on sustainable packaging solutions. Strategic partnerships, market expansions, and continued innovation in materials and manufacturing processes will shape the future landscape. Companies with a strong focus on sustainability and product innovation are expected to gain a competitive advantage. The market offers lucrative opportunities for both established players and new entrants, particularly those focusing on innovative and eco-friendly solutions.
Thin wall Container Market Segmentation
-
1. Type
- 1.1. Tubs
- 1.2. Jars
- 1.3. Pots
- 1.4. Cups
- 1.5. Trays
-
2. Materials
- 2.1. Polypropylene (PP)
- 2.2. Polyethylene Terephthalate (PET)
- 2.3. Polystyrene (PS)
- 2.4. Polyethylene (PE)
- 2.5. Polyvinyl Chloride (PVC)
-
3. End-user Industry
- 3.1. Food & Beverage
- 3.2. Cosmetics
- 3.3. Pharmaceutical
- 3.4. Other End-user Industry
Thin wall Container Market Segmentation By Geography
-
1. North America
- 1.1. United States
- 1.2. Canada
-
2. Europe
- 2.1. Germany
- 2.2. United Kingdom
- 2.3. France
- 2.4. Italy
- 2.5. Spain
- 2.6. Rest of Europe
-
3. Asia Pacific
- 3.1. China
- 3.2. Japan
- 3.3. Australia
- 3.4. India
- 3.5. Rest of Asia Pacific
-
4. Latin America
- 4.1. Brazil
- 4.2. Argentina
- 4.3. Rest of Latin America
- 5. Middle East
-
6. United Arab Emirates
- 6.1. Saudi Arabia
- 6.2. South Africa
- 6.3. Rest of Middle East
Thin wall Container Market Regional Market Share
Geographic Coverage of Thin wall Container Market
Thin wall Container Market REPORT HIGHLIGHTS
| Aspects | Details |
|---|---|
| Study Period | 2020-2034 |
| Base Year | 2025 |
| Estimated Year | 2026 |
| Forecast Period | 2026-2034 |
| Historical Period | 2020-2025 |
| Growth Rate | CAGR of 6.27% from 2020-2034 |
| Segmentation |
|
Table of Contents
- 1. Introduction
- 1.1. Research Scope
- 1.2. Market Segmentation
- 1.3. Research Objective
- 1.4. Definitions and Assumptions
- 2. Executive Summary
- 2.1. Market Snapshot
- 3. Market Dynamics
- 3.1. Market Drivers
- 3.2. Market Restrains
- 3.3. Market Trends
- 3.4. Market Opportunities
- 4. Market Factor Analysis
- 4.1. Porters Five Forces
- 4.1.1. Bargaining Power of Suppliers
- 4.1.2. Bargaining Power of Buyers
- 4.1.3. Threat of New Entrants
- 4.1.4. Threat of Substitutes
- 4.1.5. Competitive Rivalry
- 4.2. PESTEL analysis
- 4.3. BCG Analysis
- 4.3.1. Stars (High Growth, High Market Share)
- 4.3.2. Cash Cows (Low Growth, High Market Share)
- 4.3.3. Question Mark (High Growth, Low Market Share)
- 4.3.4. Dogs (Low Growth, Low Market Share)
- 4.4. Ansoff Matrix Analysis
- 4.5. Supply Chain Analysis
- 4.6. Regulatory Landscape
- 4.7. Current Market Potential and Opportunity Assessment (TAM–SAM–SOM Framework)
- 4.8. VDR Analyst Note
- 4.1. Porters Five Forces
- 5. Market Analysis, Insights and Forecast 2021-2033
- 5.1. Market Analysis, Insights and Forecast - by Type
- 5.1.1. Tubs
- 5.1.2. Jars
- 5.1.3. Pots
- 5.1.4. Cups
- 5.1.5. Trays
- 5.2. Market Analysis, Insights and Forecast - by Materials
- 5.2.1. Polypropylene (PP)
- 5.2.2. Polyethylene Terephthalate (PET)
- 5.2.3. Polystyrene (PS)
- 5.2.4. Polyethylene (PE)
- 5.2.5. Polyvinyl Chloride (PVC)
- 5.3. Market Analysis, Insights and Forecast - by End-user Industry
- 5.3.1. Food & Beverage
- 5.3.2. Cosmetics
- 5.3.3. Pharmaceutical
- 5.3.4. Other End-user Industry
- 5.4. Market Analysis, Insights and Forecast - by Region
- 5.4.1. North America
- 5.4.2. Europe
- 5.4.3. Asia Pacific
- 5.4.4. Latin America
- 5.4.5. Middle East
- 5.4.6. United Arab Emirates
- 5.1. Market Analysis, Insights and Forecast - by Type
- 6. Global Thin wall Container Market Analysis, Insights and Forecast, 2021-2033
- 6.1. Market Analysis, Insights and Forecast - by Type
- 6.1.1. Tubs
- 6.1.2. Jars
- 6.1.3. Pots
- 6.1.4. Cups
- 6.1.5. Trays
- 6.2. Market Analysis, Insights and Forecast - by Materials
- 6.2.1. Polypropylene (PP)
- 6.2.2. Polyethylene Terephthalate (PET)
- 6.2.3. Polystyrene (PS)
- 6.2.4. Polyethylene (PE)
- 6.2.5. Polyvinyl Chloride (PVC)
- 6.3. Market Analysis, Insights and Forecast - by End-user Industry
- 6.3.1. Food & Beverage
- 6.3.2. Cosmetics
- 6.3.3. Pharmaceutical
- 6.3.4. Other End-user Industry
- 6.1. Market Analysis, Insights and Forecast - by Type
- 7. North America Thin wall Container Market Analysis, Insights and Forecast, 2021-2033
- 7.1. Market Analysis, Insights and Forecast - by Type
- 7.1.1. Tubs
- 7.1.2. Jars
- 7.1.3. Pots
- 7.1.4. Cups
- 7.1.5. Trays
- 7.2. Market Analysis, Insights and Forecast - by Materials
- 7.2.1. Polypropylene (PP)
- 7.2.2. Polyethylene Terephthalate (PET)
- 7.2.3. Polystyrene (PS)
- 7.2.4. Polyethylene (PE)
- 7.2.5. Polyvinyl Chloride (PVC)
- 7.3. Market Analysis, Insights and Forecast - by End-user Industry
- 7.3.1. Food & Beverage
- 7.3.2. Cosmetics
- 7.3.3. Pharmaceutical
- 7.3.4. Other End-user Industry
- 7.1. Market Analysis, Insights and Forecast - by Type
- 8. Europe Thin wall Container Market Analysis, Insights and Forecast, 2021-2033
- 8.1. Market Analysis, Insights and Forecast - by Type
- 8.1.1. Tubs
- 8.1.2. Jars
- 8.1.3. Pots
- 8.1.4. Cups
- 8.1.5. Trays
- 8.2. Market Analysis, Insights and Forecast - by Materials
- 8.2.1. Polypropylene (PP)
- 8.2.2. Polyethylene Terephthalate (PET)
- 8.2.3. Polystyrene (PS)
- 8.2.4. Polyethylene (PE)
- 8.2.5. Polyvinyl Chloride (PVC)
- 8.3. Market Analysis, Insights and Forecast - by End-user Industry
- 8.3.1. Food & Beverage
- 8.3.2. Cosmetics
- 8.3.3. Pharmaceutical
- 8.3.4. Other End-user Industry
- 8.1. Market Analysis, Insights and Forecast - by Type
- 9. Asia Pacific Thin wall Container Market Analysis, Insights and Forecast, 2021-2033
- 9.1. Market Analysis, Insights and Forecast - by Type
- 9.1.1. Tubs
- 9.1.2. Jars
- 9.1.3. Pots
- 9.1.4. Cups
- 9.1.5. Trays
- 9.2. Market Analysis, Insights and Forecast - by Materials
- 9.2.1. Polypropylene (PP)
- 9.2.2. Polyethylene Terephthalate (PET)
- 9.2.3. Polystyrene (PS)
- 9.2.4. Polyethylene (PE)
- 9.2.5. Polyvinyl Chloride (PVC)
- 9.3. Market Analysis, Insights and Forecast - by End-user Industry
- 9.3.1. Food & Beverage
- 9.3.2. Cosmetics
- 9.3.3. Pharmaceutical
- 9.3.4. Other End-user Industry
- 9.1. Market Analysis, Insights and Forecast - by Type
- 10. Latin America Thin wall Container Market Analysis, Insights and Forecast, 2021-2033
- 10.1. Market Analysis, Insights and Forecast - by Type
- 10.1.1. Tubs
- 10.1.2. Jars
- 10.1.3. Pots
- 10.1.4. Cups
- 10.1.5. Trays
- 10.2. Market Analysis, Insights and Forecast - by Materials
- 10.2.1. Polypropylene (PP)
- 10.2.2. Polyethylene Terephthalate (PET)
- 10.2.3. Polystyrene (PS)
- 10.2.4. Polyethylene (PE)
- 10.2.5. Polyvinyl Chloride (PVC)
- 10.3. Market Analysis, Insights and Forecast - by End-user Industry
- 10.3.1. Food & Beverage
- 10.3.2. Cosmetics
- 10.3.3. Pharmaceutical
- 10.3.4. Other End-user Industry
- 10.1. Market Analysis, Insights and Forecast - by Type
- 11. Middle East Thin wall Container Market Analysis, Insights and Forecast, 2021-2033
- 11.1. Market Analysis, Insights and Forecast - by Type
- 11.1.1. Tubs
- 11.1.2. Jars
- 11.1.3. Pots
- 11.1.4. Cups
- 11.1.5. Trays
- 11.2. Market Analysis, Insights and Forecast - by Materials
- 11.2.1. Polypropylene (PP)
- 11.2.2. Polyethylene Terephthalate (PET)
- 11.2.3. Polystyrene (PS)
- 11.2.4. Polyethylene (PE)
- 11.2.5. Polyvinyl Chloride (PVC)
- 11.3. Market Analysis, Insights and Forecast - by End-user Industry
- 11.3.1. Food & Beverage
- 11.3.2. Cosmetics
- 11.3.3. Pharmaceutical
- 11.3.4. Other End-user Industry
- 11.1. Market Analysis, Insights and Forecast - by Type
- 12. United Arab Emirates Thin wall Container Market Analysis, Insights and Forecast, 2021-2033
- 12.1. Market Analysis, Insights and Forecast - by Type
- 12.1.1. Tubs
- 12.1.2. Jars
- 12.1.3. Pots
- 12.1.4. Cups
- 12.1.5. Trays
- 12.2. Market Analysis, Insights and Forecast - by Materials
- 12.2.1. Polypropylene (PP)
- 12.2.2. Polyethylene Terephthalate (PET)
- 12.2.3. Polystyrene (PS)
- 12.2.4. Polyethylene (PE)
- 12.2.5. Polyvinyl Chloride (PVC)
- 12.3. Market Analysis, Insights and Forecast - by End-user Industry
- 12.3.1. Food & Beverage
- 12.3.2. Cosmetics
- 12.3.3. Pharmaceutical
- 12.3.4. Other End-user Industry
- 12.1. Market Analysis, Insights and Forecast - by Type
- 13. Competitive Analysis
- 13.1. Company Profiles
- 13.1.1 Novio Packaging B V
- 13.1.1.1. Company Overview
- 13.1.1.2. Products
- 13.1.1.3. Company Financials
- 13.1.1.4. SWOT Analysis
- 13.1.2 Sem Plastik Sanayi Ve Ticaret A S
- 13.1.2.1. Company Overview
- 13.1.2.2. Products
- 13.1.2.3. Company Financials
- 13.1.2.4. SWOT Analysis
- 13.1.3 Omniform SA
- 13.1.3.1. Company Overview
- 13.1.3.2. Products
- 13.1.3.3. Company Financials
- 13.1.3.4. SWOT Analysis
- 13.1.4 Berry Global Group
- 13.1.4.1. Company Overview
- 13.1.4.2. Products
- 13.1.4.3. Company Financials
- 13.1.4.4. SWOT Analysis
- 13.1.5 Dampack International Bv
- 13.1.5.1. Company Overview
- 13.1.5.2. Products
- 13.1.5.3. Company Financials
- 13.1.5.4. SWOT Analysis
- 13.1.6 Takween Advanced Industries
- 13.1.6.1. Company Overview
- 13.1.6.2. Products
- 13.1.6.3. Company Financials
- 13.1.6.4. SWOT Analysis
- 13.1.7 Insta Polypack
- 13.1.7.1. Company Overview
- 13.1.7.2. Products
- 13.1.7.3. Company Financials
- 13.1.7.4. SWOT Analysis
- 13.1.8 Faerch Plast A/S
- 13.1.8.1. Company Overview
- 13.1.8.2. Products
- 13.1.8.3. Company Financials
- 13.1.8.4. SWOT Analysis
- 13.1.9 Plastipak Industries INC *List Not Exhaustive
- 13.1.9.1. Company Overview
- 13.1.9.2. Products
- 13.1.9.3. Company Financials
- 13.1.9.4. SWOT Analysis
- 13.1.10 JRD International
- 13.1.10.1. Company Overview
- 13.1.10.2. Products
- 13.1.10.3. Company Financials
- 13.1.10.4. SWOT Analysis
- 13.1.11 Greiner Packaging International GmbH
- 13.1.11.1. Company Overview
- 13.1.11.2. Products
- 13.1.11.3. Company Financials
- 13.1.11.4. SWOT Analysis
- 13.1.12 Silgan Holdings Inc
- 13.1.12.1. Company Overview
- 13.1.12.2. Products
- 13.1.12.3. Company Financials
- 13.1.12.4. SWOT Analysis
- 13.1.13 Groupe Guillin SA
- 13.1.13.1. Company Overview
- 13.1.13.2. Products
- 13.1.13.3. Company Financials
- 13.1.13.4. SWOT Analysis
- 13.1.14 Saudi Basic Industries Corporation
- 13.1.14.1. Company Overview
- 13.1.14.2. Products
- 13.1.14.3. Company Financials
- 13.1.14.4. SWOT Analysis
- 13.1.15 Double H Plastics INC
- 13.1.15.1. Company Overview
- 13.1.15.2. Products
- 13.1.15.3. Company Financials
- 13.1.15.4. SWOT Analysis
- 13.1.1 Novio Packaging B V
- 13.2. Market Entropy
- 13.2.1 Company's Key Areas Served
- 13.2.2 Recent Developments
- 13.3. Company Market Share Analysis 2025
- 13.3.1 Top 5 Companies Market Share Analysis
- 13.3.2 Top 3 Companies Market Share Analysis
- 13.4. List of Potential Customers
- 14. Research Methodology
List of Figures
- Figure 1: Global Thin wall Container Market Revenue Breakdown (billion, %) by Region 2025 & 2033
- Figure 2: North America Thin wall Container Market Revenue (billion), by Type 2025 & 2033
- Figure 3: North America Thin wall Container Market Revenue Share (%), by Type 2025 & 2033
- Figure 4: North America Thin wall Container Market Revenue (billion), by Materials 2025 & 2033
- Figure 5: North America Thin wall Container Market Revenue Share (%), by Materials 2025 & 2033
- Figure 6: North America Thin wall Container Market Revenue (billion), by End-user Industry 2025 & 2033
- Figure 7: North America Thin wall Container Market Revenue Share (%), by End-user Industry 2025 & 2033
- Figure 8: North America Thin wall Container Market Revenue (billion), by Country 2025 & 2033
- Figure 9: North America Thin wall Container Market Revenue Share (%), by Country 2025 & 2033
- Figure 10: Europe Thin wall Container Market Revenue (billion), by Type 2025 & 2033
- Figure 11: Europe Thin wall Container Market Revenue Share (%), by Type 2025 & 2033
- Figure 12: Europe Thin wall Container Market Revenue (billion), by Materials 2025 & 2033
- Figure 13: Europe Thin wall Container Market Revenue Share (%), by Materials 2025 & 2033
- Figure 14: Europe Thin wall Container Market Revenue (billion), by End-user Industry 2025 & 2033
- Figure 15: Europe Thin wall Container Market Revenue Share (%), by End-user Industry 2025 & 2033
- Figure 16: Europe Thin wall Container Market Revenue (billion), by Country 2025 & 2033
- Figure 17: Europe Thin wall Container Market Revenue Share (%), by Country 2025 & 2033
- Figure 18: Asia Pacific Thin wall Container Market Revenue (billion), by Type 2025 & 2033
- Figure 19: Asia Pacific Thin wall Container Market Revenue Share (%), by Type 2025 & 2033
- Figure 20: Asia Pacific Thin wall Container Market Revenue (billion), by Materials 2025 & 2033
- Figure 21: Asia Pacific Thin wall Container Market Revenue Share (%), by Materials 2025 & 2033
- Figure 22: Asia Pacific Thin wall Container Market Revenue (billion), by End-user Industry 2025 & 2033
- Figure 23: Asia Pacific Thin wall Container Market Revenue Share (%), by End-user Industry 2025 & 2033
- Figure 24: Asia Pacific Thin wall Container Market Revenue (billion), by Country 2025 & 2033
- Figure 25: Asia Pacific Thin wall Container Market Revenue Share (%), by Country 2025 & 2033
- Figure 26: Latin America Thin wall Container Market Revenue (billion), by Type 2025 & 2033
- Figure 27: Latin America Thin wall Container Market Revenue Share (%), by Type 2025 & 2033
- Figure 28: Latin America Thin wall Container Market Revenue (billion), by Materials 2025 & 2033
- Figure 29: Latin America Thin wall Container Market Revenue Share (%), by Materials 2025 & 2033
- Figure 30: Latin America Thin wall Container Market Revenue (billion), by End-user Industry 2025 & 2033
- Figure 31: Latin America Thin wall Container Market Revenue Share (%), by End-user Industry 2025 & 2033
- Figure 32: Latin America Thin wall Container Market Revenue (billion), by Country 2025 & 2033
- Figure 33: Latin America Thin wall Container Market Revenue Share (%), by Country 2025 & 2033
- Figure 34: Middle East Thin wall Container Market Revenue (billion), by Type 2025 & 2033
- Figure 35: Middle East Thin wall Container Market Revenue Share (%), by Type 2025 & 2033
- Figure 36: Middle East Thin wall Container Market Revenue (billion), by Materials 2025 & 2033
- Figure 37: Middle East Thin wall Container Market Revenue Share (%), by Materials 2025 & 2033
- Figure 38: Middle East Thin wall Container Market Revenue (billion), by End-user Industry 2025 & 2033
- Figure 39: Middle East Thin wall Container Market Revenue Share (%), by End-user Industry 2025 & 2033
- Figure 40: Middle East Thin wall Container Market Revenue (billion), by Country 2025 & 2033
- Figure 41: Middle East Thin wall Container Market Revenue Share (%), by Country 2025 & 2033
- Figure 42: United Arab Emirates Thin wall Container Market Revenue (billion), by Type 2025 & 2033
- Figure 43: United Arab Emirates Thin wall Container Market Revenue Share (%), by Type 2025 & 2033
- Figure 44: United Arab Emirates Thin wall Container Market Revenue (billion), by Materials 2025 & 2033
- Figure 45: United Arab Emirates Thin wall Container Market Revenue Share (%), by Materials 2025 & 2033
- Figure 46: United Arab Emirates Thin wall Container Market Revenue (billion), by End-user Industry 2025 & 2033
- Figure 47: United Arab Emirates Thin wall Container Market Revenue Share (%), by End-user Industry 2025 & 2033
- Figure 48: United Arab Emirates Thin wall Container Market Revenue (billion), by Country 2025 & 2033
- Figure 49: United Arab Emirates Thin wall Container Market Revenue Share (%), by Country 2025 & 2033
List of Tables
- Table 1: Global Thin wall Container Market Revenue billion Forecast, by Type 2020 & 2033
- Table 2: Global Thin wall Container Market Revenue billion Forecast, by Materials 2020 & 2033
- Table 3: Global Thin wall Container Market Revenue billion Forecast, by End-user Industry 2020 & 2033
- Table 4: Global Thin wall Container Market Revenue billion Forecast, by Region 2020 & 2033
- Table 5: Global Thin wall Container Market Revenue billion Forecast, by Type 2020 & 2033
- Table 6: Global Thin wall Container Market Revenue billion Forecast, by Materials 2020 & 2033
- Table 7: Global Thin wall Container Market Revenue billion Forecast, by End-user Industry 2020 & 2033
- Table 8: Global Thin wall Container Market Revenue billion Forecast, by Country 2020 & 2033
- Table 9: United States Thin wall Container Market Revenue (billion) Forecast, by Application 2020 & 2033
- Table 10: Canada Thin wall Container Market Revenue (billion) Forecast, by Application 2020 & 2033
- Table 11: Global Thin wall Container Market Revenue billion Forecast, by Type 2020 & 2033
- Table 12: Global Thin wall Container Market Revenue billion Forecast, by Materials 2020 & 2033
- Table 13: Global Thin wall Container Market Revenue billion Forecast, by End-user Industry 2020 & 2033
- Table 14: Global Thin wall Container Market Revenue billion Forecast, by Country 2020 & 2033
- Table 15: Germany Thin wall Container Market Revenue (billion) Forecast, by Application 2020 & 2033
- Table 16: United Kingdom Thin wall Container Market Revenue (billion) Forecast, by Application 2020 & 2033
- Table 17: France Thin wall Container Market Revenue (billion) Forecast, by Application 2020 & 2033
- Table 18: Italy Thin wall Container Market Revenue (billion) Forecast, by Application 2020 & 2033
- Table 19: Spain Thin wall Container Market Revenue (billion) Forecast, by Application 2020 & 2033
- Table 20: Rest of Europe Thin wall Container Market Revenue (billion) Forecast, by Application 2020 & 2033
- Table 21: Global Thin wall Container Market Revenue billion Forecast, by Type 2020 & 2033
- Table 22: Global Thin wall Container Market Revenue billion Forecast, by Materials 2020 & 2033
- Table 23: Global Thin wall Container Market Revenue billion Forecast, by End-user Industry 2020 & 2033
- Table 24: Global Thin wall Container Market Revenue billion Forecast, by Country 2020 & 2033
- Table 25: China Thin wall Container Market Revenue (billion) Forecast, by Application 2020 & 2033
- Table 26: Japan Thin wall Container Market Revenue (billion) Forecast, by Application 2020 & 2033
- Table 27: Australia Thin wall Container Market Revenue (billion) Forecast, by Application 2020 & 2033
- Table 28: India Thin wall Container Market Revenue (billion) Forecast, by Application 2020 & 2033
- Table 29: Rest of Asia Pacific Thin wall Container Market Revenue (billion) Forecast, by Application 2020 & 2033
- Table 30: Global Thin wall Container Market Revenue billion Forecast, by Type 2020 & 2033
- Table 31: Global Thin wall Container Market Revenue billion Forecast, by Materials 2020 & 2033
- Table 32: Global Thin wall Container Market Revenue billion Forecast, by End-user Industry 2020 & 2033
- Table 33: Global Thin wall Container Market Revenue billion Forecast, by Country 2020 & 2033
- Table 34: Brazil Thin wall Container Market Revenue (billion) Forecast, by Application 2020 & 2033
- Table 35: Argentina Thin wall Container Market Revenue (billion) Forecast, by Application 2020 & 2033
- Table 36: Rest of Latin America Thin wall Container Market Revenue (billion) Forecast, by Application 2020 & 2033
- Table 37: Global Thin wall Container Market Revenue billion Forecast, by Type 2020 & 2033
- Table 38: Global Thin wall Container Market Revenue billion Forecast, by Materials 2020 & 2033
- Table 39: Global Thin wall Container Market Revenue billion Forecast, by End-user Industry 2020 & 2033
- Table 40: Global Thin wall Container Market Revenue billion Forecast, by Country 2020 & 2033
- Table 41: Global Thin wall Container Market Revenue billion Forecast, by Type 2020 & 2033
- Table 42: Global Thin wall Container Market Revenue billion Forecast, by Materials 2020 & 2033
- Table 43: Global Thin wall Container Market Revenue billion Forecast, by End-user Industry 2020 & 2033
- Table 44: Global Thin wall Container Market Revenue billion Forecast, by Country 2020 & 2033
- Table 45: Saudi Arabia Thin wall Container Market Revenue (billion) Forecast, by Application 2020 & 2033
- Table 46: South Africa Thin wall Container Market Revenue (billion) Forecast, by Application 2020 & 2033
- Table 47: Rest of Middle East Thin wall Container Market Revenue (billion) Forecast, by Application 2020 & 2033
Frequently Asked Questions
1. What is the projected Compound Annual Growth Rate (CAGR) of the Thin wall Container Market?
The projected CAGR is approximately 6.27%.
2. Which companies are prominent players in the Thin wall Container Market?
Key companies in the market include Novio Packaging B V, Sem Plastik Sanayi Ve Ticaret A S, Omniform SA, Berry Global Group, Dampack International Bv, Takween Advanced Industries, Insta Polypack, Faerch Plast A/S, Plastipak Industries INC *List Not Exhaustive, JRD International, Greiner Packaging International GmbH, Silgan Holdings Inc, Groupe Guillin SA, Saudi Basic Industries Corporation, Double H Plastics INC.
3. What are the main segments of the Thin wall Container Market?
The market segments include Type, Materials, End-user Industry.
4. Can you provide details about the market size?
The market size is estimated to be USD 43.94 billion as of 2022.
5. What are some drivers contributing to market growth?
; Rise of E-Commerce; Increasing Need for Light Weight Packaging; Increase in the Urban Population.
6. What are the notable trends driving market growth?
Food & Beverages Industry is Expected to hold the Major Share.
7. Are there any restraints impacting market growth?
; Stringent Regulations.
8. Can you provide examples of recent developments in the market?
N/A
9. What pricing options are available for accessing the report?
Pricing options include single-user, multi-user, and enterprise licenses priced at USD 4750, USD 5250, and USD 8750 respectively.
10. Is the market size provided in terms of value or volume?
The market size is provided in terms of value, measured in billion.
11. Are there any specific market keywords associated with the report?
Yes, the market keyword associated with the report is "Thin wall Container Market," which aids in identifying and referencing the specific market segment covered.
12. How do I determine which pricing option suits my needs best?
The pricing options vary based on user requirements and access needs. Individual users may opt for single-user licenses, while businesses requiring broader access may choose multi-user or enterprise licenses for cost-effective access to the report.
13. Are there any additional resources or data provided in the Thin wall Container Market report?
While the report offers comprehensive insights, it's advisable to review the specific contents or supplementary materials provided to ascertain if additional resources or data are available.
14. How can I stay updated on further developments or reports in the Thin wall Container Market?
To stay informed about further developments, trends, and reports in the Thin wall Container Market, consider subscribing to industry newsletters, following relevant companies and organizations, or regularly checking reputable industry news sources and publications.
Methodology
Step 1 - Identification of Relevant Samples Size from Population Database


Step 2 - Approaches for Defining Global Market Size (Value, Volume* & Price*)

Note*: In applicable scenarios
Step 3 - Data Sources
Primary Research
- Web Analytics
- Survey Reports
- Research Institute
- Latest Research Reports
- Opinion Leaders
Secondary Research
- Annual Reports
- White Paper
- Latest Press Release
- Industry Association
- Paid Database
- Investor Presentations

Step 4 - Data Triangulation
Involves using different sources of information in order to increase the validity of a study
These sources are likely to be stakeholders in a program - participants, other researchers, program staff, other community members, and so on.
Then we put all data in single framework & apply various statistical tools to find out the dynamic on the market.
During the analysis stage, feedback from the stakeholder groups would be compared to determine areas of agreement as well as areas of divergence