

Key Insights
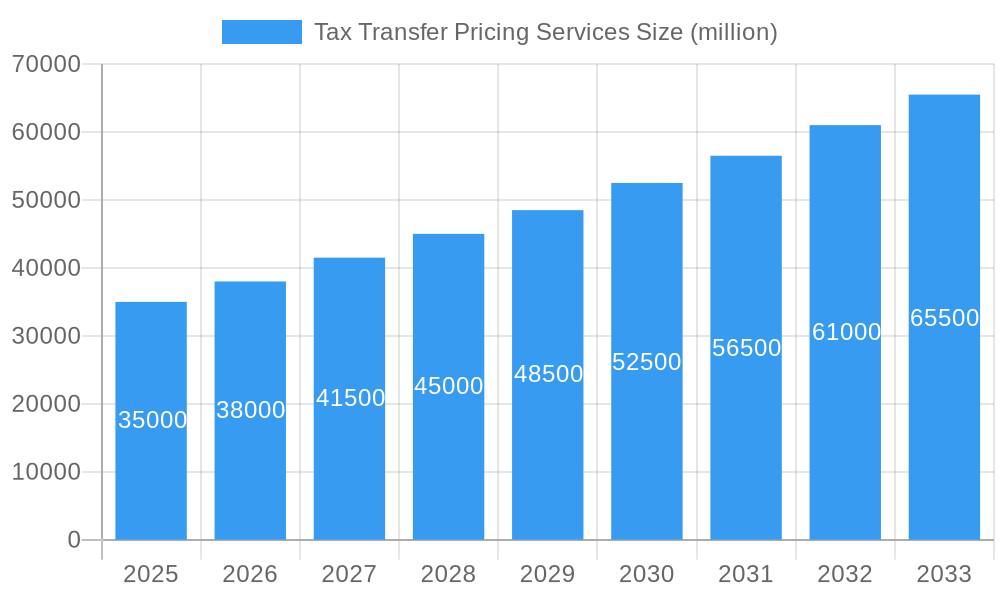
The global Tax Transfer Pricing Services market is poised for substantial growth, estimated at a robust market size of approximately $35 billion in 2025, projected to expand at a Compound Annual Growth Rate (CAGR) of around 8.5% through 2033. This significant expansion is propelled by an increasingly complex and interconnected global economy, necessitating stringent adherence to international tax regulations and fair profit allocation across multinational enterprises (MNEs). Key drivers include the escalating volume of cross-border transactions, the growing emphasis on regulatory compliance and BEPS (Base Erosion and Profit Shifting) initiatives by tax authorities worldwide, and the increasing demand for specialized advisory services to navigate intricate transfer pricing documentation and dispute resolution. The financial industry and consumer & retail sectors are anticipated to be the leading application segments, leveraging these services to ensure tax efficiency and mitigate risks.
Tax Transfer Pricing Services Market Size (In Billion)
Further fueling this market's trajectory are critical trends such as the digital transformation of tax functions, leading to the adoption of advanced analytics and AI for transfer pricing analysis and compliance. The growing sophistication of tax authorities in identifying and challenging non-compliant transfer pricing strategies also acts as a significant impetus for MNEs to invest in expert services. While the market is ripe with opportunities, certain restraints, such as the high cost of compliance and the shortage of skilled professionals in niche transfer pricing areas, may temper growth. However, the overarching need for robust transfer pricing strategies to maintain tax integrity and avoid significant penalties ensures continued demand, with segments like Documentation & BEPS/CbCR Compliance and Implementation & Compliance Management expected to witness the highest traction.
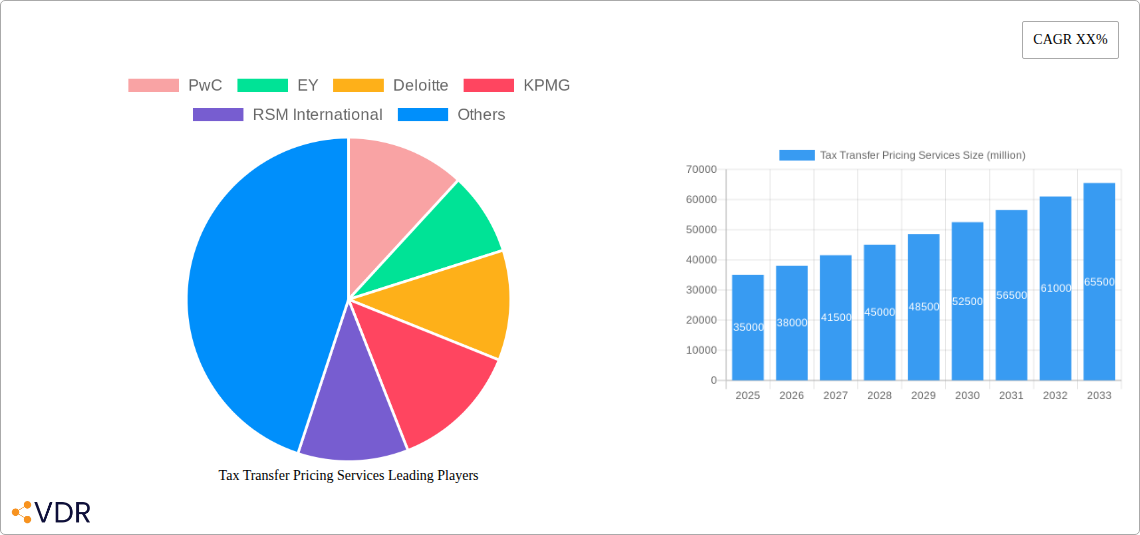
Tax Transfer Pricing Services Company Market Share
Unlocking Global Tax Efficiency: Comprehensive Tax Transfer Pricing Services Market Report (2019–2033)
This in-depth Tax Transfer Pricing Services Market Report provides a critical analysis of the global landscape, focusing on parent and child market dynamics. It equips industry professionals with actionable insights into market structure, growth trends, regional dominance, and competitive strategies, crucial for navigating the complex world of international tax compliance. The report covers the Study Period (2019–2033), with Base Year (2025) and Forecast Period (2025–2033), offering historical context from 2019–2024. All monetary values are presented in million units.
Tax Transfer Pricing Services Market Dynamics & Structure
The global Tax Transfer Pricing Services market exhibits a moderately concentrated structure, with a few major players like PwC, EY, Deloitte, and KPMG holding significant market share, estimated to be over 60% combined. Technological innovation, particularly in data analytics and artificial intelligence, is a key driver, enabling more sophisticated risk assessment and compliance automation. Regulatory frameworks, driven by initiatives like the OECD's Base Erosion and Profit Shifting (BEPS) Action Plan and Country-by-Country Reporting (CbCR), are the primary shapers of market demand. Competitive product substitutes, such as in-house tax departments or basic accounting software, exist but often lack the specialized expertise and global reach of dedicated transfer pricing firms. End-user demographics are primarily large multinational corporations (MNCs) across various industries, with a growing segment of mid-sized enterprises seeking to optimize their tax positions. Mergers and acquisitions (M&A) activity, though moderate, is prevalent as larger firms acquire specialized practices to expand their service offerings. For instance, the total M&A deal volume in the last five years is estimated at over 300 million units, indicating consolidation and strategic expansion.
- Market Concentration: Dominated by Big Four firms, with emerging specialization from mid-tier players.
- Technological Drivers: AI-powered analytics for risk identification, automated documentation tools.
- Regulatory Frameworks: BEPS, CbCR, and evolving local tax laws are key market catalysts.
- Competitive Landscape: In-house solutions and generic accounting software are indirect competitors.
- End-User Profile: Primarily MNCs across all sectors; growing demand from mid-market companies.
- M&A Activity: Strategic acquisitions by larger firms to enhance service portfolios.
Tax Transfer Pricing Services Growth Trends & Insights
The Tax Transfer Pricing Services market is experiencing robust growth, projected to expand from an estimated $15,000 million in 2024 to over $25,000 million by 2033, exhibiting a Compound Annual Growth Rate (CAGR) of approximately 6.5%. This expansion is fueled by increasing global trade, the complexity of cross-border transactions, and heightened scrutiny from tax authorities worldwide. Adoption rates for specialized transfer pricing services are high among multinational enterprises, with market penetration reaching over 75% for large corporations. Technological disruptions, such as the integration of machine learning for predictive risk modeling and blockchain for enhanced audit trail transparency, are significantly influencing service delivery and client expectations. Consumer behavior shifts are evident in the increasing demand for proactive tax planning and value chain optimization services, moving beyond basic compliance. The evolving regulatory landscape, with continuous updates to BEPS measures and the introduction of digital services taxes, compels companies to seek expert guidance, thereby driving demand. Furthermore, the increasing globalization of supply chains necessitates meticulous transfer pricing strategies to ensure compliance and mitigate tax risks, further accelerating market growth. The overall market penetration is expected to climb to over 85% for target companies by the end of the forecast period.
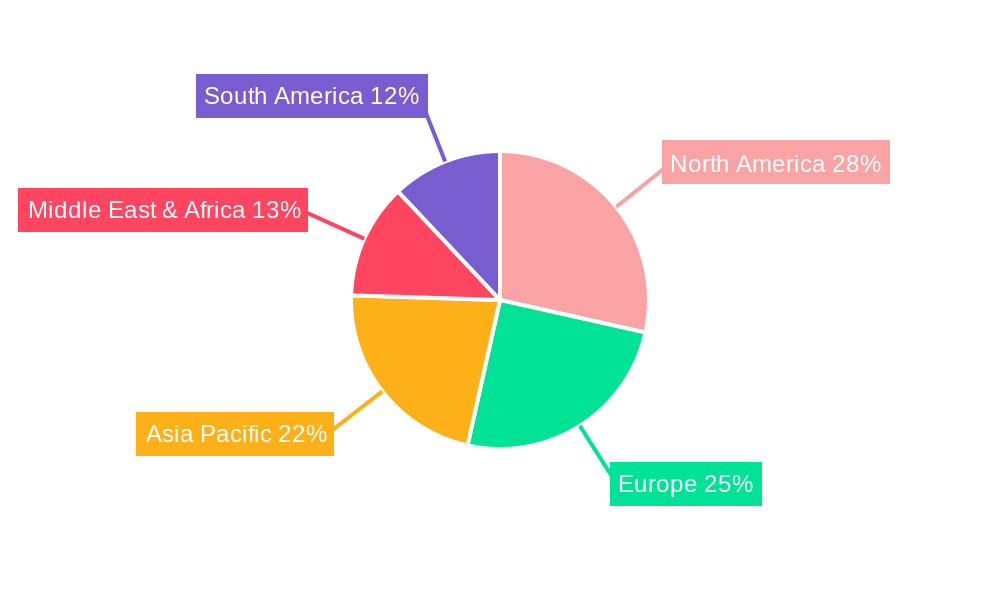
Dominant Regions, Countries, or Segments in Tax Transfer Pricing Services
The Financial Industry segment consistently drives significant growth within the Tax Transfer Pricing Services market, accounting for an estimated 25% of the total market value in the base year of 2025, projected to reach over 30% by 2033. This dominance stems from the complex nature of financial transactions, including intercompany loans, intellectual property licensing for financial products, and service fees, all of which are subject to stringent transfer pricing regulations. North America, particularly the United States, remains a dominant region, contributing over 30% of the global market revenue due to its extensive network of multinational corporations and a mature regulatory environment that necessitates robust transfer pricing strategies.
Leading Segment - Financial Industry:
- High volume of intercompany financial transactions.
- Complex product and service structures requiring precise pricing.
- Significant regulatory focus on financial institutions' tax practices.
- Projected market share growth from 25% to over 30% by 2033.
Dominant Region - North America (United States):
- Concentration of global MNC headquarters.
- Established and evolving transfer pricing legal frameworks.
- Proactive tax authority enforcement driving demand for services.
- Estimated market contribution of over 30% of global revenue.
Key Drivers within the Financial Industry:
- Intricate intra-group financing arrangements.
- Licensing of proprietary financial technologies and models.
- Management and administrative service charges between group entities.
- Demand for Documentation & BEPS / CbCR Compliance services is paramount, estimated to be over 35% of the segment's service needs.
- Growing need for Controversy & Dispute Resolution as tax authorities increase scrutiny.
Growth Potential in Other Segments: While the Financial Industry leads, the Consumer & Retail segment is showing accelerated growth due to complex supply chains and brand licensing, projected to grow at a CAGR of 7% during the forecast period. The Industrial Manufacturing sector also presents substantial opportunities driven by globalized production and R&D.
Tax Transfer Pricing Services Product Landscape
Tax Transfer Pricing Services are characterized by a suite of offerings designed to ensure compliance and optimize tax liabilities for multinational enterprises. These include advanced Advisory & Value Chain Optimisation services leveraging cutting-edge analytics to refine intercompany transactions and enhance profitability. Documentation & BEPS / CbCR Compliance solutions are paramount, offering automated tools for generating Master File, Local File, and CbCR reports that adhere to the latest global standards. Implementation & Compliance Management ensures seamless integration of transfer pricing policies into daily business operations, supported by robust technology platforms. Furthermore, specialized Controversy & Dispute Resolution services are critical for navigating tax audits and litigation, backed by experienced tax professionals. The unique selling proposition lies in the blend of deep technical expertise, global reach, and advanced technology, enabling clients to achieve tax efficiency and mitigate risks effectively.
Key Drivers, Barriers & Challenges in Tax Transfer Pricing Services
The Tax Transfer Pricing Services market is propelled by several key drivers. Increasingly stringent and complex international tax regulations, such as the OECD's BEPS initiatives, necessitate expert guidance. The globalization of businesses and supply chains amplifies the need for sophisticated transfer pricing strategies to avoid double taxation and optimize tax liabilities. Technological advancements in data analytics and AI offer new efficiencies in compliance and risk assessment.
- Key Drivers:
- Evolving global tax regulations (BEPS 2.0, digital taxation).
- Increased cross-border trade and complex supply chains.
- Heightened scrutiny from tax authorities worldwide.
- Demand for tax efficiency and risk mitigation.
- Technological innovation in compliance tools.
Conversely, the market faces significant barriers and challenges. A shortage of highly specialized transfer pricing professionals creates a talent gap, potentially impacting service delivery quality. The cost of compliance can be substantial, particularly for smaller and medium-sized enterprises. Navigating diverse and often conflicting local tax laws across different jurisdictions presents a considerable hurdle. The constant evolution of regulations also requires continuous adaptation and investment, posing a challenge for both service providers and their clients.
- Key Barriers & Challenges:
- Talent shortage in specialized transfer pricing expertise.
- High cost of compliance for SMEs.
- Complexity of diverse and conflicting international tax laws.
- Rapidly changing regulatory landscape demanding constant adaptation.
- Potential for aggressive tax authority audits and disputes.
Emerging Opportunities in Tax Transfer Pricing Services
Emerging opportunities in the Tax Transfer Pricing Services sector are abundant, particularly in the realm of digital transformation and sustainability. The increasing focus on Environmental, Social, and Governance (ESG) factors presents a new avenue for transfer pricing, where companies are exploring how to price intangibles related to green technologies or sustainable supply chains. The ongoing implementation of BEPS 2.0, particularly Pillar Two (global minimum tax), creates a significant demand for services related to compliance and strategic planning. Furthermore, the development of advanced AI-driven platforms for real-time transfer pricing monitoring and predictive risk assessment offers substantial growth potential, enabling proactive compliance rather than reactive problem-solving. The expansion of services catering to intangible asset valuation and cross-border tax disputes also presents lucrative avenues for specialized firms.
Growth Accelerators in the Tax Transfer Pricing Services Industry
Several catalysts are accelerating growth in the Tax Transfer Pricing Services industry. The proactive adoption of digital technologies, including AI, machine learning, and big data analytics, by leading service providers is enhancing efficiency, accuracy, and the predictive capabilities of their offerings. Strategic partnerships between accounting firms, technology providers, and legal advisors are creating integrated solutions that address the holistic tax needs of multinational corporations. Market expansion strategies, including the development of specialized services for emerging economies and niche industries, are further fueling growth. The continuous need for robust documentation and compliance in response to global tax reform efforts, such as BEPS 2.0, acts as a sustained growth accelerator.
Key Players Shaping the Tax Transfer Pricing Services Market
The Tax Transfer Pricing Services market is shaped by a formidable array of global leaders and specialized firms. These key players offer comprehensive solutions ranging from advisory and documentation to dispute resolution.
- PwC
- EY
- Deloitte
- KPMG
- RSM International
- Crowe
- Grant Thornton
- Cherry Bekaert
- BDO
- CohnReznick
- CBIZ
- CliftonLarsonAllen (CLA)
- EisnerAmper
- Moss Adams
- Kroll
Notable Milestones in Tax Transfer Pricing Services Sector
- 2019: OECD releases Pillar One and Pillar Two blueprints, signaling a major shift in international tax frameworks.
- 2020: Increased regulatory focus and enforcement actions by tax authorities globally, intensifying demand for compliance.
- 2021: Launch of AI-powered transfer pricing software solutions by several major firms, improving efficiency and analytics.
- 2022: Significant increase in cross-border M&A activity, driving demand for transfer pricing due diligence.
- 2023: Growing emphasis on the tax implications of intangible assets and digital economy, leading to specialized service development.
- 2024: Further implementation and refinement of BEPS 2.0 measures, including initial Country-by-Country Reporting updates and ongoing consultations.
In-Depth Tax Transfer Pricing Services Market Outlook
The outlook for the Tax Transfer Pricing Services market remains exceptionally strong, driven by a sustained need for compliance in an ever-evolving global tax landscape. Growth accelerators such as advanced technological integration, particularly in AI and data analytics for predictive risk management, will continue to redefine service delivery. Strategic alliances and expansions into emerging markets will broaden the reach of these essential services. The persistent complexity of international tax regulations, coupled with the ongoing implementation of BEPS 2.0, ensures a consistent demand for expert advisory, robust documentation, and adept dispute resolution capabilities. Companies will increasingly seek proactive, value-driven transfer pricing strategies that go beyond mere compliance to optimize their global tax positions and mitigate risks in the long term. The market is poised for continued innovation and strategic growth, reflecting its critical importance in the global business environment.
Tax Transfer Pricing Services Segmentation
-
1. Application
- 1.1. Financial Industry
- 1.2. Consumer & Retail
- 1.3. Industrial Manufacturing
- 1.4. Energy & Natural Resources
- 1.5. Real Estate
- 1.6. Others
-
2. Types
- 2.1. Advisory & Value Chain Optimisation
- 2.2. Documentation & BEPS / CbCR Compliance
- 2.3. Implementation & Compliance Management
- 2.4. Controversy & Dispute Resolution
- 2.5. Others
Tax Transfer Pricing Services Segmentation By Geography
-
1. North America
- 1.1. United States
- 1.2. Canada
- 1.3. Mexico
-
2. South America
- 2.1. Brazil
- 2.2. Argentina
- 2.3. Rest of South America
-
3. Europe
- 3.1. United Kingdom
- 3.2. Germany
- 3.3. France
- 3.4. Italy
- 3.5. Spain
- 3.6. Russia
- 3.7. Benelux
- 3.8. Nordics
- 3.9. Rest of Europe
-
4. Middle East & Africa
- 4.1. Turkey
- 4.2. Israel
- 4.3. GCC
- 4.4. North Africa
- 4.5. South Africa
- 4.6. Rest of Middle East & Africa
-
5. Asia Pacific
- 5.1. China
- 5.2. India
- 5.3. Japan
- 5.4. South Korea
- 5.5. ASEAN
- 5.6. Oceania
- 5.7. Rest of Asia Pacific
Tax Transfer Pricing Services Regional Market Share
Geographic Coverage of Tax Transfer Pricing Services
Tax Transfer Pricing Services REPORT HIGHLIGHTS
| Aspects | Details |
|---|---|
| Study Period | 2020-2034 |
| Base Year | 2025 |
| Estimated Year | 2026 |
| Forecast Period | 2026-2034 |
| Historical Period | 2020-2025 |
| Growth Rate | CAGR of XX% from 2020-2034 |
| Segmentation |
|
Table of Contents
- 1. Introduction
- 1.1. Research Scope
- 1.2. Market Segmentation
- 1.3. Research Methodology
- 1.4. Definitions and Assumptions
- 2. Executive Summary
- 2.1. Introduction
- 3. Market Dynamics
- 3.1. Introduction
- 3.2. Market Drivers
- 3.3. Market Restrains
- 3.4. Market Trends
- 4. Market Factor Analysis
- 4.1. Porters Five Forces
- 4.2. Supply/Value Chain
- 4.3. PESTEL analysis
- 4.4. Market Entropy
- 4.5. Patent/Trademark Analysis
- 5. Global Tax Transfer Pricing Services Analysis, Insights and Forecast, 2020-2032
- 5.1. Market Analysis, Insights and Forecast - by Application
- 5.1.1. Financial Industry
- 5.1.2. Consumer & Retail
- 5.1.3. Industrial Manufacturing
- 5.1.4. Energy & Natural Resources
- 5.1.5. Real Estate
- 5.1.6. Others
- 5.2. Market Analysis, Insights and Forecast - by Types
- 5.2.1. Advisory & Value Chain Optimisation
- 5.2.2. Documentation & BEPS / CbCR Compliance
- 5.2.3. Implementation & Compliance Management
- 5.2.4. Controversy & Dispute Resolution
- 5.2.5. Others
- 5.3. Market Analysis, Insights and Forecast - by Region
- 5.3.1. North America
- 5.3.2. South America
- 5.3.3. Europe
- 5.3.4. Middle East & Africa
- 5.3.5. Asia Pacific
- 5.1. Market Analysis, Insights and Forecast - by Application
- 6. North America Tax Transfer Pricing Services Analysis, Insights and Forecast, 2020-2032
- 6.1. Market Analysis, Insights and Forecast - by Application
- 6.1.1. Financial Industry
- 6.1.2. Consumer & Retail
- 6.1.3. Industrial Manufacturing
- 6.1.4. Energy & Natural Resources
- 6.1.5. Real Estate
- 6.1.6. Others
- 6.2. Market Analysis, Insights and Forecast - by Types
- 6.2.1. Advisory & Value Chain Optimisation
- 6.2.2. Documentation & BEPS / CbCR Compliance
- 6.2.3. Implementation & Compliance Management
- 6.2.4. Controversy & Dispute Resolution
- 6.2.5. Others
- 6.1. Market Analysis, Insights and Forecast - by Application
- 7. South America Tax Transfer Pricing Services Analysis, Insights and Forecast, 2020-2032
- 7.1. Market Analysis, Insights and Forecast - by Application
- 7.1.1. Financial Industry
- 7.1.2. Consumer & Retail
- 7.1.3. Industrial Manufacturing
- 7.1.4. Energy & Natural Resources
- 7.1.5. Real Estate
- 7.1.6. Others
- 7.2. Market Analysis, Insights and Forecast - by Types
- 7.2.1. Advisory & Value Chain Optimisation
- 7.2.2. Documentation & BEPS / CbCR Compliance
- 7.2.3. Implementation & Compliance Management
- 7.2.4. Controversy & Dispute Resolution
- 7.2.5. Others
- 7.1. Market Analysis, Insights and Forecast - by Application
- 8. Europe Tax Transfer Pricing Services Analysis, Insights and Forecast, 2020-2032
- 8.1. Market Analysis, Insights and Forecast - by Application
- 8.1.1. Financial Industry
- 8.1.2. Consumer & Retail
- 8.1.3. Industrial Manufacturing
- 8.1.4. Energy & Natural Resources
- 8.1.5. Real Estate
- 8.1.6. Others
- 8.2. Market Analysis, Insights and Forecast - by Types
- 8.2.1. Advisory & Value Chain Optimisation
- 8.2.2. Documentation & BEPS / CbCR Compliance
- 8.2.3. Implementation & Compliance Management
- 8.2.4. Controversy & Dispute Resolution
- 8.2.5. Others
- 8.1. Market Analysis, Insights and Forecast - by Application
- 9. Middle East & Africa Tax Transfer Pricing Services Analysis, Insights and Forecast, 2020-2032
- 9.1. Market Analysis, Insights and Forecast - by Application
- 9.1.1. Financial Industry
- 9.1.2. Consumer & Retail
- 9.1.3. Industrial Manufacturing
- 9.1.4. Energy & Natural Resources
- 9.1.5. Real Estate
- 9.1.6. Others
- 9.2. Market Analysis, Insights and Forecast - by Types
- 9.2.1. Advisory & Value Chain Optimisation
- 9.2.2. Documentation & BEPS / CbCR Compliance
- 9.2.3. Implementation & Compliance Management
- 9.2.4. Controversy & Dispute Resolution
- 9.2.5. Others
- 9.1. Market Analysis, Insights and Forecast - by Application
- 10. Asia Pacific Tax Transfer Pricing Services Analysis, Insights and Forecast, 2020-2032
- 10.1. Market Analysis, Insights and Forecast - by Application
- 10.1.1. Financial Industry
- 10.1.2. Consumer & Retail
- 10.1.3. Industrial Manufacturing
- 10.1.4. Energy & Natural Resources
- 10.1.5. Real Estate
- 10.1.6. Others
- 10.2. Market Analysis, Insights and Forecast - by Types
- 10.2.1. Advisory & Value Chain Optimisation
- 10.2.2. Documentation & BEPS / CbCR Compliance
- 10.2.3. Implementation & Compliance Management
- 10.2.4. Controversy & Dispute Resolution
- 10.2.5. Others
- 10.1. Market Analysis, Insights and Forecast - by Application
- 11. Competitive Analysis
- 11.1. Global Market Share Analysis 2025
- 11.2. Company Profiles
- 11.2.1 PwC
- 11.2.1.1. Overview
- 11.2.1.2. Products
- 11.2.1.3. SWOT Analysis
- 11.2.1.4. Recent Developments
- 11.2.1.5. Financials (Based on Availability)
- 11.2.2 EY
- 11.2.2.1. Overview
- 11.2.2.2. Products
- 11.2.2.3. SWOT Analysis
- 11.2.2.4. Recent Developments
- 11.2.2.5. Financials (Based on Availability)
- 11.2.3 Deloitte
- 11.2.3.1. Overview
- 11.2.3.2. Products
- 11.2.3.3. SWOT Analysis
- 11.2.3.4. Recent Developments
- 11.2.3.5. Financials (Based on Availability)
- 11.2.4 KPMG
- 11.2.4.1. Overview
- 11.2.4.2. Products
- 11.2.4.3. SWOT Analysis
- 11.2.4.4. Recent Developments
- 11.2.4.5. Financials (Based on Availability)
- 11.2.5 RSM International
- 11.2.5.1. Overview
- 11.2.5.2. Products
- 11.2.5.3. SWOT Analysis
- 11.2.5.4. Recent Developments
- 11.2.5.5. Financials (Based on Availability)
- 11.2.6 Crowe
- 11.2.6.1. Overview
- 11.2.6.2. Products
- 11.2.6.3. SWOT Analysis
- 11.2.6.4. Recent Developments
- 11.2.6.5. Financials (Based on Availability)
- 11.2.7 Grant Thornton
- 11.2.7.1. Overview
- 11.2.7.2. Products
- 11.2.7.3. SWOT Analysis
- 11.2.7.4. Recent Developments
- 11.2.7.5. Financials (Based on Availability)
- 11.2.8 Cherry Bekaert
- 11.2.8.1. Overview
- 11.2.8.2. Products
- 11.2.8.3. SWOT Analysis
- 11.2.8.4. Recent Developments
- 11.2.8.5. Financials (Based on Availability)
- 11.2.9 BDO
- 11.2.9.1. Overview
- 11.2.9.2. Products
- 11.2.9.3. SWOT Analysis
- 11.2.9.4. Recent Developments
- 11.2.9.5. Financials (Based on Availability)
- 11.2.10 CohnReznick
- 11.2.10.1. Overview
- 11.2.10.2. Products
- 11.2.10.3. SWOT Analysis
- 11.2.10.4. Recent Developments
- 11.2.10.5. Financials (Based on Availability)
- 11.2.11 CBIZ
- 11.2.11.1. Overview
- 11.2.11.2. Products
- 11.2.11.3. SWOT Analysis
- 11.2.11.4. Recent Developments
- 11.2.11.5. Financials (Based on Availability)
- 11.2.12 CliftonLarsonAllen (CLA)
- 11.2.12.1. Overview
- 11.2.12.2. Products
- 11.2.12.3. SWOT Analysis
- 11.2.12.4. Recent Developments
- 11.2.12.5. Financials (Based on Availability)
- 11.2.13 EisnerAmper
- 11.2.13.1. Overview
- 11.2.13.2. Products
- 11.2.13.3. SWOT Analysis
- 11.2.13.4. Recent Developments
- 11.2.13.5. Financials (Based on Availability)
- 11.2.14 Moss Adams
- 11.2.14.1. Overview
- 11.2.14.2. Products
- 11.2.14.3. SWOT Analysis
- 11.2.14.4. Recent Developments
- 11.2.14.5. Financials (Based on Availability)
- 11.2.15 Kroll
- 11.2.15.1. Overview
- 11.2.15.2. Products
- 11.2.15.3. SWOT Analysis
- 11.2.15.4. Recent Developments
- 11.2.15.5. Financials (Based on Availability)
- 11.2.1 PwC
List of Figures
- Figure 1: Global Tax Transfer Pricing Services Revenue Breakdown (million, %) by Region 2025 & 2033
- Figure 2: North America Tax Transfer Pricing Services Revenue (million), by Application 2025 & 2033
- Figure 3: North America Tax Transfer Pricing Services Revenue Share (%), by Application 2025 & 2033
- Figure 4: North America Tax Transfer Pricing Services Revenue (million), by Types 2025 & 2033
- Figure 5: North America Tax Transfer Pricing Services Revenue Share (%), by Types 2025 & 2033
- Figure 6: North America Tax Transfer Pricing Services Revenue (million), by Country 2025 & 2033
- Figure 7: North America Tax Transfer Pricing Services Revenue Share (%), by Country 2025 & 2033
- Figure 8: South America Tax Transfer Pricing Services Revenue (million), by Application 2025 & 2033
- Figure 9: South America Tax Transfer Pricing Services Revenue Share (%), by Application 2025 & 2033
- Figure 10: South America Tax Transfer Pricing Services Revenue (million), by Types 2025 & 2033
- Figure 11: South America Tax Transfer Pricing Services Revenue Share (%), by Types 2025 & 2033
- Figure 12: South America Tax Transfer Pricing Services Revenue (million), by Country 2025 & 2033
- Figure 13: South America Tax Transfer Pricing Services Revenue Share (%), by Country 2025 & 2033
- Figure 14: Europe Tax Transfer Pricing Services Revenue (million), by Application 2025 & 2033
- Figure 15: Europe Tax Transfer Pricing Services Revenue Share (%), by Application 2025 & 2033
- Figure 16: Europe Tax Transfer Pricing Services Revenue (million), by Types 2025 & 2033
- Figure 17: Europe Tax Transfer Pricing Services Revenue Share (%), by Types 2025 & 2033
- Figure 18: Europe Tax Transfer Pricing Services Revenue (million), by Country 2025 & 2033
- Figure 19: Europe Tax Transfer Pricing Services Revenue Share (%), by Country 2025 & 2033
- Figure 20: Middle East & Africa Tax Transfer Pricing Services Revenue (million), by Application 2025 & 2033
- Figure 21: Middle East & Africa Tax Transfer Pricing Services Revenue Share (%), by Application 2025 & 2033
- Figure 22: Middle East & Africa Tax Transfer Pricing Services Revenue (million), by Types 2025 & 2033
- Figure 23: Middle East & Africa Tax Transfer Pricing Services Revenue Share (%), by Types 2025 & 2033
- Figure 24: Middle East & Africa Tax Transfer Pricing Services Revenue (million), by Country 2025 & 2033
- Figure 25: Middle East & Africa Tax Transfer Pricing Services Revenue Share (%), by Country 2025 & 2033
- Figure 26: Asia Pacific Tax Transfer Pricing Services Revenue (million), by Application 2025 & 2033
- Figure 27: Asia Pacific Tax Transfer Pricing Services Revenue Share (%), by Application 2025 & 2033
- Figure 28: Asia Pacific Tax Transfer Pricing Services Revenue (million), by Types 2025 & 2033
- Figure 29: Asia Pacific Tax Transfer Pricing Services Revenue Share (%), by Types 2025 & 2033
- Figure 30: Asia Pacific Tax Transfer Pricing Services Revenue (million), by Country 2025 & 2033
- Figure 31: Asia Pacific Tax Transfer Pricing Services Revenue Share (%), by Country 2025 & 2033
List of Tables
- Table 1: Global Tax Transfer Pricing Services Revenue million Forecast, by Application 2020 & 2033
- Table 2: Global Tax Transfer Pricing Services Revenue million Forecast, by Types 2020 & 2033
- Table 3: Global Tax Transfer Pricing Services Revenue million Forecast, by Region 2020 & 2033
- Table 4: Global Tax Transfer Pricing Services Revenue million Forecast, by Application 2020 & 2033
- Table 5: Global Tax Transfer Pricing Services Revenue million Forecast, by Types 2020 & 2033
- Table 6: Global Tax Transfer Pricing Services Revenue million Forecast, by Country 2020 & 2033
- Table 7: United States Tax Transfer Pricing Services Revenue (million) Forecast, by Application 2020 & 2033
- Table 8: Canada Tax Transfer Pricing Services Revenue (million) Forecast, by Application 2020 & 2033
- Table 9: Mexico Tax Transfer Pricing Services Revenue (million) Forecast, by Application 2020 & 2033
- Table 10: Global Tax Transfer Pricing Services Revenue million Forecast, by Application 2020 & 2033
- Table 11: Global Tax Transfer Pricing Services Revenue million Forecast, by Types 2020 & 2033
- Table 12: Global Tax Transfer Pricing Services Revenue million Forecast, by Country 2020 & 2033
- Table 13: Brazil Tax Transfer Pricing Services Revenue (million) Forecast, by Application 2020 & 2033
- Table 14: Argentina Tax Transfer Pricing Services Revenue (million) Forecast, by Application 2020 & 2033
- Table 15: Rest of South America Tax Transfer Pricing Services Revenue (million) Forecast, by Application 2020 & 2033
- Table 16: Global Tax Transfer Pricing Services Revenue million Forecast, by Application 2020 & 2033
- Table 17: Global Tax Transfer Pricing Services Revenue million Forecast, by Types 2020 & 2033
- Table 18: Global Tax Transfer Pricing Services Revenue million Forecast, by Country 2020 & 2033
- Table 19: United Kingdom Tax Transfer Pricing Services Revenue (million) Forecast, by Application 2020 & 2033
- Table 20: Germany Tax Transfer Pricing Services Revenue (million) Forecast, by Application 2020 & 2033
- Table 21: France Tax Transfer Pricing Services Revenue (million) Forecast, by Application 2020 & 2033
- Table 22: Italy Tax Transfer Pricing Services Revenue (million) Forecast, by Application 2020 & 2033
- Table 23: Spain Tax Transfer Pricing Services Revenue (million) Forecast, by Application 2020 & 2033
- Table 24: Russia Tax Transfer Pricing Services Revenue (million) Forecast, by Application 2020 & 2033
- Table 25: Benelux Tax Transfer Pricing Services Revenue (million) Forecast, by Application 2020 & 2033
- Table 26: Nordics Tax Transfer Pricing Services Revenue (million) Forecast, by Application 2020 & 2033
- Table 27: Rest of Europe Tax Transfer Pricing Services Revenue (million) Forecast, by Application 2020 & 2033
- Table 28: Global Tax Transfer Pricing Services Revenue million Forecast, by Application 2020 & 2033
- Table 29: Global Tax Transfer Pricing Services Revenue million Forecast, by Types 2020 & 2033
- Table 30: Global Tax Transfer Pricing Services Revenue million Forecast, by Country 2020 & 2033
- Table 31: Turkey Tax Transfer Pricing Services Revenue (million) Forecast, by Application 2020 & 2033
- Table 32: Israel Tax Transfer Pricing Services Revenue (million) Forecast, by Application 2020 & 2033
- Table 33: GCC Tax Transfer Pricing Services Revenue (million) Forecast, by Application 2020 & 2033
- Table 34: North Africa Tax Transfer Pricing Services Revenue (million) Forecast, by Application 2020 & 2033
- Table 35: South Africa Tax Transfer Pricing Services Revenue (million) Forecast, by Application 2020 & 2033
- Table 36: Rest of Middle East & Africa Tax Transfer Pricing Services Revenue (million) Forecast, by Application 2020 & 2033
- Table 37: Global Tax Transfer Pricing Services Revenue million Forecast, by Application 2020 & 2033
- Table 38: Global Tax Transfer Pricing Services Revenue million Forecast, by Types 2020 & 2033
- Table 39: Global Tax Transfer Pricing Services Revenue million Forecast, by Country 2020 & 2033
- Table 40: China Tax Transfer Pricing Services Revenue (million) Forecast, by Application 2020 & 2033
- Table 41: India Tax Transfer Pricing Services Revenue (million) Forecast, by Application 2020 & 2033
- Table 42: Japan Tax Transfer Pricing Services Revenue (million) Forecast, by Application 2020 & 2033
- Table 43: South Korea Tax Transfer Pricing Services Revenue (million) Forecast, by Application 2020 & 2033
- Table 44: ASEAN Tax Transfer Pricing Services Revenue (million) Forecast, by Application 2020 & 2033
- Table 45: Oceania Tax Transfer Pricing Services Revenue (million) Forecast, by Application 2020 & 2033
- Table 46: Rest of Asia Pacific Tax Transfer Pricing Services Revenue (million) Forecast, by Application 2020 & 2033
Frequently Asked Questions
1. What is the projected Compound Annual Growth Rate (CAGR) of the Tax Transfer Pricing Services?
The projected CAGR is approximately XX%.
2. Which companies are prominent players in the Tax Transfer Pricing Services?
Key companies in the market include PwC, EY, Deloitte, KPMG, RSM International, Crowe, Grant Thornton, Cherry Bekaert, BDO, CohnReznick, CBIZ, CliftonLarsonAllen (CLA), EisnerAmper, Moss Adams, Kroll.
3. What are the main segments of the Tax Transfer Pricing Services?
The market segments include Application, Types.
4. Can you provide details about the market size?
The market size is estimated to be USD XXX million as of 2022.
5. What are some drivers contributing to market growth?
N/A
6. What are the notable trends driving market growth?
N/A
7. Are there any restraints impacting market growth?
N/A
8. Can you provide examples of recent developments in the market?
N/A
9. What pricing options are available for accessing the report?
Pricing options include single-user, multi-user, and enterprise licenses priced at USD 4900.00, USD 7350.00, and USD 9800.00 respectively.
10. Is the market size provided in terms of value or volume?
The market size is provided in terms of value, measured in million.
11. Are there any specific market keywords associated with the report?
Yes, the market keyword associated with the report is "Tax Transfer Pricing Services," which aids in identifying and referencing the specific market segment covered.
12. How do I determine which pricing option suits my needs best?
The pricing options vary based on user requirements and access needs. Individual users may opt for single-user licenses, while businesses requiring broader access may choose multi-user or enterprise licenses for cost-effective access to the report.
13. Are there any additional resources or data provided in the Tax Transfer Pricing Services report?
While the report offers comprehensive insights, it's advisable to review the specific contents or supplementary materials provided to ascertain if additional resources or data are available.
14. How can I stay updated on further developments or reports in the Tax Transfer Pricing Services?
To stay informed about further developments, trends, and reports in the Tax Transfer Pricing Services, consider subscribing to industry newsletters, following relevant companies and organizations, or regularly checking reputable industry news sources and publications.
Methodology
Step 1 - Identification of Relevant Samples Size from Population Database


Step 2 - Approaches for Defining Global Market Size (Value, Volume* & Price*)

Note*: In applicable scenarios
Step 3 - Data Sources
Primary Research
- Web Analytics
- Survey Reports
- Research Institute
- Latest Research Reports
- Opinion Leaders
Secondary Research
- Annual Reports
- White Paper
- Latest Press Release
- Industry Association
- Paid Database
- Investor Presentations

Step 4 - Data Triangulation
Involves using different sources of information in order to increase the validity of a study
These sources are likely to be stakeholders in a program - participants, other researchers, program staff, other community members, and so on.
Then we put all data in single framework & apply various statistical tools to find out the dynamic on the market.
During the analysis stage, feedback from the stakeholder groups would be compared to determine areas of agreement as well as areas of divergence