
Key Insights
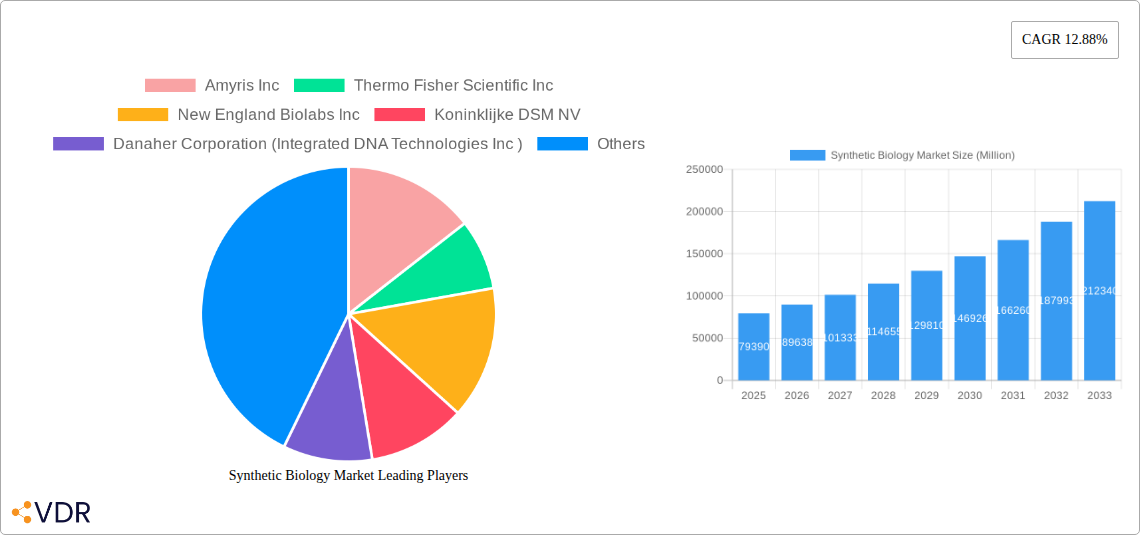
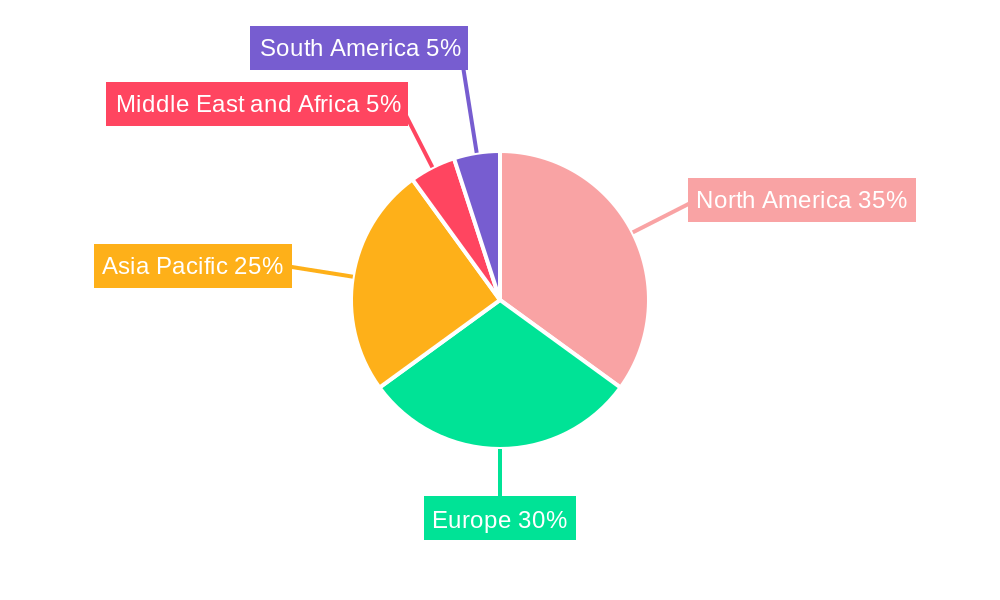
The synthetic biology market is experiencing robust growth, projected to reach \$79.39 billion in 2025 and expand significantly over the forecast period (2025-2033). A compound annual growth rate (CAGR) of 12.88% indicates substantial market expansion driven by several key factors. Increasing demand for sustainable and cost-effective solutions in healthcare, particularly in drug discovery and development, is a major catalyst. The burgeoning biofuels sector, seeking alternatives to fossil fuels, is another significant driver. Advancements in gene editing technologies like CRISPR-Cas9 are fueling innovation and creating new possibilities in various applications, from developing novel biomaterials to engineering microorganisms for industrial processes. Furthermore, the growing awareness of environmental sustainability is propelling the adoption of synthetic biology solutions in agriculture and environmental remediation. The market segmentation reveals a diverse landscape, with core products (e.g., enzymes, DNA synthesis) forming a strong foundation, while enabling and enabled products are witnessing accelerated growth driven by downstream applications. The geographical distribution of the market shows a strong presence in North America and Europe, reflecting established research infrastructure and robust regulatory frameworks. However, Asia-Pacific is poised for substantial growth, given its increasing investments in biotechnology and rising demand in emerging economies.
The competitive landscape is characterized by a mix of established players and innovative start-ups. Major companies like Amyris, Thermo Fisher Scientific, and Illumina are leveraging their expertise to capture significant market share, while smaller companies specializing in niche applications are contributing to the overall market dynamism. Despite the promising outlook, challenges remain, including regulatory hurdles, ethical concerns surrounding genetic modification, and the high cost of research and development. However, continuous technological advancements and government support for synthetic biology initiatives are expected to mitigate these challenges and propel sustained market expansion in the long term. The market's future hinges on continued innovation, strategic collaborations, and a favorable regulatory environment that promotes responsible technological development. Focusing on efficient production methods and cost-reduction strategies will be crucial for wider market penetration and realizing the full potential of synthetic biology across various industries.
Synthetic Biology Market: A Comprehensive Report (2019-2033)
This comprehensive report provides an in-depth analysis of the Synthetic Biology market, encompassing market dynamics, growth trends, regional segmentation, product landscape, key players, and future outlook. The study period covers 2019-2033, with 2025 as the base and estimated year. The forecast period spans 2025-2033, and the historical period encompasses 2019-2024. The report is essential for industry professionals, investors, and researchers seeking a detailed understanding of this rapidly evolving market. The total market size in 2025 is estimated at xx Million.
Synthetic Biology Market Market Dynamics & Structure
The Synthetic Biology market exhibits a moderately concentrated structure, with key players like Amyris Inc, Thermo Fisher Scientific Inc, and Danaher Corporation (Integrated DNA Technologies Inc) holding significant market share. Market concentration is expected to evolve with ongoing M&A activity and the emergence of new players. Technological innovation, particularly in gene editing and synthetic pathways, is a primary growth driver, while regulatory frameworks and public perception play crucial roles. Competitive substitutes, such as traditional chemical synthesis methods, present challenges. End-user demographics are diverse, spanning healthcare, agriculture, and industrial sectors.
- Market Concentration: Moderately concentrated, with top 5 players holding approximately xx% market share in 2025.
- Technological Innovation: CRISPR-Cas9, next-generation sequencing, and advanced bioinformatics are key drivers.
- Regulatory Landscape: Stringent regulations in certain applications (e.g., pharmaceuticals) can act as barriers to entry.
- M&A Activity: A moderate number of deals (xx) were observed during 2019-2024. The forecast suggests a potential increase to xx deals during 2025-2033 driven by consolidation and expansion strategies.
- Competitive Substitutes: Traditional chemical synthesis remains a competitive alternative in certain applications.
- End-User Demographics: Healthcare, chemicals, food and agriculture, and other applications represent diverse end-user segments.
Synthetic Biology Market Growth Trends & Insights
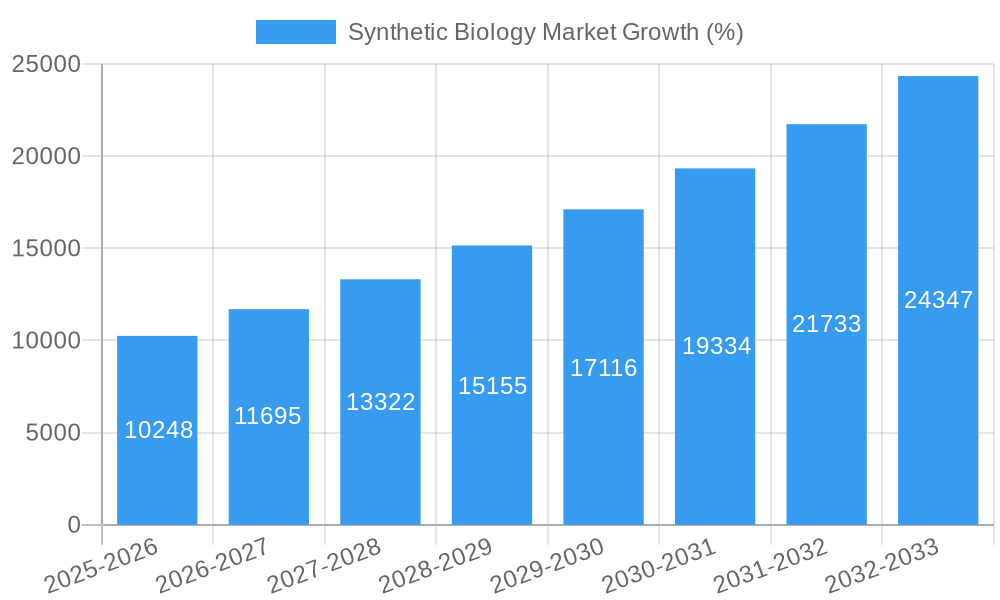
The Synthetic Biology market demonstrates robust growth, driven by technological advancements and increasing demand across various applications. The market size is projected to reach xx Million by 2033, exhibiting a CAGR of xx% during the forecast period. Adoption rates are accelerating, particularly in the healthcare and agricultural sectors. Technological disruptions, such as improved gene editing techniques and AI-driven design tools, are further fueling market expansion. Consumer behavior shifts towards sustainable and bio-based products are also contributing to growth. Market penetration across various segments is expected to increase significantly by 2033. (Note: This section requires XXX to provide more specific details on the metrics).
Dominant Regions, Countries, or Segments in Synthetic Biology Market
The North American market currently holds the largest share of the global Synthetic Biology market, driven by substantial investments in R&D, a strong regulatory framework (albeit complex), and the presence of major players. Europe and Asia-Pacific are also witnessing significant growth, driven by increasing government support, rising demand for bio-based products, and expanding applications.
By Product:
- Enabling Products: This segment is anticipated to hold the largest market share, driven by consistent demand for essential tools and technologies that underpin the industry.
- Core Products: This segment shows steady growth, crucial for foundational processes in synthetic biology.
- Enabled Products: This segment displays high growth potential, fueled by innovative applications and evolving consumer demands.
By Application:
- Healthcare: This segment dominates the market, driven by the potential for developing novel therapeutics and diagnostics.
- Chemicals (Including Biofuels): This segment exhibits strong growth due to rising demand for sustainable alternatives to petrochemicals.
- Food and Agriculture: This sector is experiencing notable expansion fueled by the promise of increased yields, improved nutrition, and sustainable agricultural practices.
- Other Applications: These niche applications, like biosecurity and environmental remediation, show promising growth potential.
Synthetic Biology Market Product Landscape
The Synthetic Biology market is characterized by ongoing product innovation, with novel tools, technologies, and applications emerging regularly. This includes improved gene editing technologies, advanced bioinformatics software, and customized synthetic pathways. Companies are emphasizing unique selling propositions based on efficiency, cost-effectiveness, and application specificity. Technological advancements focus on precision, scalability, and sustainability, impacting the performance metrics of various synthetic biology products.
Key Drivers, Barriers & Challenges in Synthetic Biology Market
Key Drivers:
- Technological advancements in gene editing, synthetic biology and biomanufacturing.
- Increasing demand for sustainable and bio-based products across various sectors.
- Government initiatives and funding supporting synthetic biology research and development.
- Growing adoption of synthetic biology in healthcare, agriculture, and industrial applications.
Key Barriers and Challenges:
- High R&D costs and lengthy development times.
- Ethical and regulatory hurdles regarding the release of genetically modified organisms.
- Competition from traditional chemical synthesis methods.
- Supply chain disruptions impacting the availability of key raw materials and reagents. This has been observed to impact product development timelines and increases production costs by approximately xx% in some cases.
Emerging Opportunities in Synthetic Biology Market
Emerging opportunities lie in untapped markets, such as developing countries with growing demand for healthcare and agricultural solutions. Innovative applications, like personalized medicine and advanced biomaterials, hold significant potential. Evolving consumer preferences for sustainable and ethically sourced products are creating new market segments.
Growth Accelerators in the Synthetic Biology Market Industry
Technological breakthroughs in gene editing, AI-driven design, and high-throughput screening are accelerating market growth. Strategic partnerships between academic institutions, research organizations, and private companies are fostering innovation. Market expansion strategies, such as geographical diversification and entry into new applications, are also fueling market expansion.
Key Players Shaping the Synthetic Biology Market Market
- Amyris Inc
- Thermo Fisher Scientific Inc
- New England Biolabs Inc
- Koninklijke DSM NV
- Danaher Corporation (Integrated DNA Technologies Inc)
- GenScript
- Precigen Inc (Intrexon Corporation)
- Illumina Inc
- Viridos Inc (Synthetic Genomics Inc)
- Novozymes AS
Notable Milestones in Synthetic Biology Market Sector
- January 2024: Rice University launched the Rice Synthetic Biology Institute, fostering collaborative research and technology translation. This is expected to drive innovation and accelerate the development of new synthetic biology products.
- May 2023: GenScript's SynBioBeta Conference showcased advancements in synthetic biology tools and techniques, highlighting industry collaborations and setting the stage for future market developments.
In-Depth Synthetic Biology Market Market Outlook
The Synthetic Biology market presents substantial future potential, driven by continuous technological progress and expanding applications. Strategic opportunities exist in developing novel products, forging partnerships, and expanding into emerging markets. The market's long-term growth trajectory is projected to remain positive, driven by increasing investment and growing awareness of the sector's potential to address global challenges in healthcare, agriculture, and sustainability.
Synthetic Biology Market Segmentation
-
1. Product
- 1.1. Core Products
- 1.2. Enabling Products
- 1.3. Enabled Products
-
2. Applications
- 2.1. Healthcare
- 2.2. Chemicals (Including Biofuels)
- 2.3. Food and Agriculture
- 2.4. Other Ap
Synthetic Biology Market Segmentation By Geography
-
1. North America
- 1.1. United States
- 1.2. Canada
- 1.3. Mexico
-
2. Europe
- 2.1. Germany
- 2.2. United Kingdom
- 2.3. France
- 2.4. Italy
- 2.5. Spain
- 2.6. Rest of Europe
-
3. Asia Pacific
- 3.1. China
- 3.2. Japan
- 3.3. India
- 3.4. Australia
- 3.5. South Korea
- 3.6. Rest of Asia Pacific
-
4. Middle East and Africa
- 4.1. GCC
- 4.2. South Africa
- 4.3. Rest of Middle East and Africa
-
5. South America
- 5.1. Brazil
- 5.2. Argentina
- 5.3. Rest of South America
Synthetic Biology Market REPORT HIGHLIGHTS
| Aspects | Details |
|---|---|
| Study Period | 2019-2033 |
| Base Year | 2024 |
| Estimated Year | 2025 |
| Forecast Period | 2025-2033 |
| Historical Period | 2019-2024 |
| Growth Rate | CAGR of 12.88% from 2019-2033 |
| Segmentation |
|
Table of Contents
- 1. Introduction
- 1.1. Research Scope
- 1.2. Market Segmentation
- 1.3. Research Methodology
- 1.4. Definitions and Assumptions
- 2. Executive Summary
- 2.1. Introduction
- 3. Market Dynamics
- 3.1. Introduction
- 3.2. Market Drivers
- 3.2.1. Increasing Support from Government and Private Institutions; Increasing R&D Investments in Drug Discovery and Development; Declining Cost of DNA Sequencing and Synthesizing
- 3.3. Market Restrains
- 3.3.1. Bio-safety and Bio-security; Ethical Issues Related to Synthetic Biology; Reimbursement Cuts Causing Pricing Pressure
- 3.4. Market Trends
- 3.4.1. The Healthcare Segment is Expected to Witness Significant Growth During the Forecast Period
- 4. Market Factor Analysis
- 4.1. Porters Five Forces
- 4.2. Supply/Value Chain
- 4.3. PESTEL analysis
- 4.4. Market Entropy
- 4.5. Patent/Trademark Analysis
- 5. Global Synthetic Biology Market Analysis, Insights and Forecast, 2019-2031
- 5.1. Market Analysis, Insights and Forecast - by Product
- 5.1.1. Core Products
- 5.1.2. Enabling Products
- 5.1.3. Enabled Products
- 5.2. Market Analysis, Insights and Forecast - by Applications
- 5.2.1. Healthcare
- 5.2.2. Chemicals (Including Biofuels)
- 5.2.3. Food and Agriculture
- 5.2.4. Other Ap
- 5.3. Market Analysis, Insights and Forecast - by Region
- 5.3.1. North America
- 5.3.2. Europe
- 5.3.3. Asia Pacific
- 5.3.4. Middle East and Africa
- 5.3.5. South America
- 5.1. Market Analysis, Insights and Forecast - by Product
- 6. North America Synthetic Biology Market Analysis, Insights and Forecast, 2019-2031
- 6.1. Market Analysis, Insights and Forecast - by Product
- 6.1.1. Core Products
- 6.1.2. Enabling Products
- 6.1.3. Enabled Products
- 6.2. Market Analysis, Insights and Forecast - by Applications
- 6.2.1. Healthcare
- 6.2.2. Chemicals (Including Biofuels)
- 6.2.3. Food and Agriculture
- 6.2.4. Other Ap
- 6.1. Market Analysis, Insights and Forecast - by Product
- 7. Europe Synthetic Biology Market Analysis, Insights and Forecast, 2019-2031
- 7.1. Market Analysis, Insights and Forecast - by Product
- 7.1.1. Core Products
- 7.1.2. Enabling Products
- 7.1.3. Enabled Products
- 7.2. Market Analysis, Insights and Forecast - by Applications
- 7.2.1. Healthcare
- 7.2.2. Chemicals (Including Biofuels)
- 7.2.3. Food and Agriculture
- 7.2.4. Other Ap
- 7.1. Market Analysis, Insights and Forecast - by Product
- 8. Asia Pacific Synthetic Biology Market Analysis, Insights and Forecast, 2019-2031
- 8.1. Market Analysis, Insights and Forecast - by Product
- 8.1.1. Core Products
- 8.1.2. Enabling Products
- 8.1.3. Enabled Products
- 8.2. Market Analysis, Insights and Forecast - by Applications
- 8.2.1. Healthcare
- 8.2.2. Chemicals (Including Biofuels)
- 8.2.3. Food and Agriculture
- 8.2.4. Other Ap
- 8.1. Market Analysis, Insights and Forecast - by Product
- 9. Middle East and Africa Synthetic Biology Market Analysis, Insights and Forecast, 2019-2031
- 9.1. Market Analysis, Insights and Forecast - by Product
- 9.1.1. Core Products
- 9.1.2. Enabling Products
- 9.1.3. Enabled Products
- 9.2. Market Analysis, Insights and Forecast - by Applications
- 9.2.1. Healthcare
- 9.2.2. Chemicals (Including Biofuels)
- 9.2.3. Food and Agriculture
- 9.2.4. Other Ap
- 9.1. Market Analysis, Insights and Forecast - by Product
- 10. South America Synthetic Biology Market Analysis, Insights and Forecast, 2019-2031
- 10.1. Market Analysis, Insights and Forecast - by Product
- 10.1.1. Core Products
- 10.1.2. Enabling Products
- 10.1.3. Enabled Products
- 10.2. Market Analysis, Insights and Forecast - by Applications
- 10.2.1. Healthcare
- 10.2.2. Chemicals (Including Biofuels)
- 10.2.3. Food and Agriculture
- 10.2.4. Other Ap
- 10.1. Market Analysis, Insights and Forecast - by Product
- 11. North America Synthetic Biology Market Analysis, Insights and Forecast, 2019-2031
- 11.1. Market Analysis, Insights and Forecast - By Country/Sub-region
- 11.1.1 United States
- 11.1.2 Canada
- 11.1.3 Mexico
- 12. Europe Synthetic Biology Market Analysis, Insights and Forecast, 2019-2031
- 12.1. Market Analysis, Insights and Forecast - By Country/Sub-region
- 12.1.1 Germany
- 12.1.2 United Kingdom
- 12.1.3 France
- 12.1.4 Italy
- 12.1.5 Spain
- 12.1.6 Rest of Europe
- 13. Asia Pacific Synthetic Biology Market Analysis, Insights and Forecast, 2019-2031
- 13.1. Market Analysis, Insights and Forecast - By Country/Sub-region
- 13.1.1 China
- 13.1.2 Japan
- 13.1.3 India
- 13.1.4 Australia
- 13.1.5 South Korea
- 13.1.6 Rest of Asia Pacific
- 14. Middle East and Africa Synthetic Biology Market Analysis, Insights and Forecast, 2019-2031
- 14.1. Market Analysis, Insights and Forecast - By Country/Sub-region
- 14.1.1 GCC
- 14.1.2 South Africa
- 14.1.3 Rest of Middle East and Africa
- 15. South America Synthetic Biology Market Analysis, Insights and Forecast, 2019-2031
- 15.1. Market Analysis, Insights and Forecast - By Country/Sub-region
- 15.1.1 Brazil
- 15.1.2 Argentina
- 15.1.3 Rest of South America
- 16. Competitive Analysis
- 16.1. Global Market Share Analysis 2024
- 16.2. Company Profiles
- 16.2.1 Amyris Inc
- 16.2.1.1. Overview
- 16.2.1.2. Products
- 16.2.1.3. SWOT Analysis
- 16.2.1.4. Recent Developments
- 16.2.1.5. Financials (Based on Availability)
- 16.2.2 Thermo Fisher Scientific Inc
- 16.2.2.1. Overview
- 16.2.2.2. Products
- 16.2.2.3. SWOT Analysis
- 16.2.2.4. Recent Developments
- 16.2.2.5. Financials (Based on Availability)
- 16.2.3 New England Biolabs Inc
- 16.2.3.1. Overview
- 16.2.3.2. Products
- 16.2.3.3. SWOT Analysis
- 16.2.3.4. Recent Developments
- 16.2.3.5. Financials (Based on Availability)
- 16.2.4 Koninklijke DSM NV
- 16.2.4.1. Overview
- 16.2.4.2. Products
- 16.2.4.3. SWOT Analysis
- 16.2.4.4. Recent Developments
- 16.2.4.5. Financials (Based on Availability)
- 16.2.5 Danaher Corporation (Integrated DNA Technologies Inc )
- 16.2.5.1. Overview
- 16.2.5.2. Products
- 16.2.5.3. SWOT Analysis
- 16.2.5.4. Recent Developments
- 16.2.5.5. Financials (Based on Availability)
- 16.2.6 GenScript
- 16.2.6.1. Overview
- 16.2.6.2. Products
- 16.2.6.3. SWOT Analysis
- 16.2.6.4. Recent Developments
- 16.2.6.5. Financials (Based on Availability)
- 16.2.7 Precigen Inc (Intrexon Corporation)
- 16.2.7.1. Overview
- 16.2.7.2. Products
- 16.2.7.3. SWOT Analysis
- 16.2.7.4. Recent Developments
- 16.2.7.5. Financials (Based on Availability)
- 16.2.8 Illumina Inc
- 16.2.8.1. Overview
- 16.2.8.2. Products
- 16.2.8.3. SWOT Analysis
- 16.2.8.4. Recent Developments
- 16.2.8.5. Financials (Based on Availability)
- 16.2.9 Viridos Inc (Synthetic Genomics Inc )*List Not Exhaustive
- 16.2.9.1. Overview
- 16.2.9.2. Products
- 16.2.9.3. SWOT Analysis
- 16.2.9.4. Recent Developments
- 16.2.9.5. Financials (Based on Availability)
- 16.2.10 Novozymes AS
- 16.2.10.1. Overview
- 16.2.10.2. Products
- 16.2.10.3. SWOT Analysis
- 16.2.10.4. Recent Developments
- 16.2.10.5. Financials (Based on Availability)
- 16.2.1 Amyris Inc
List of Figures
- Figure 1: Global Synthetic Biology Market Revenue Breakdown (Million, %) by Region 2024 & 2032
- Figure 2: North America Synthetic Biology Market Revenue (Million), by Country 2024 & 2032
- Figure 3: North America Synthetic Biology Market Revenue Share (%), by Country 2024 & 2032
- Figure 4: Europe Synthetic Biology Market Revenue (Million), by Country 2024 & 2032
- Figure 5: Europe Synthetic Biology Market Revenue Share (%), by Country 2024 & 2032
- Figure 6: Asia Pacific Synthetic Biology Market Revenue (Million), by Country 2024 & 2032
- Figure 7: Asia Pacific Synthetic Biology Market Revenue Share (%), by Country 2024 & 2032
- Figure 8: Middle East and Africa Synthetic Biology Market Revenue (Million), by Country 2024 & 2032
- Figure 9: Middle East and Africa Synthetic Biology Market Revenue Share (%), by Country 2024 & 2032
- Figure 10: South America Synthetic Biology Market Revenue (Million), by Country 2024 & 2032
- Figure 11: South America Synthetic Biology Market Revenue Share (%), by Country 2024 & 2032
- Figure 12: North America Synthetic Biology Market Revenue (Million), by Product 2024 & 2032
- Figure 13: North America Synthetic Biology Market Revenue Share (%), by Product 2024 & 2032
- Figure 14: North America Synthetic Biology Market Revenue (Million), by Applications 2024 & 2032
- Figure 15: North America Synthetic Biology Market Revenue Share (%), by Applications 2024 & 2032
- Figure 16: North America Synthetic Biology Market Revenue (Million), by Country 2024 & 2032
- Figure 17: North America Synthetic Biology Market Revenue Share (%), by Country 2024 & 2032
- Figure 18: Europe Synthetic Biology Market Revenue (Million), by Product 2024 & 2032
- Figure 19: Europe Synthetic Biology Market Revenue Share (%), by Product 2024 & 2032
- Figure 20: Europe Synthetic Biology Market Revenue (Million), by Applications 2024 & 2032
- Figure 21: Europe Synthetic Biology Market Revenue Share (%), by Applications 2024 & 2032
- Figure 22: Europe Synthetic Biology Market Revenue (Million), by Country 2024 & 2032
- Figure 23: Europe Synthetic Biology Market Revenue Share (%), by Country 2024 & 2032
- Figure 24: Asia Pacific Synthetic Biology Market Revenue (Million), by Product 2024 & 2032
- Figure 25: Asia Pacific Synthetic Biology Market Revenue Share (%), by Product 2024 & 2032
- Figure 26: Asia Pacific Synthetic Biology Market Revenue (Million), by Applications 2024 & 2032
- Figure 27: Asia Pacific Synthetic Biology Market Revenue Share (%), by Applications 2024 & 2032
- Figure 28: Asia Pacific Synthetic Biology Market Revenue (Million), by Country 2024 & 2032
- Figure 29: Asia Pacific Synthetic Biology Market Revenue Share (%), by Country 2024 & 2032
- Figure 30: Middle East and Africa Synthetic Biology Market Revenue (Million), by Product 2024 & 2032
- Figure 31: Middle East and Africa Synthetic Biology Market Revenue Share (%), by Product 2024 & 2032
- Figure 32: Middle East and Africa Synthetic Biology Market Revenue (Million), by Applications 2024 & 2032
- Figure 33: Middle East and Africa Synthetic Biology Market Revenue Share (%), by Applications 2024 & 2032
- Figure 34: Middle East and Africa Synthetic Biology Market Revenue (Million), by Country 2024 & 2032
- Figure 35: Middle East and Africa Synthetic Biology Market Revenue Share (%), by Country 2024 & 2032
- Figure 36: South America Synthetic Biology Market Revenue (Million), by Product 2024 & 2032
- Figure 37: South America Synthetic Biology Market Revenue Share (%), by Product 2024 & 2032
- Figure 38: South America Synthetic Biology Market Revenue (Million), by Applications 2024 & 2032
- Figure 39: South America Synthetic Biology Market Revenue Share (%), by Applications 2024 & 2032
- Figure 40: South America Synthetic Biology Market Revenue (Million), by Country 2024 & 2032
- Figure 41: South America Synthetic Biology Market Revenue Share (%), by Country 2024 & 2032
List of Tables
- Table 1: Global Synthetic Biology Market Revenue Million Forecast, by Region 2019 & 2032
- Table 2: Global Synthetic Biology Market Revenue Million Forecast, by Product 2019 & 2032
- Table 3: Global Synthetic Biology Market Revenue Million Forecast, by Applications 2019 & 2032
- Table 4: Global Synthetic Biology Market Revenue Million Forecast, by Region 2019 & 2032
- Table 5: Global Synthetic Biology Market Revenue Million Forecast, by Country 2019 & 2032
- Table 6: United States Synthetic Biology Market Revenue (Million) Forecast, by Application 2019 & 2032
- Table 7: Canada Synthetic Biology Market Revenue (Million) Forecast, by Application 2019 & 2032
- Table 8: Mexico Synthetic Biology Market Revenue (Million) Forecast, by Application 2019 & 2032
- Table 9: Global Synthetic Biology Market Revenue Million Forecast, by Country 2019 & 2032
- Table 10: Germany Synthetic Biology Market Revenue (Million) Forecast, by Application 2019 & 2032
- Table 11: United Kingdom Synthetic Biology Market Revenue (Million) Forecast, by Application 2019 & 2032
- Table 12: France Synthetic Biology Market Revenue (Million) Forecast, by Application 2019 & 2032
- Table 13: Italy Synthetic Biology Market Revenue (Million) Forecast, by Application 2019 & 2032
- Table 14: Spain Synthetic Biology Market Revenue (Million) Forecast, by Application 2019 & 2032
- Table 15: Rest of Europe Synthetic Biology Market Revenue (Million) Forecast, by Application 2019 & 2032
- Table 16: Global Synthetic Biology Market Revenue Million Forecast, by Country 2019 & 2032
- Table 17: China Synthetic Biology Market Revenue (Million) Forecast, by Application 2019 & 2032
- Table 18: Japan Synthetic Biology Market Revenue (Million) Forecast, by Application 2019 & 2032
- Table 19: India Synthetic Biology Market Revenue (Million) Forecast, by Application 2019 & 2032
- Table 20: Australia Synthetic Biology Market Revenue (Million) Forecast, by Application 2019 & 2032
- Table 21: South Korea Synthetic Biology Market Revenue (Million) Forecast, by Application 2019 & 2032
- Table 22: Rest of Asia Pacific Synthetic Biology Market Revenue (Million) Forecast, by Application 2019 & 2032
- Table 23: Global Synthetic Biology Market Revenue Million Forecast, by Country 2019 & 2032
- Table 24: GCC Synthetic Biology Market Revenue (Million) Forecast, by Application 2019 & 2032
- Table 25: South Africa Synthetic Biology Market Revenue (Million) Forecast, by Application 2019 & 2032
- Table 26: Rest of Middle East and Africa Synthetic Biology Market Revenue (Million) Forecast, by Application 2019 & 2032
- Table 27: Global Synthetic Biology Market Revenue Million Forecast, by Country 2019 & 2032
- Table 28: Brazil Synthetic Biology Market Revenue (Million) Forecast, by Application 2019 & 2032
- Table 29: Argentina Synthetic Biology Market Revenue (Million) Forecast, by Application 2019 & 2032
- Table 30: Rest of South America Synthetic Biology Market Revenue (Million) Forecast, by Application 2019 & 2032
- Table 31: Global Synthetic Biology Market Revenue Million Forecast, by Product 2019 & 2032
- Table 32: Global Synthetic Biology Market Revenue Million Forecast, by Applications 2019 & 2032
- Table 33: Global Synthetic Biology Market Revenue Million Forecast, by Country 2019 & 2032
- Table 34: United States Synthetic Biology Market Revenue (Million) Forecast, by Application 2019 & 2032
- Table 35: Canada Synthetic Biology Market Revenue (Million) Forecast, by Application 2019 & 2032
- Table 36: Mexico Synthetic Biology Market Revenue (Million) Forecast, by Application 2019 & 2032
- Table 37: Global Synthetic Biology Market Revenue Million Forecast, by Product 2019 & 2032
- Table 38: Global Synthetic Biology Market Revenue Million Forecast, by Applications 2019 & 2032
- Table 39: Global Synthetic Biology Market Revenue Million Forecast, by Country 2019 & 2032
- Table 40: Germany Synthetic Biology Market Revenue (Million) Forecast, by Application 2019 & 2032
- Table 41: United Kingdom Synthetic Biology Market Revenue (Million) Forecast, by Application 2019 & 2032
- Table 42: France Synthetic Biology Market Revenue (Million) Forecast, by Application 2019 & 2032
- Table 43: Italy Synthetic Biology Market Revenue (Million) Forecast, by Application 2019 & 2032
- Table 44: Spain Synthetic Biology Market Revenue (Million) Forecast, by Application 2019 & 2032
- Table 45: Rest of Europe Synthetic Biology Market Revenue (Million) Forecast, by Application 2019 & 2032
- Table 46: Global Synthetic Biology Market Revenue Million Forecast, by Product 2019 & 2032
- Table 47: Global Synthetic Biology Market Revenue Million Forecast, by Applications 2019 & 2032
- Table 48: Global Synthetic Biology Market Revenue Million Forecast, by Country 2019 & 2032
- Table 49: China Synthetic Biology Market Revenue (Million) Forecast, by Application 2019 & 2032
- Table 50: Japan Synthetic Biology Market Revenue (Million) Forecast, by Application 2019 & 2032
- Table 51: India Synthetic Biology Market Revenue (Million) Forecast, by Application 2019 & 2032
- Table 52: Australia Synthetic Biology Market Revenue (Million) Forecast, by Application 2019 & 2032
- Table 53: South Korea Synthetic Biology Market Revenue (Million) Forecast, by Application 2019 & 2032
- Table 54: Rest of Asia Pacific Synthetic Biology Market Revenue (Million) Forecast, by Application 2019 & 2032
- Table 55: Global Synthetic Biology Market Revenue Million Forecast, by Product 2019 & 2032
- Table 56: Global Synthetic Biology Market Revenue Million Forecast, by Applications 2019 & 2032
- Table 57: Global Synthetic Biology Market Revenue Million Forecast, by Country 2019 & 2032
- Table 58: GCC Synthetic Biology Market Revenue (Million) Forecast, by Application 2019 & 2032
- Table 59: South Africa Synthetic Biology Market Revenue (Million) Forecast, by Application 2019 & 2032
- Table 60: Rest of Middle East and Africa Synthetic Biology Market Revenue (Million) Forecast, by Application 2019 & 2032
- Table 61: Global Synthetic Biology Market Revenue Million Forecast, by Product 2019 & 2032
- Table 62: Global Synthetic Biology Market Revenue Million Forecast, by Applications 2019 & 2032
- Table 63: Global Synthetic Biology Market Revenue Million Forecast, by Country 2019 & 2032
- Table 64: Brazil Synthetic Biology Market Revenue (Million) Forecast, by Application 2019 & 2032
- Table 65: Argentina Synthetic Biology Market Revenue (Million) Forecast, by Application 2019 & 2032
- Table 66: Rest of South America Synthetic Biology Market Revenue (Million) Forecast, by Application 2019 & 2032
Frequently Asked Questions
1. What is the projected Compound Annual Growth Rate (CAGR) of the Synthetic Biology Market?
The projected CAGR is approximately 12.88%.
2. Which companies are prominent players in the Synthetic Biology Market?
Key companies in the market include Amyris Inc, Thermo Fisher Scientific Inc, New England Biolabs Inc, Koninklijke DSM NV, Danaher Corporation (Integrated DNA Technologies Inc ), GenScript, Precigen Inc (Intrexon Corporation), Illumina Inc, Viridos Inc (Synthetic Genomics Inc )*List Not Exhaustive, Novozymes AS.
3. What are the main segments of the Synthetic Biology Market?
The market segments include Product, Applications.
4. Can you provide details about the market size?
The market size is estimated to be USD 79.39 Million as of 2022.
5. What are some drivers contributing to market growth?
Increasing Support from Government and Private Institutions; Increasing R&D Investments in Drug Discovery and Development; Declining Cost of DNA Sequencing and Synthesizing.
6. What are the notable trends driving market growth?
The Healthcare Segment is Expected to Witness Significant Growth During the Forecast Period.
7. Are there any restraints impacting market growth?
Bio-safety and Bio-security; Ethical Issues Related to Synthetic Biology; Reimbursement Cuts Causing Pricing Pressure.
8. Can you provide examples of recent developments in the market?
January 2024: Rice University of the United States launched the Rice Synthetic Biology Institute, which aims to catalyze collaborative research in synthetic biology and its translation into technologies that benefit society.
9. What pricing options are available for accessing the report?
Pricing options include single-user, multi-user, and enterprise licenses priced at USD 4750, USD 5250, and USD 8750 respectively.
10. Is the market size provided in terms of value or volume?
The market size is provided in terms of value, measured in Million.
11. Are there any specific market keywords associated with the report?
Yes, the market keyword associated with the report is "Synthetic Biology Market," which aids in identifying and referencing the specific market segment covered.
12. How do I determine which pricing option suits my needs best?
The pricing options vary based on user requirements and access needs. Individual users may opt for single-user licenses, while businesses requiring broader access may choose multi-user or enterprise licenses for cost-effective access to the report.
13. Are there any additional resources or data provided in the Synthetic Biology Market report?
While the report offers comprehensive insights, it's advisable to review the specific contents or supplementary materials provided to ascertain if additional resources or data are available.
14. How can I stay updated on further developments or reports in the Synthetic Biology Market?
To stay informed about further developments, trends, and reports in the Synthetic Biology Market, consider subscribing to industry newsletters, following relevant companies and organizations, or regularly checking reputable industry news sources and publications.
Methodology
Step 1 - Identification of Relevant Samples Size from Population Database


Step 2 - Approaches for Defining Global Market Size (Value, Volume* & Price*)

Note*: In applicable scenarios
Step 3 - Data Sources
Primary Research
- Web Analytics
- Survey Reports
- Research Institute
- Latest Research Reports
- Opinion Leaders
Secondary Research
- Annual Reports
- White Paper
- Latest Press Release
- Industry Association
- Paid Database
- Investor Presentations

Step 4 - Data Triangulation
Involves using different sources of information in order to increase the validity of a study
These sources are likely to be stakeholders in a program - participants, other researchers, program staff, other community members, and so on.
Then we put all data in single framework & apply various statistical tools to find out the dynamic on the market.
During the analysis stage, feedback from the stakeholder groups would be compared to determine areas of agreement as well as areas of divergence


