
Key Insights
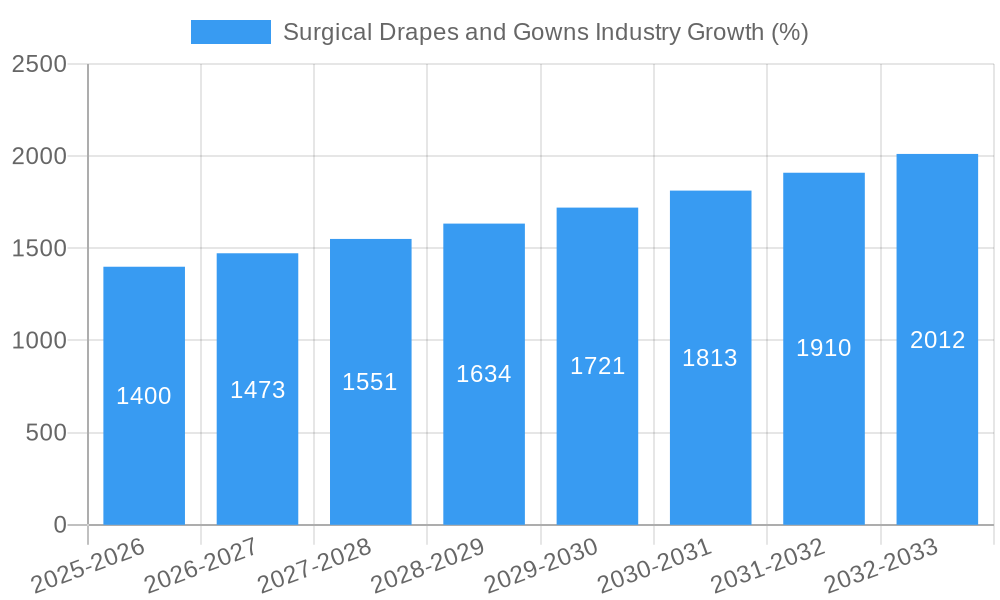
The global surgical drapes and gowns market, valued at approximately $XX billion in 2025, is projected to experience robust growth, exhibiting a compound annual growth rate (CAGR) of 5.60% from 2025 to 2033. This expansion is driven by several key factors. The rising incidence of surgical procedures globally, fueled by an aging population and increasing prevalence of chronic diseases requiring surgical intervention, significantly boosts demand. Furthermore, advancements in surgical techniques and the adoption of minimally invasive surgeries contribute to the market's growth. Stringent infection control regulations and a heightened focus on patient safety within healthcare settings are also compelling factors, driving the adoption of high-quality, disposable surgical drapes and gowns. The market is segmented by usage (disposable and reusable), end-user (hospitals, ambulatory surgical centers, and others), and product type (surgical drapes and surgical gowns). Disposable products currently dominate the market due to their convenience and infection control benefits, while hospitals represent the largest end-user segment due to their high volume of surgical procedures. However, the reusable segment is expected to witness modest growth driven by increasing environmental concerns and cost-effectiveness in certain settings. Geographic growth is expected to be robust across regions like North America and Asia Pacific, driven by factors such as healthcare infrastructure development and increasing disposable incomes.
Competitive dynamics within the surgical drapes and gowns market are characterized by the presence of both established multinational corporations and specialized regional players. Key players like 3M, Thermo Fisher Scientific, and Molnlycke Health Care are leveraging their extensive distribution networks and technological advancements to maintain their market share. However, smaller companies are gaining ground by focusing on niche product offerings and cost-effective solutions. The market is likely to witness increased consolidation through mergers and acquisitions, as companies seek to expand their product portfolios and geographic reach. The ongoing focus on innovation, particularly in materials science and design, will continue to drive product differentiation and enhance the market's overall growth trajectory. Future market growth will likely depend on factors such as regulatory changes, technological innovations, and the overall economic climate within major healthcare markets.

Surgical Drapes and Gowns Market Report: 2019-2033
This comprehensive report provides a detailed analysis of the global surgical drapes and gowns market, encompassing market dynamics, growth trends, competitive landscape, and future outlook. The report covers the period 2019-2033, with a focus on the forecast period 2025-2033 (Base Year: 2025, Estimated Year: 2025). The market is segmented by usage (disposable, reusable), end-user (hospitals, ambulatory surgical centers, others), and product type (surgical drapes, surgical gowns). The total market size is projected to reach xx Billion by 2033.
Surgical Drapes and Gowns Industry Market Dynamics & Structure
The surgical drapes and gowns market is characterized by a moderately concentrated structure, with key players like 3M, Molnlycke Health Care AB, and Cardinal Health holding significant market share. The market is driven by technological innovations focused on improving hygiene, comfort, and performance. Stringent regulatory frameworks, particularly concerning sterilization and biocompatibility, heavily influence market operations. The presence of substitute products, such as alternative barrier materials, poses a competitive challenge. The market is further shaped by end-user demographics, particularly the increasing prevalence of surgical procedures and the growth of ambulatory surgical centers. Mergers and acquisitions (M&A) activity has been relatively moderate in recent years, with xx Billion in deal value recorded between 2019 and 2024.
- Market Concentration: Moderately concentrated, with top 5 players holding approximately xx% market share.
- Technological Innovation: Focus on improved barrier properties, comfort, and eco-friendly materials.
- Regulatory Landscape: Stringent regulations regarding sterilization, biocompatibility, and safety standards.
- Competitive Substitutes: Alternative barrier materials and reusable drape systems pose a competitive challenge.
- End-User Demographics: Growth driven by rising surgical procedures and expansion of ambulatory surgical centers.
- M&A Activity: xx Billion in deal value from 2019-2024, with a focus on expanding product portfolios and geographic reach.
Surgical Drapes and Gowns Industry Growth Trends & Insights
The global surgical drapes and gowns market exhibited a CAGR of xx% during the historical period (2019-2024), driven by factors such as increasing surgical procedures, rising healthcare expenditure, and technological advancements. The market is expected to maintain a steady growth trajectory, with a projected CAGR of xx% during the forecast period (2025-2033), reaching xx Billion by 2033. Disposable drapes and gowns dominate the market, owing to their convenience and infection control benefits. However, increasing focus on sustainability is driving growth in the reusable segment. Technological advancements, such as the incorporation of antimicrobial agents and improved barrier materials, are further enhancing market growth. Shifts in consumer behavior towards increased preference for comfort and improved features are also shaping market trends. Market penetration rates vary significantly across regions, with developed economies showing higher adoption.
Dominant Regions, Countries, or Segments in Surgical Drapes and Gowns Industry
North America currently holds the largest market share in the surgical drapes and gowns industry, driven by high healthcare expenditure, advanced healthcare infrastructure, and a large number of surgical procedures. However, the Asia-Pacific region is projected to experience the highest growth rate during the forecast period, fueled by rising healthcare awareness, expanding healthcare infrastructure, and a growing aging population. Within the product segments, disposable surgical drapes and gowns dominate the market due to their convenience and infection prevention properties. The hospital segment accounts for the largest share of end-user consumption.
- North America: High healthcare expenditure, advanced infrastructure, and large number of surgical procedures.
- Asia-Pacific: Rapid growth driven by rising healthcare awareness, expanding infrastructure, and an aging population.
- Europe: Mature market with steady growth, influenced by government regulations and healthcare policies.
- Disposable Drapes & Gowns: Dominates the market due to convenience and infection control advantages.
- Hospitals: Largest end-user segment due to high volume of surgical procedures.
Surgical Drapes and Gowns Industry Product Landscape
The surgical drapes and gowns market offers a diverse range of products tailored to specific surgical procedures and user preferences. Recent innovations include the incorporation of antimicrobial agents, improved barrier materials, and enhanced comfort features such as soft knit cuffs and adjustable closures (as seen in Invenio's V90 series). Manufacturers are increasingly focusing on developing eco-friendly and sustainable products. Key performance indicators include barrier efficacy, fluid resistance, and drape integrity. Unique selling propositions often focus on enhanced comfort, reduced infection risk, and superior performance characteristics.
Key Drivers, Barriers & Challenges in Surgical Drapes and Gowns Industry
Key Drivers: Rising prevalence of surgical procedures, increasing healthcare expenditure, technological advancements in material science and manufacturing processes, stringent infection control protocols, and growing demand for disposable products.
Key Challenges: Fluctuations in raw material prices, intense competition among manufacturers, stringent regulatory approvals, and supply chain disruptions. These factors can negatively impact profitability and market growth. For instance, increased raw material costs could lead to price increases and reduced margins, while supply chain disruptions can cause delays in production and delivery.
Emerging Opportunities in Surgical Drapes and Gowns Industry
Untapped markets in developing economies, increasing demand for specialized drapes and gowns for specific procedures (e.g., minimally invasive surgery), growing preference for eco-friendly and sustainable products, and opportunities for developing innovative product designs and features are all significant emerging opportunities. Furthermore, the integration of smart technologies and data analytics offers potential for improved inventory management and surgical workflow optimization.
Growth Accelerators in the Surgical Drapes and Gowns Industry Industry
Technological breakthroughs in material science (e.g., development of advanced barrier materials), strategic partnerships between manufacturers and healthcare providers, market expansion into emerging economies, and the introduction of innovative product features (such as improved drape designs and antimicrobial properties) are significant drivers of long-term growth in this industry.
Key Players Shaping the Surgical Drapes and Gowns Industry Market
- Sterisets International BV
- Medica Europe BV
- 3M
- Thermo Fisher Scientific Inc
- Molnlycke Health Care AB
- Sterimed Group
- Amaryllis Healthcare Private Limited
- Owens & Minor (Halyard)
- Cardinal Health
- Rhysley Limited
- Alpha Pro Tech
- Surgeine Healthcare
- Medline Industries Inc
Notable Milestones in Surgical Drapes and Gowns Industry Sector
- March 2022: Invenio launched the V90 surgical gown series, featuring sonic welding, soft knit cuffs, and adjustable closures. This launch expands product options and improves comfort and performance.
- December 2021: Barameda secured a supply contract with Riga Eastern Clinical University Hospital in Latvia, signifying market expansion and increased demand.
In-Depth Surgical Drapes and Gowns Industry Market Outlook
The surgical drapes and gowns market is poised for continued growth, driven by several factors including advancements in material science, increasing adoption of minimally invasive surgical procedures, and expanding healthcare infrastructure globally. Strategic partnerships, focus on sustainability, and product innovation will be crucial for companies to maintain a competitive edge and capitalize on future market opportunities. The market's potential is significant, with untapped markets in developing countries and ongoing innovation providing substantial growth opportunities.
Surgical Drapes and Gowns Industry Segmentation
-
1. Product Type
-
1.1. Surgical Drapes
- 1.1.1. Orthopaedic Drapes
- 1.1.2. Obstetrics and Gynaecology Drapes
- 1.1.3. Urology Drapes
- 1.1.4. Cardiovascular Drapes
- 1.1.5. Others
- 1.2. Surgical Gowns
-
1.1. Surgical Drapes
-
2. Usage
- 2.1. Disposable
- 2.2. Reusable
-
3. End-User
- 3.1. Hospitals
- 3.2. Ambulatory Surgical Centers
- 3.3. Others
Surgical Drapes and Gowns Industry Segmentation By Geography
-
1. North America
- 1.1. United States
- 1.2. Canada
- 1.3. Mexico
-
2. Europe
- 2.1. Germany
- 2.2. United Kingdom
- 2.3. France
- 2.4. Italy
- 2.5. Spain
- 2.6. Rest of Europe
-
3. Asia Pacific
- 3.1. China
- 3.2. Japan
- 3.3. India
- 3.4. Australia
- 3.5. South Korea
- 3.6. Rest of Asia Pacific
-
4. Middle East and Africa
- 4.1. GCC
- 4.2. South Africa
- 4.3. Rest of Middle East and Africa
-
5. South America
- 5.1. Brazil
- 5.2. Argentina
- 5.3. Rest of South America

Surgical Drapes and Gowns Industry REPORT HIGHLIGHTS
| Aspects | Details |
|---|---|
| Study Period | 2019-2033 |
| Base Year | 2024 |
| Estimated Year | 2025 |
| Forecast Period | 2025-2033 |
| Historical Period | 2019-2024 |
| Growth Rate | CAGR of 5.60% from 2019-2033 |
| Segmentation |
|
Table of Contents
- 1. Introduction
- 1.1. Research Scope
- 1.2. Market Segmentation
- 1.3. Research Methodology
- 1.4. Definitions and Assumptions
- 2. Executive Summary
- 2.1. Introduction
- 3. Market Dynamics
- 3.1. Introduction
- 3.2. Market Drivers
- 3.2.1. Growing Number of Surgeries; Increasing Prevalence of Chronic Diseases Coupled with Growing Geriatric Population
- 3.3. Market Restrains
- 3.3.1. Infections due to the Usage of Reusable Gowns and Drapes
- 3.4. Market Trends
- 3.4.1. Surgical Gowns Segment Holds Significant Share in Surgical Drapes and Gowns Market
- 4. Market Factor Analysis
- 4.1. Porters Five Forces
- 4.2. Supply/Value Chain
- 4.3. PESTEL analysis
- 4.4. Market Entropy
- 4.5. Patent/Trademark Analysis
- 5. Global Surgical Drapes and Gowns Industry Analysis, Insights and Forecast, 2019-2031
- 5.1. Market Analysis, Insights and Forecast - by Product Type
- 5.1.1. Surgical Drapes
- 5.1.1.1. Orthopaedic Drapes
- 5.1.1.2. Obstetrics and Gynaecology Drapes
- 5.1.1.3. Urology Drapes
- 5.1.1.4. Cardiovascular Drapes
- 5.1.1.5. Others
- 5.1.2. Surgical Gowns
- 5.1.1. Surgical Drapes
- 5.2. Market Analysis, Insights and Forecast - by Usage
- 5.2.1. Disposable
- 5.2.2. Reusable
- 5.3. Market Analysis, Insights and Forecast - by End-User
- 5.3.1. Hospitals
- 5.3.2. Ambulatory Surgical Centers
- 5.3.3. Others
- 5.4. Market Analysis, Insights and Forecast - by Region
- 5.4.1. North America
- 5.4.2. Europe
- 5.4.3. Asia Pacific
- 5.4.4. Middle East and Africa
- 5.4.5. South America
- 5.1. Market Analysis, Insights and Forecast - by Product Type
- 6. North America Surgical Drapes and Gowns Industry Analysis, Insights and Forecast, 2019-2031
- 6.1. Market Analysis, Insights and Forecast - by Product Type
- 6.1.1. Surgical Drapes
- 6.1.1.1. Orthopaedic Drapes
- 6.1.1.2. Obstetrics and Gynaecology Drapes
- 6.1.1.3. Urology Drapes
- 6.1.1.4. Cardiovascular Drapes
- 6.1.1.5. Others
- 6.1.2. Surgical Gowns
- 6.1.1. Surgical Drapes
- 6.2. Market Analysis, Insights and Forecast - by Usage
- 6.2.1. Disposable
- 6.2.2. Reusable
- 6.3. Market Analysis, Insights and Forecast - by End-User
- 6.3.1. Hospitals
- 6.3.2. Ambulatory Surgical Centers
- 6.3.3. Others
- 6.1. Market Analysis, Insights and Forecast - by Product Type
- 7. Europe Surgical Drapes and Gowns Industry Analysis, Insights and Forecast, 2019-2031
- 7.1. Market Analysis, Insights and Forecast - by Product Type
- 7.1.1. Surgical Drapes
- 7.1.1.1. Orthopaedic Drapes
- 7.1.1.2. Obstetrics and Gynaecology Drapes
- 7.1.1.3. Urology Drapes
- 7.1.1.4. Cardiovascular Drapes
- 7.1.1.5. Others
- 7.1.2. Surgical Gowns
- 7.1.1. Surgical Drapes
- 7.2. Market Analysis, Insights and Forecast - by Usage
- 7.2.1. Disposable
- 7.2.2. Reusable
- 7.3. Market Analysis, Insights and Forecast - by End-User
- 7.3.1. Hospitals
- 7.3.2. Ambulatory Surgical Centers
- 7.3.3. Others
- 7.1. Market Analysis, Insights and Forecast - by Product Type
- 8. Asia Pacific Surgical Drapes and Gowns Industry Analysis, Insights and Forecast, 2019-2031
- 8.1. Market Analysis, Insights and Forecast - by Product Type
- 8.1.1. Surgical Drapes
- 8.1.1.1. Orthopaedic Drapes
- 8.1.1.2. Obstetrics and Gynaecology Drapes
- 8.1.1.3. Urology Drapes
- 8.1.1.4. Cardiovascular Drapes
- 8.1.1.5. Others
- 8.1.2. Surgical Gowns
- 8.1.1. Surgical Drapes
- 8.2. Market Analysis, Insights and Forecast - by Usage
- 8.2.1. Disposable
- 8.2.2. Reusable
- 8.3. Market Analysis, Insights and Forecast - by End-User
- 8.3.1. Hospitals
- 8.3.2. Ambulatory Surgical Centers
- 8.3.3. Others
- 8.1. Market Analysis, Insights and Forecast - by Product Type
- 9. Middle East and Africa Surgical Drapes and Gowns Industry Analysis, Insights and Forecast, 2019-2031
- 9.1. Market Analysis, Insights and Forecast - by Product Type
- 9.1.1. Surgical Drapes
- 9.1.1.1. Orthopaedic Drapes
- 9.1.1.2. Obstetrics and Gynaecology Drapes
- 9.1.1.3. Urology Drapes
- 9.1.1.4. Cardiovascular Drapes
- 9.1.1.5. Others
- 9.1.2. Surgical Gowns
- 9.1.1. Surgical Drapes
- 9.2. Market Analysis, Insights and Forecast - by Usage
- 9.2.1. Disposable
- 9.2.2. Reusable
- 9.3. Market Analysis, Insights and Forecast - by End-User
- 9.3.1. Hospitals
- 9.3.2. Ambulatory Surgical Centers
- 9.3.3. Others
- 9.1. Market Analysis, Insights and Forecast - by Product Type
- 10. South America Surgical Drapes and Gowns Industry Analysis, Insights and Forecast, 2019-2031
- 10.1. Market Analysis, Insights and Forecast - by Product Type
- 10.1.1. Surgical Drapes
- 10.1.1.1. Orthopaedic Drapes
- 10.1.1.2. Obstetrics and Gynaecology Drapes
- 10.1.1.3. Urology Drapes
- 10.1.1.4. Cardiovascular Drapes
- 10.1.1.5. Others
- 10.1.2. Surgical Gowns
- 10.1.1. Surgical Drapes
- 10.2. Market Analysis, Insights and Forecast - by Usage
- 10.2.1. Disposable
- 10.2.2. Reusable
- 10.3. Market Analysis, Insights and Forecast - by End-User
- 10.3.1. Hospitals
- 10.3.2. Ambulatory Surgical Centers
- 10.3.3. Others
- 10.1. Market Analysis, Insights and Forecast - by Product Type
- 11. North Americ Surgical Drapes and Gowns Industry Analysis, Insights and Forecast, 2019-2031
- 11.1. Market Analysis, Insights and Forecast - By Country/Sub-region
- 11.1.1 United States
- 11.1.2 Canada
- 11.1.3 Mexico
- 12. South America Surgical Drapes and Gowns Industry Analysis, Insights and Forecast, 2019-2031
- 12.1. Market Analysis, Insights and Forecast - By Country/Sub-region
- 12.1.1 Brazil
- 12.1.2 Mexico
- 12.1.3 Rest of South America
- 13. Europe Surgical Drapes and Gowns Industry Analysis, Insights and Forecast, 2019-2031
- 13.1. Market Analysis, Insights and Forecast - By Country/Sub-region
- 13.1.1 Germany
- 13.1.2 United Kingdom
- 13.1.3 France
- 13.1.4 Italy
- 13.1.5 Spain
- 13.1.6 Rest of Europe
- 14. Asia Pacific Surgical Drapes and Gowns Industry Analysis, Insights and Forecast, 2019-2031
- 14.1. Market Analysis, Insights and Forecast - By Country/Sub-region
- 14.1.1 China
- 14.1.2 Japan
- 14.1.3 India
- 14.1.4 South Korea
- 14.1.5 Taiwan
- 14.1.6 Australia
- 14.1.7 Rest of Asia-Pacific
- 15. MEA Surgical Drapes and Gowns Industry Analysis, Insights and Forecast, 2019-2031
- 15.1. Market Analysis, Insights and Forecast - By Country/Sub-region
- 15.1.1 Middle East
- 15.1.2 Africa
- 16. Competitive Analysis
- 16.1. Global Market Share Analysis 2024
- 16.2. Company Profiles
- 16.2.1 Sterisets International BV
- 16.2.1.1. Overview
- 16.2.1.2. Products
- 16.2.1.3. SWOT Analysis
- 16.2.1.4. Recent Developments
- 16.2.1.5. Financials (Based on Availability)
- 16.2.2 Medica Europe BV
- 16.2.2.1. Overview
- 16.2.2.2. Products
- 16.2.2.3. SWOT Analysis
- 16.2.2.4. Recent Developments
- 16.2.2.5. Financials (Based on Availability)
- 16.2.3 3M
- 16.2.3.1. Overview
- 16.2.3.2. Products
- 16.2.3.3. SWOT Analysis
- 16.2.3.4. Recent Developments
- 16.2.3.5. Financials (Based on Availability)
- 16.2.4 Thermo Fisher Scientific Inc
- 16.2.4.1. Overview
- 16.2.4.2. Products
- 16.2.4.3. SWOT Analysis
- 16.2.4.4. Recent Developments
- 16.2.4.5. Financials (Based on Availability)
- 16.2.5 Molnlycke Health Care AB
- 16.2.5.1. Overview
- 16.2.5.2. Products
- 16.2.5.3. SWOT Analysis
- 16.2.5.4. Recent Developments
- 16.2.5.5. Financials (Based on Availability)
- 16.2.6 Sterimed Group
- 16.2.6.1. Overview
- 16.2.6.2. Products
- 16.2.6.3. SWOT Analysis
- 16.2.6.4. Recent Developments
- 16.2.6.5. Financials (Based on Availability)
- 16.2.7 Amaryllis Healthcare Private Limited
- 16.2.7.1. Overview
- 16.2.7.2. Products
- 16.2.7.3. SWOT Analysis
- 16.2.7.4. Recent Developments
- 16.2.7.5. Financials (Based on Availability)
- 16.2.8 Owens & Minor (Halyard)
- 16.2.8.1. Overview
- 16.2.8.2. Products
- 16.2.8.3. SWOT Analysis
- 16.2.8.4. Recent Developments
- 16.2.8.5. Financials (Based on Availability)
- 16.2.9 Cardinal Health
- 16.2.9.1. Overview
- 16.2.9.2. Products
- 16.2.9.3. SWOT Analysis
- 16.2.9.4. Recent Developments
- 16.2.9.5. Financials (Based on Availability)
- 16.2.10 Rhysley Limited
- 16.2.10.1. Overview
- 16.2.10.2. Products
- 16.2.10.3. SWOT Analysis
- 16.2.10.4. Recent Developments
- 16.2.10.5. Financials (Based on Availability)
- 16.2.11 Alpha Pro Tech
- 16.2.11.1. Overview
- 16.2.11.2. Products
- 16.2.11.3. SWOT Analysis
- 16.2.11.4. Recent Developments
- 16.2.11.5. Financials (Based on Availability)
- 16.2.12 Surgeine Healthcare
- 16.2.12.1. Overview
- 16.2.12.2. Products
- 16.2.12.3. SWOT Analysis
- 16.2.12.4. Recent Developments
- 16.2.12.5. Financials (Based on Availability)
- 16.2.13 Medline Industries Inc
- 16.2.13.1. Overview
- 16.2.13.2. Products
- 16.2.13.3. SWOT Analysis
- 16.2.13.4. Recent Developments
- 16.2.13.5. Financials (Based on Availability)
- 16.2.1 Sterisets International BV
List of Figures
- Figure 1: Global Surgical Drapes and Gowns Industry Revenue Breakdown (Billion, %) by Region 2024 & 2032
- Figure 2: Global Surgical Drapes and Gowns Industry Volume Breakdown (K Units, %) by Region 2024 & 2032
- Figure 3: North Americ Surgical Drapes and Gowns Industry Revenue (Billion), by Country 2024 & 2032
- Figure 4: North Americ Surgical Drapes and Gowns Industry Volume (K Units), by Country 2024 & 2032
- Figure 5: North Americ Surgical Drapes and Gowns Industry Revenue Share (%), by Country 2024 & 2032
- Figure 6: North Americ Surgical Drapes and Gowns Industry Volume Share (%), by Country 2024 & 2032
- Figure 7: South America Surgical Drapes and Gowns Industry Revenue (Billion), by Country 2024 & 2032
- Figure 8: South America Surgical Drapes and Gowns Industry Volume (K Units), by Country 2024 & 2032
- Figure 9: South America Surgical Drapes and Gowns Industry Revenue Share (%), by Country 2024 & 2032
- Figure 10: South America Surgical Drapes and Gowns Industry Volume Share (%), by Country 2024 & 2032
- Figure 11: Europe Surgical Drapes and Gowns Industry Revenue (Billion), by Country 2024 & 2032
- Figure 12: Europe Surgical Drapes and Gowns Industry Volume (K Units), by Country 2024 & 2032
- Figure 13: Europe Surgical Drapes and Gowns Industry Revenue Share (%), by Country 2024 & 2032
- Figure 14: Europe Surgical Drapes and Gowns Industry Volume Share (%), by Country 2024 & 2032
- Figure 15: Asia Pacific Surgical Drapes and Gowns Industry Revenue (Billion), by Country 2024 & 2032
- Figure 16: Asia Pacific Surgical Drapes and Gowns Industry Volume (K Units), by Country 2024 & 2032
- Figure 17: Asia Pacific Surgical Drapes and Gowns Industry Revenue Share (%), by Country 2024 & 2032
- Figure 18: Asia Pacific Surgical Drapes and Gowns Industry Volume Share (%), by Country 2024 & 2032
- Figure 19: MEA Surgical Drapes and Gowns Industry Revenue (Billion), by Country 2024 & 2032
- Figure 20: MEA Surgical Drapes and Gowns Industry Volume (K Units), by Country 2024 & 2032
- Figure 21: MEA Surgical Drapes and Gowns Industry Revenue Share (%), by Country 2024 & 2032
- Figure 22: MEA Surgical Drapes and Gowns Industry Volume Share (%), by Country 2024 & 2032
- Figure 23: North America Surgical Drapes and Gowns Industry Revenue (Billion), by Product Type 2024 & 2032
- Figure 24: North America Surgical Drapes and Gowns Industry Volume (K Units), by Product Type 2024 & 2032
- Figure 25: North America Surgical Drapes and Gowns Industry Revenue Share (%), by Product Type 2024 & 2032
- Figure 26: North America Surgical Drapes and Gowns Industry Volume Share (%), by Product Type 2024 & 2032
- Figure 27: North America Surgical Drapes and Gowns Industry Revenue (Billion), by Usage 2024 & 2032
- Figure 28: North America Surgical Drapes and Gowns Industry Volume (K Units), by Usage 2024 & 2032
- Figure 29: North America Surgical Drapes and Gowns Industry Revenue Share (%), by Usage 2024 & 2032
- Figure 30: North America Surgical Drapes and Gowns Industry Volume Share (%), by Usage 2024 & 2032
- Figure 31: North America Surgical Drapes and Gowns Industry Revenue (Billion), by End-User 2024 & 2032
- Figure 32: North America Surgical Drapes and Gowns Industry Volume (K Units), by End-User 2024 & 2032
- Figure 33: North America Surgical Drapes and Gowns Industry Revenue Share (%), by End-User 2024 & 2032
- Figure 34: North America Surgical Drapes and Gowns Industry Volume Share (%), by End-User 2024 & 2032
- Figure 35: North America Surgical Drapes and Gowns Industry Revenue (Billion), by Country 2024 & 2032
- Figure 36: North America Surgical Drapes and Gowns Industry Volume (K Units), by Country 2024 & 2032
- Figure 37: North America Surgical Drapes and Gowns Industry Revenue Share (%), by Country 2024 & 2032
- Figure 38: North America Surgical Drapes and Gowns Industry Volume Share (%), by Country 2024 & 2032
- Figure 39: Europe Surgical Drapes and Gowns Industry Revenue (Billion), by Product Type 2024 & 2032
- Figure 40: Europe Surgical Drapes and Gowns Industry Volume (K Units), by Product Type 2024 & 2032
- Figure 41: Europe Surgical Drapes and Gowns Industry Revenue Share (%), by Product Type 2024 & 2032
- Figure 42: Europe Surgical Drapes and Gowns Industry Volume Share (%), by Product Type 2024 & 2032
- Figure 43: Europe Surgical Drapes and Gowns Industry Revenue (Billion), by Usage 2024 & 2032
- Figure 44: Europe Surgical Drapes and Gowns Industry Volume (K Units), by Usage 2024 & 2032
- Figure 45: Europe Surgical Drapes and Gowns Industry Revenue Share (%), by Usage 2024 & 2032
- Figure 46: Europe Surgical Drapes and Gowns Industry Volume Share (%), by Usage 2024 & 2032
- Figure 47: Europe Surgical Drapes and Gowns Industry Revenue (Billion), by End-User 2024 & 2032
- Figure 48: Europe Surgical Drapes and Gowns Industry Volume (K Units), by End-User 2024 & 2032
- Figure 49: Europe Surgical Drapes and Gowns Industry Revenue Share (%), by End-User 2024 & 2032
- Figure 50: Europe Surgical Drapes and Gowns Industry Volume Share (%), by End-User 2024 & 2032
- Figure 51: Europe Surgical Drapes and Gowns Industry Revenue (Billion), by Country 2024 & 2032
- Figure 52: Europe Surgical Drapes and Gowns Industry Volume (K Units), by Country 2024 & 2032
- Figure 53: Europe Surgical Drapes and Gowns Industry Revenue Share (%), by Country 2024 & 2032
- Figure 54: Europe Surgical Drapes and Gowns Industry Volume Share (%), by Country 2024 & 2032
- Figure 55: Asia Pacific Surgical Drapes and Gowns Industry Revenue (Billion), by Product Type 2024 & 2032
- Figure 56: Asia Pacific Surgical Drapes and Gowns Industry Volume (K Units), by Product Type 2024 & 2032
- Figure 57: Asia Pacific Surgical Drapes and Gowns Industry Revenue Share (%), by Product Type 2024 & 2032
- Figure 58: Asia Pacific Surgical Drapes and Gowns Industry Volume Share (%), by Product Type 2024 & 2032
- Figure 59: Asia Pacific Surgical Drapes and Gowns Industry Revenue (Billion), by Usage 2024 & 2032
- Figure 60: Asia Pacific Surgical Drapes and Gowns Industry Volume (K Units), by Usage 2024 & 2032
- Figure 61: Asia Pacific Surgical Drapes and Gowns Industry Revenue Share (%), by Usage 2024 & 2032
- Figure 62: Asia Pacific Surgical Drapes and Gowns Industry Volume Share (%), by Usage 2024 & 2032
- Figure 63: Asia Pacific Surgical Drapes and Gowns Industry Revenue (Billion), by End-User 2024 & 2032
- Figure 64: Asia Pacific Surgical Drapes and Gowns Industry Volume (K Units), by End-User 2024 & 2032
- Figure 65: Asia Pacific Surgical Drapes and Gowns Industry Revenue Share (%), by End-User 2024 & 2032
- Figure 66: Asia Pacific Surgical Drapes and Gowns Industry Volume Share (%), by End-User 2024 & 2032
- Figure 67: Asia Pacific Surgical Drapes and Gowns Industry Revenue (Billion), by Country 2024 & 2032
- Figure 68: Asia Pacific Surgical Drapes and Gowns Industry Volume (K Units), by Country 2024 & 2032
- Figure 69: Asia Pacific Surgical Drapes and Gowns Industry Revenue Share (%), by Country 2024 & 2032
- Figure 70: Asia Pacific Surgical Drapes and Gowns Industry Volume Share (%), by Country 2024 & 2032
- Figure 71: Middle East and Africa Surgical Drapes and Gowns Industry Revenue (Billion), by Product Type 2024 & 2032
- Figure 72: Middle East and Africa Surgical Drapes and Gowns Industry Volume (K Units), by Product Type 2024 & 2032
- Figure 73: Middle East and Africa Surgical Drapes and Gowns Industry Revenue Share (%), by Product Type 2024 & 2032
- Figure 74: Middle East and Africa Surgical Drapes and Gowns Industry Volume Share (%), by Product Type 2024 & 2032
- Figure 75: Middle East and Africa Surgical Drapes and Gowns Industry Revenue (Billion), by Usage 2024 & 2032
- Figure 76: Middle East and Africa Surgical Drapes and Gowns Industry Volume (K Units), by Usage 2024 & 2032
- Figure 77: Middle East and Africa Surgical Drapes and Gowns Industry Revenue Share (%), by Usage 2024 & 2032
- Figure 78: Middle East and Africa Surgical Drapes and Gowns Industry Volume Share (%), by Usage 2024 & 2032
- Figure 79: Middle East and Africa Surgical Drapes and Gowns Industry Revenue (Billion), by End-User 2024 & 2032
- Figure 80: Middle East and Africa Surgical Drapes and Gowns Industry Volume (K Units), by End-User 2024 & 2032
- Figure 81: Middle East and Africa Surgical Drapes and Gowns Industry Revenue Share (%), by End-User 2024 & 2032
- Figure 82: Middle East and Africa Surgical Drapes and Gowns Industry Volume Share (%), by End-User 2024 & 2032
- Figure 83: Middle East and Africa Surgical Drapes and Gowns Industry Revenue (Billion), by Country 2024 & 2032
- Figure 84: Middle East and Africa Surgical Drapes and Gowns Industry Volume (K Units), by Country 2024 & 2032
- Figure 85: Middle East and Africa Surgical Drapes and Gowns Industry Revenue Share (%), by Country 2024 & 2032
- Figure 86: Middle East and Africa Surgical Drapes and Gowns Industry Volume Share (%), by Country 2024 & 2032
- Figure 87: South America Surgical Drapes and Gowns Industry Revenue (Billion), by Product Type 2024 & 2032
- Figure 88: South America Surgical Drapes and Gowns Industry Volume (K Units), by Product Type 2024 & 2032
- Figure 89: South America Surgical Drapes and Gowns Industry Revenue Share (%), by Product Type 2024 & 2032
- Figure 90: South America Surgical Drapes and Gowns Industry Volume Share (%), by Product Type 2024 & 2032
- Figure 91: South America Surgical Drapes and Gowns Industry Revenue (Billion), by Usage 2024 & 2032
- Figure 92: South America Surgical Drapes and Gowns Industry Volume (K Units), by Usage 2024 & 2032
- Figure 93: South America Surgical Drapes and Gowns Industry Revenue Share (%), by Usage 2024 & 2032
- Figure 94: South America Surgical Drapes and Gowns Industry Volume Share (%), by Usage 2024 & 2032
- Figure 95: South America Surgical Drapes and Gowns Industry Revenue (Billion), by End-User 2024 & 2032
- Figure 96: South America Surgical Drapes and Gowns Industry Volume (K Units), by End-User 2024 & 2032
- Figure 97: South America Surgical Drapes and Gowns Industry Revenue Share (%), by End-User 2024 & 2032
- Figure 98: South America Surgical Drapes and Gowns Industry Volume Share (%), by End-User 2024 & 2032
- Figure 99: South America Surgical Drapes and Gowns Industry Revenue (Billion), by Country 2024 & 2032
- Figure 100: South America Surgical Drapes and Gowns Industry Volume (K Units), by Country 2024 & 2032
- Figure 101: South America Surgical Drapes and Gowns Industry Revenue Share (%), by Country 2024 & 2032
- Figure 102: South America Surgical Drapes and Gowns Industry Volume Share (%), by Country 2024 & 2032
List of Tables
- Table 1: Global Surgical Drapes and Gowns Industry Revenue Billion Forecast, by Region 2019 & 2032
- Table 2: Global Surgical Drapes and Gowns Industry Volume K Units Forecast, by Region 2019 & 2032
- Table 3: Global Surgical Drapes and Gowns Industry Revenue Billion Forecast, by Product Type 2019 & 2032
- Table 4: Global Surgical Drapes and Gowns Industry Volume K Units Forecast, by Product Type 2019 & 2032
- Table 5: Global Surgical Drapes and Gowns Industry Revenue Billion Forecast, by Usage 2019 & 2032
- Table 6: Global Surgical Drapes and Gowns Industry Volume K Units Forecast, by Usage 2019 & 2032
- Table 7: Global Surgical Drapes and Gowns Industry Revenue Billion Forecast, by End-User 2019 & 2032
- Table 8: Global Surgical Drapes and Gowns Industry Volume K Units Forecast, by End-User 2019 & 2032
- Table 9: Global Surgical Drapes and Gowns Industry Revenue Billion Forecast, by Region 2019 & 2032
- Table 10: Global Surgical Drapes and Gowns Industry Volume K Units Forecast, by Region 2019 & 2032
- Table 11: Global Surgical Drapes and Gowns Industry Revenue Billion Forecast, by Country 2019 & 2032
- Table 12: Global Surgical Drapes and Gowns Industry Volume K Units Forecast, by Country 2019 & 2032
- Table 13: United States Surgical Drapes and Gowns Industry Revenue (Billion) Forecast, by Application 2019 & 2032
- Table 14: United States Surgical Drapes and Gowns Industry Volume (K Units) Forecast, by Application 2019 & 2032
- Table 15: Canada Surgical Drapes and Gowns Industry Revenue (Billion) Forecast, by Application 2019 & 2032
- Table 16: Canada Surgical Drapes and Gowns Industry Volume (K Units) Forecast, by Application 2019 & 2032
- Table 17: Mexico Surgical Drapes and Gowns Industry Revenue (Billion) Forecast, by Application 2019 & 2032
- Table 18: Mexico Surgical Drapes and Gowns Industry Volume (K Units) Forecast, by Application 2019 & 2032
- Table 19: Global Surgical Drapes and Gowns Industry Revenue Billion Forecast, by Country 2019 & 2032
- Table 20: Global Surgical Drapes and Gowns Industry Volume K Units Forecast, by Country 2019 & 2032
- Table 21: Brazil Surgical Drapes and Gowns Industry Revenue (Billion) Forecast, by Application 2019 & 2032
- Table 22: Brazil Surgical Drapes and Gowns Industry Volume (K Units) Forecast, by Application 2019 & 2032
- Table 23: Mexico Surgical Drapes and Gowns Industry Revenue (Billion) Forecast, by Application 2019 & 2032
- Table 24: Mexico Surgical Drapes and Gowns Industry Volume (K Units) Forecast, by Application 2019 & 2032
- Table 25: Rest of South America Surgical Drapes and Gowns Industry Revenue (Billion) Forecast, by Application 2019 & 2032
- Table 26: Rest of South America Surgical Drapes and Gowns Industry Volume (K Units) Forecast, by Application 2019 & 2032
- Table 27: Global Surgical Drapes and Gowns Industry Revenue Billion Forecast, by Country 2019 & 2032
- Table 28: Global Surgical Drapes and Gowns Industry Volume K Units Forecast, by Country 2019 & 2032
- Table 29: Germany Surgical Drapes and Gowns Industry Revenue (Billion) Forecast, by Application 2019 & 2032
- Table 30: Germany Surgical Drapes and Gowns Industry Volume (K Units) Forecast, by Application 2019 & 2032
- Table 31: United Kingdom Surgical Drapes and Gowns Industry Revenue (Billion) Forecast, by Application 2019 & 2032
- Table 32: United Kingdom Surgical Drapes and Gowns Industry Volume (K Units) Forecast, by Application 2019 & 2032
- Table 33: France Surgical Drapes and Gowns Industry Revenue (Billion) Forecast, by Application 2019 & 2032
- Table 34: France Surgical Drapes and Gowns Industry Volume (K Units) Forecast, by Application 2019 & 2032
- Table 35: Italy Surgical Drapes and Gowns Industry Revenue (Billion) Forecast, by Application 2019 & 2032
- Table 36: Italy Surgical Drapes and Gowns Industry Volume (K Units) Forecast, by Application 2019 & 2032
- Table 37: Spain Surgical Drapes and Gowns Industry Revenue (Billion) Forecast, by Application 2019 & 2032
- Table 38: Spain Surgical Drapes and Gowns Industry Volume (K Units) Forecast, by Application 2019 & 2032
- Table 39: Rest of Europe Surgical Drapes and Gowns Industry Revenue (Billion) Forecast, by Application 2019 & 2032
- Table 40: Rest of Europe Surgical Drapes and Gowns Industry Volume (K Units) Forecast, by Application 2019 & 2032
- Table 41: Global Surgical Drapes and Gowns Industry Revenue Billion Forecast, by Country 2019 & 2032
- Table 42: Global Surgical Drapes and Gowns Industry Volume K Units Forecast, by Country 2019 & 2032
- Table 43: China Surgical Drapes and Gowns Industry Revenue (Billion) Forecast, by Application 2019 & 2032
- Table 44: China Surgical Drapes and Gowns Industry Volume (K Units) Forecast, by Application 2019 & 2032
- Table 45: Japan Surgical Drapes and Gowns Industry Revenue (Billion) Forecast, by Application 2019 & 2032
- Table 46: Japan Surgical Drapes and Gowns Industry Volume (K Units) Forecast, by Application 2019 & 2032
- Table 47: India Surgical Drapes and Gowns Industry Revenue (Billion) Forecast, by Application 2019 & 2032
- Table 48: India Surgical Drapes and Gowns Industry Volume (K Units) Forecast, by Application 2019 & 2032
- Table 49: South Korea Surgical Drapes and Gowns Industry Revenue (Billion) Forecast, by Application 2019 & 2032
- Table 50: South Korea Surgical Drapes and Gowns Industry Volume (K Units) Forecast, by Application 2019 & 2032
- Table 51: Taiwan Surgical Drapes and Gowns Industry Revenue (Billion) Forecast, by Application 2019 & 2032
- Table 52: Taiwan Surgical Drapes and Gowns Industry Volume (K Units) Forecast, by Application 2019 & 2032
- Table 53: Australia Surgical Drapes and Gowns Industry Revenue (Billion) Forecast, by Application 2019 & 2032
- Table 54: Australia Surgical Drapes and Gowns Industry Volume (K Units) Forecast, by Application 2019 & 2032
- Table 55: Rest of Asia-Pacific Surgical Drapes and Gowns Industry Revenue (Billion) Forecast, by Application 2019 & 2032
- Table 56: Rest of Asia-Pacific Surgical Drapes and Gowns Industry Volume (K Units) Forecast, by Application 2019 & 2032
- Table 57: Global Surgical Drapes and Gowns Industry Revenue Billion Forecast, by Country 2019 & 2032
- Table 58: Global Surgical Drapes and Gowns Industry Volume K Units Forecast, by Country 2019 & 2032
- Table 59: Middle East Surgical Drapes and Gowns Industry Revenue (Billion) Forecast, by Application 2019 & 2032
- Table 60: Middle East Surgical Drapes and Gowns Industry Volume (K Units) Forecast, by Application 2019 & 2032
- Table 61: Africa Surgical Drapes and Gowns Industry Revenue (Billion) Forecast, by Application 2019 & 2032
- Table 62: Africa Surgical Drapes and Gowns Industry Volume (K Units) Forecast, by Application 2019 & 2032
- Table 63: Global Surgical Drapes and Gowns Industry Revenue Billion Forecast, by Product Type 2019 & 2032
- Table 64: Global Surgical Drapes and Gowns Industry Volume K Units Forecast, by Product Type 2019 & 2032
- Table 65: Global Surgical Drapes and Gowns Industry Revenue Billion Forecast, by Usage 2019 & 2032
- Table 66: Global Surgical Drapes and Gowns Industry Volume K Units Forecast, by Usage 2019 & 2032
- Table 67: Global Surgical Drapes and Gowns Industry Revenue Billion Forecast, by End-User 2019 & 2032
- Table 68: Global Surgical Drapes and Gowns Industry Volume K Units Forecast, by End-User 2019 & 2032
- Table 69: Global Surgical Drapes and Gowns Industry Revenue Billion Forecast, by Country 2019 & 2032
- Table 70: Global Surgical Drapes and Gowns Industry Volume K Units Forecast, by Country 2019 & 2032
- Table 71: United States Surgical Drapes and Gowns Industry Revenue (Billion) Forecast, by Application 2019 & 2032
- Table 72: United States Surgical Drapes and Gowns Industry Volume (K Units) Forecast, by Application 2019 & 2032
- Table 73: Canada Surgical Drapes and Gowns Industry Revenue (Billion) Forecast, by Application 2019 & 2032
- Table 74: Canada Surgical Drapes and Gowns Industry Volume (K Units) Forecast, by Application 2019 & 2032
- Table 75: Mexico Surgical Drapes and Gowns Industry Revenue (Billion) Forecast, by Application 2019 & 2032
- Table 76: Mexico Surgical Drapes and Gowns Industry Volume (K Units) Forecast, by Application 2019 & 2032
- Table 77: Global Surgical Drapes and Gowns Industry Revenue Billion Forecast, by Product Type 2019 & 2032
- Table 78: Global Surgical Drapes and Gowns Industry Volume K Units Forecast, by Product Type 2019 & 2032
- Table 79: Global Surgical Drapes and Gowns Industry Revenue Billion Forecast, by Usage 2019 & 2032
- Table 80: Global Surgical Drapes and Gowns Industry Volume K Units Forecast, by Usage 2019 & 2032
- Table 81: Global Surgical Drapes and Gowns Industry Revenue Billion Forecast, by End-User 2019 & 2032
- Table 82: Global Surgical Drapes and Gowns Industry Volume K Units Forecast, by End-User 2019 & 2032
- Table 83: Global Surgical Drapes and Gowns Industry Revenue Billion Forecast, by Country 2019 & 2032
- Table 84: Global Surgical Drapes and Gowns Industry Volume K Units Forecast, by Country 2019 & 2032
- Table 85: Germany Surgical Drapes and Gowns Industry Revenue (Billion) Forecast, by Application 2019 & 2032
- Table 86: Germany Surgical Drapes and Gowns Industry Volume (K Units) Forecast, by Application 2019 & 2032
- Table 87: United Kingdom Surgical Drapes and Gowns Industry Revenue (Billion) Forecast, by Application 2019 & 2032
- Table 88: United Kingdom Surgical Drapes and Gowns Industry Volume (K Units) Forecast, by Application 2019 & 2032
- Table 89: France Surgical Drapes and Gowns Industry Revenue (Billion) Forecast, by Application 2019 & 2032
- Table 90: France Surgical Drapes and Gowns Industry Volume (K Units) Forecast, by Application 2019 & 2032
- Table 91: Italy Surgical Drapes and Gowns Industry Revenue (Billion) Forecast, by Application 2019 & 2032
- Table 92: Italy Surgical Drapes and Gowns Industry Volume (K Units) Forecast, by Application 2019 & 2032
- Table 93: Spain Surgical Drapes and Gowns Industry Revenue (Billion) Forecast, by Application 2019 & 2032
- Table 94: Spain Surgical Drapes and Gowns Industry Volume (K Units) Forecast, by Application 2019 & 2032
- Table 95: Rest of Europe Surgical Drapes and Gowns Industry Revenue (Billion) Forecast, by Application 2019 & 2032
- Table 96: Rest of Europe Surgical Drapes and Gowns Industry Volume (K Units) Forecast, by Application 2019 & 2032
- Table 97: Global Surgical Drapes and Gowns Industry Revenue Billion Forecast, by Product Type 2019 & 2032
- Table 98: Global Surgical Drapes and Gowns Industry Volume K Units Forecast, by Product Type 2019 & 2032
- Table 99: Global Surgical Drapes and Gowns Industry Revenue Billion Forecast, by Usage 2019 & 2032
- Table 100: Global Surgical Drapes and Gowns Industry Volume K Units Forecast, by Usage 2019 & 2032
- Table 101: Global Surgical Drapes and Gowns Industry Revenue Billion Forecast, by End-User 2019 & 2032
- Table 102: Global Surgical Drapes and Gowns Industry Volume K Units Forecast, by End-User 2019 & 2032
- Table 103: Global Surgical Drapes and Gowns Industry Revenue Billion Forecast, by Country 2019 & 2032
- Table 104: Global Surgical Drapes and Gowns Industry Volume K Units Forecast, by Country 2019 & 2032
- Table 105: China Surgical Drapes and Gowns Industry Revenue (Billion) Forecast, by Application 2019 & 2032
- Table 106: China Surgical Drapes and Gowns Industry Volume (K Units) Forecast, by Application 2019 & 2032
- Table 107: Japan Surgical Drapes and Gowns Industry Revenue (Billion) Forecast, by Application 2019 & 2032
- Table 108: Japan Surgical Drapes and Gowns Industry Volume (K Units) Forecast, by Application 2019 & 2032
- Table 109: India Surgical Drapes and Gowns Industry Revenue (Billion) Forecast, by Application 2019 & 2032
- Table 110: India Surgical Drapes and Gowns Industry Volume (K Units) Forecast, by Application 2019 & 2032
- Table 111: Australia Surgical Drapes and Gowns Industry Revenue (Billion) Forecast, by Application 2019 & 2032
- Table 112: Australia Surgical Drapes and Gowns Industry Volume (K Units) Forecast, by Application 2019 & 2032
- Table 113: South Korea Surgical Drapes and Gowns Industry Revenue (Billion) Forecast, by Application 2019 & 2032
- Table 114: South Korea Surgical Drapes and Gowns Industry Volume (K Units) Forecast, by Application 2019 & 2032
- Table 115: Rest of Asia Pacific Surgical Drapes and Gowns Industry Revenue (Billion) Forecast, by Application 2019 & 2032
- Table 116: Rest of Asia Pacific Surgical Drapes and Gowns Industry Volume (K Units) Forecast, by Application 2019 & 2032
- Table 117: Global Surgical Drapes and Gowns Industry Revenue Billion Forecast, by Product Type 2019 & 2032
- Table 118: Global Surgical Drapes and Gowns Industry Volume K Units Forecast, by Product Type 2019 & 2032
- Table 119: Global Surgical Drapes and Gowns Industry Revenue Billion Forecast, by Usage 2019 & 2032
- Table 120: Global Surgical Drapes and Gowns Industry Volume K Units Forecast, by Usage 2019 & 2032
- Table 121: Global Surgical Drapes and Gowns Industry Revenue Billion Forecast, by End-User 2019 & 2032
- Table 122: Global Surgical Drapes and Gowns Industry Volume K Units Forecast, by End-User 2019 & 2032
- Table 123: Global Surgical Drapes and Gowns Industry Revenue Billion Forecast, by Country 2019 & 2032
- Table 124: Global Surgical Drapes and Gowns Industry Volume K Units Forecast, by Country 2019 & 2032
- Table 125: GCC Surgical Drapes and Gowns Industry Revenue (Billion) Forecast, by Application 2019 & 2032
- Table 126: GCC Surgical Drapes and Gowns Industry Volume (K Units) Forecast, by Application 2019 & 2032
- Table 127: South Africa Surgical Drapes and Gowns Industry Revenue (Billion) Forecast, by Application 2019 & 2032
- Table 128: South Africa Surgical Drapes and Gowns Industry Volume (K Units) Forecast, by Application 2019 & 2032
- Table 129: Rest of Middle East and Africa Surgical Drapes and Gowns Industry Revenue (Billion) Forecast, by Application 2019 & 2032
- Table 130: Rest of Middle East and Africa Surgical Drapes and Gowns Industry Volume (K Units) Forecast, by Application 2019 & 2032
- Table 131: Global Surgical Drapes and Gowns Industry Revenue Billion Forecast, by Product Type 2019 & 2032
- Table 132: Global Surgical Drapes and Gowns Industry Volume K Units Forecast, by Product Type 2019 & 2032
- Table 133: Global Surgical Drapes and Gowns Industry Revenue Billion Forecast, by Usage 2019 & 2032
- Table 134: Global Surgical Drapes and Gowns Industry Volume K Units Forecast, by Usage 2019 & 2032
- Table 135: Global Surgical Drapes and Gowns Industry Revenue Billion Forecast, by End-User 2019 & 2032
- Table 136: Global Surgical Drapes and Gowns Industry Volume K Units Forecast, by End-User 2019 & 2032
- Table 137: Global Surgical Drapes and Gowns Industry Revenue Billion Forecast, by Country 2019 & 2032
- Table 138: Global Surgical Drapes and Gowns Industry Volume K Units Forecast, by Country 2019 & 2032
- Table 139: Brazil Surgical Drapes and Gowns Industry Revenue (Billion) Forecast, by Application 2019 & 2032
- Table 140: Brazil Surgical Drapes and Gowns Industry Volume (K Units) Forecast, by Application 2019 & 2032
- Table 141: Argentina Surgical Drapes and Gowns Industry Revenue (Billion) Forecast, by Application 2019 & 2032
- Table 142: Argentina Surgical Drapes and Gowns Industry Volume (K Units) Forecast, by Application 2019 & 2032
- Table 143: Rest of South America Surgical Drapes and Gowns Industry Revenue (Billion) Forecast, by Application 2019 & 2032
- Table 144: Rest of South America Surgical Drapes and Gowns Industry Volume (K Units) Forecast, by Application 2019 & 2032
Frequently Asked Questions
1. What is the projected Compound Annual Growth Rate (CAGR) of the Surgical Drapes and Gowns Industry?
The projected CAGR is approximately 5.60%.
2. Which companies are prominent players in the Surgical Drapes and Gowns Industry?
Key companies in the market include Sterisets International BV, Medica Europe BV, 3M, Thermo Fisher Scientific Inc, Molnlycke Health Care AB, Sterimed Group, Amaryllis Healthcare Private Limited, Owens & Minor (Halyard), Cardinal Health, Rhysley Limited, Alpha Pro Tech, Surgeine Healthcare, Medline Industries Inc.
3. What are the main segments of the Surgical Drapes and Gowns Industry?
The market segments include Product Type, Usage, End-User.
4. Can you provide details about the market size?
The market size is estimated to be USD XX Billion as of 2022.
5. What are some drivers contributing to market growth?
Growing Number of Surgeries; Increasing Prevalence of Chronic Diseases Coupled with Growing Geriatric Population.
6. What are the notable trends driving market growth?
Surgical Gowns Segment Holds Significant Share in Surgical Drapes and Gowns Market.
7. Are there any restraints impacting market growth?
Infections due to the Usage of Reusable Gowns and Drapes.
8. Can you provide examples of recent developments in the market?
In March 2022, Invenio launched a new series of surgical gowns, namely the V90 surgical gown series. It is feature-rich, incorporating sonic welding throughout, soft knit cuffs, and a generous hook and loop closure for adjustability and full coverage. It offers non-reinforced, fabric, and film-reinforced performance options, allowing the user to select the appropriate gown for the procedure.
9. What pricing options are available for accessing the report?
Pricing options include single-user, multi-user, and enterprise licenses priced at USD 4750, USD 5250, and USD 8750 respectively.
10. Is the market size provided in terms of value or volume?
The market size is provided in terms of value, measured in Billion and volume, measured in K Units.
11. Are there any specific market keywords associated with the report?
Yes, the market keyword associated with the report is "Surgical Drapes and Gowns Industry," which aids in identifying and referencing the specific market segment covered.
12. How do I determine which pricing option suits my needs best?
The pricing options vary based on user requirements and access needs. Individual users may opt for single-user licenses, while businesses requiring broader access may choose multi-user or enterprise licenses for cost-effective access to the report.
13. Are there any additional resources or data provided in the Surgical Drapes and Gowns Industry report?
While the report offers comprehensive insights, it's advisable to review the specific contents or supplementary materials provided to ascertain if additional resources or data are available.
14. How can I stay updated on further developments or reports in the Surgical Drapes and Gowns Industry?
To stay informed about further developments, trends, and reports in the Surgical Drapes and Gowns Industry, consider subscribing to industry newsletters, following relevant companies and organizations, or regularly checking reputable industry news sources and publications.
Methodology
Step 1 - Identification of Relevant Samples Size from Population Database


Step 2 - Approaches for Defining Global Market Size (Value, Volume* & Price*)

Note*: In applicable scenarios
Step 3 - Data Sources
Primary Research
- Web Analytics
- Survey Reports
- Research Institute
- Latest Research Reports
- Opinion Leaders
Secondary Research
- Annual Reports
- White Paper
- Latest Press Release
- Industry Association
- Paid Database
- Investor Presentations

Step 4 - Data Triangulation
Involves using different sources of information in order to increase the validity of a study
These sources are likely to be stakeholders in a program - participants, other researchers, program staff, other community members, and so on.
Then we put all data in single framework & apply various statistical tools to find out the dynamic on the market.
During the analysis stage, feedback from the stakeholder groups would be compared to determine areas of agreement as well as areas of divergence


