Key Insights
The global sports protective equipment market, valued at $325 million in 2025, is projected for significant expansion with a compound annual growth rate (CAGR) of 1.2% from 2025 to 2033. This growth is propelled by increasing sports participation across all levels, from recreational to professional. Heightened awareness of injury prevention and athlete safety is a primary driver, encouraging greater adoption of protective gear. Advances in material science are yielding lighter, more effective, and comfortable equipment. The market is segmented by sports type (e.g., ball, fitness, extreme) and distribution channels (online vs. offline retail). The online segment's rapid expansion is attributed to e-commerce convenience. While North America currently leads, the Asia-Pacific region is anticipated to experience substantial growth, fueled by its expanding population and rising disposable incomes. Challenges include the cost of specialized equipment and the prevalence of counterfeit goods.
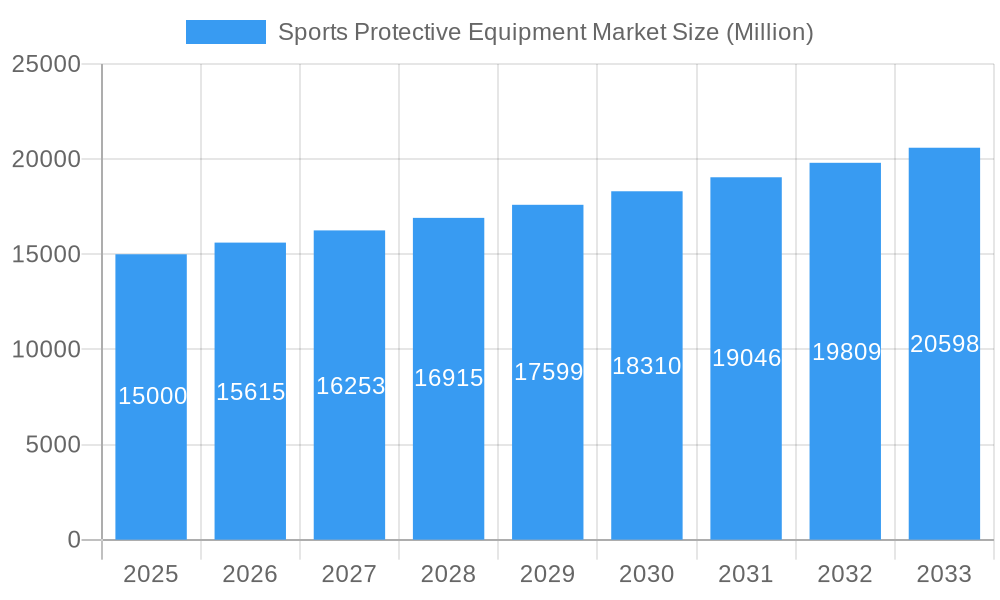
Sports Protective Equipment Market Market Size (In Million)
The competitive environment features major global brands and specialized niche manufacturers. Key strategies for market players include product innovation, strategic alliances, and distribution network expansion. Future growth will be shaped by advancements in materials and design, integration of wearable technology, and a consumer shift towards sustainable products. Customization of protective gear for individual athlete needs is also a growing trend. Regional sporting preferences and regulatory landscapes will influence market dynamics, with a discernible move towards personalized, technologically advanced protective solutions.
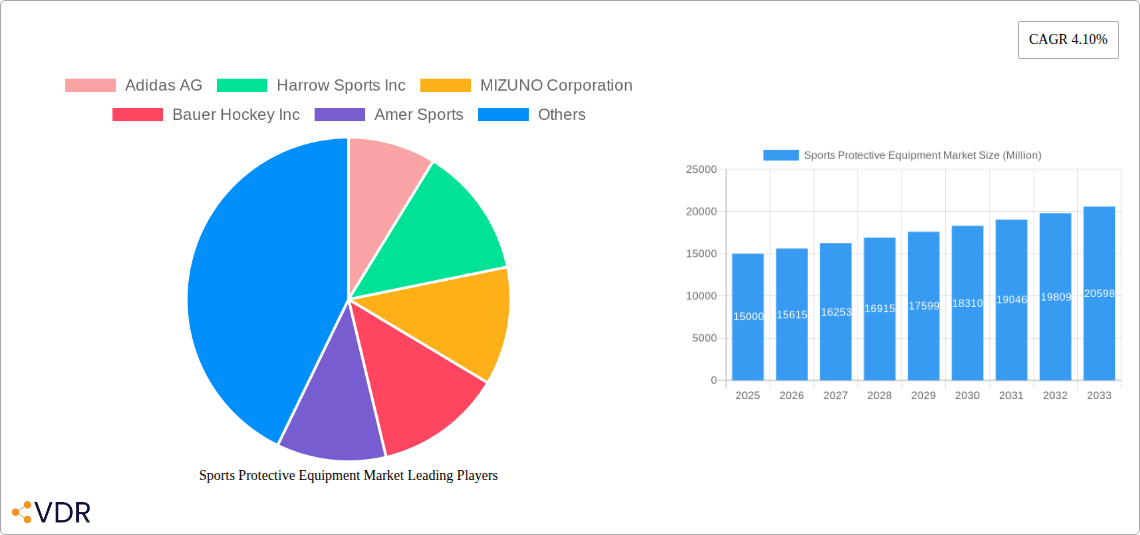
Sports Protective Equipment Market Company Market Share
Sports Protective Equipment Market: A Comprehensive Analysis (2019-2033)
This comprehensive report provides a detailed analysis of the global Sports Protective Equipment market, offering invaluable insights for industry professionals, investors, and strategic decision-makers. With a focus on market dynamics, growth trends, and key players, this report covers the period from 2019 to 2033, providing both historical data and future projections. The market is segmented by type (Ball Sports, Fitness Sports, Extreme Sports, Others) and distribution channel (Offline Retail Stores, Online Retail Stores), offering a granular understanding of this dynamic sector. The total market size is projected to reach xx Million units by 2033.
Sports Protective Equipment Market Market Dynamics & Structure
The Sports Protective Equipment market is characterized by a moderately consolidated structure, with key players such as Adidas AG, Nike Inc, and Under Armour holding significant market share. However, the market also features numerous smaller players, particularly in niche segments like extreme sports equipment. Technological innovation, driven by advancements in materials science and manufacturing processes, plays a crucial role in shaping product features and performance. Stringent safety regulations and standards, varying across different sports and geographies, significantly impact product development and market access. Competitive substitutes, such as alternative protective apparel or less specialized equipment, also influence market dynamics. The end-user demographic is broad, encompassing athletes of all ages and skill levels, across a wide range of sports and activities. Mergers and acquisitions (M&A) activity has been moderate in recent years, with larger players seeking to expand their product portfolios and market reach.
- Market Concentration: Moderately consolidated, with top 5 players holding approximately xx% market share in 2025.
- Technological Innovation: Focus on lightweight, high-performance materials, improved ergonomics, and data-driven design.
- Regulatory Framework: Stringent safety standards impacting product design and certification.
- Competitive Substitutes: Presence of alternative protective solutions influencing market share.
- End-User Demographics: Diverse, spanning various age groups, skill levels, and sports disciplines.
- M&A Trends: Moderate activity, driven by expansion strategies and portfolio diversification. xx M&A deals observed between 2019-2024.
Sports Protective Equipment Market Growth Trends & Insights
The global Sports Protective Equipment market experienced robust growth during the historical period (2019-2024), driven by factors such as rising participation in various sports, increasing health and fitness awareness, and technological advancements enhancing product performance and safety. This positive trend is expected to continue during the forecast period (2025-2033), albeit at a slightly moderated pace due to macroeconomic factors. The market is witnessing a gradual shift towards online retail channels, reflecting evolving consumer preferences and the convenience of e-commerce. Technological disruptions, particularly in materials science and data analytics, are enabling the development of innovative products with enhanced protection and personalized features. Consumer behavior shifts indicate a growing preference for sustainable and ethically sourced products.
- Market Size (Million units): 2019: xx, 2024: xx, 2025: xx, 2033: xx
- CAGR (2025-2033): xx%
- Market Penetration: xx% in 2025, projected to reach xx% by 2033.
- Technological Disruptions: Advancements in materials science and data analytics leading to innovative product designs.
- Consumer Behavior Shifts: Increasing demand for sustainable, ethically sourced products and personalized protection.
Dominant Regions, Countries, or Segments in Sports Protective Equipment Market
North America currently dominates the Sports Protective Equipment market, driven by high sports participation rates, strong consumer spending power, and a well-established sports infrastructure. Within North America, the United States holds the largest market share. Europe follows as a significant regional market, exhibiting strong growth potential fueled by increasing fitness awareness and the popularity of various sports. The Asia-Pacific region displays substantial growth potential, driven by rising disposable incomes, increasing sports participation, particularly in emerging economies, and government initiatives promoting sports development. Within product segments, Ball Sports Protective Equipment currently leads, followed by Fitness Sports Protective Equipment. Online Retail Stores are experiencing rapid growth, outpacing the growth of Offline Retail Stores.
- Leading Region: North America (United States)
- Key Drivers in North America: High sports participation, strong consumer spending, developed sports infrastructure.
- Key Drivers in Europe: Increasing fitness awareness, popularity of diverse sports.
- Key Drivers in Asia-Pacific: Rising disposable incomes, increased sports participation, government initiatives.
- Leading Segment (By Type): Ball Sports Protective Equipment
- Fastest Growing Segment (By Distribution Channel): Online Retail Stores
Sports Protective Equipment Market Product Landscape
The Sports Protective Equipment market showcases a wide array of products designed for various sports and activities. Innovations focus on lightweight, breathable, and durable materials, often incorporating advanced technologies to enhance impact absorption and protection. Key performance metrics include impact resistance, flexibility, ventilation, and comfort. Unique selling propositions often emphasize specialized designs for specific sports or body parts, incorporating advanced features like customizable fit systems and integrated sensors for performance tracking. Technological advancements include the use of advanced foams, carbon fiber composites, and other high-performance materials.
Key Drivers, Barriers & Challenges in Sports Protective Equipment Market
Key Drivers:
The market is driven by the rising participation in various sports and fitness activities globally. Increasing health consciousness and a focus on injury prevention are also key factors. Government initiatives promoting sports development and infrastructure further contribute to the market growth. Technological advancements leading to better protective gear also play a vital role.
Challenges & Restraints:
High manufacturing costs and stringent regulatory compliance can pose challenges. Intense competition from existing players and new entrants can exert pressure on pricing and profitability. Supply chain disruptions can impact the availability of raw materials and finished goods. Fluctuations in raw material prices and economic downturns can also affect market growth. The impact of these factors could decrease projected growth by approximately xx% in the next 5 years.
Emerging Opportunities in Sports Protective Equipment Market
Emerging opportunities lie in the development of specialized protective equipment for niche sports and activities. The increasing demand for sustainable and ethically sourced materials presents a significant opportunity. The integration of smart technologies, such as sensors and data analytics, offers potential for personalized protection and performance monitoring. Expansion into untapped markets in developing economies offers further growth potential.
Growth Accelerators in the Sports Protective Equipment Market Industry
Technological breakthroughs in materials science and manufacturing processes are key growth accelerators. Strategic partnerships and collaborations between equipment manufacturers and sports organizations can drive market expansion. Market expansion strategies targeting emerging economies with rising sports participation rates will be crucial.
Key Players Shaping the Sports Protective Equipment Market Market
- Adidas AG
- Harrow Sports Inc
- MIZUNO Corporation
- Bauer Hockey Inc
- Amer Sports
- Schutt Sports Inc
- Puma SE
- Nike Inc
- Under Armour
Notable Milestones in Sports Protective Equipment Market Sector
- 2020: Introduction of new lightweight helmet technology by Bauer Hockey Inc.
- 2022: Adidas AG launches a sustainable line of protective equipment.
- 2023: Merger between two smaller protective equipment manufacturers.
- 2024: Under Armour unveils advanced impact-absorbing materials in its new football pads.
In-Depth Sports Protective Equipment Market Market Outlook
The Sports Protective Equipment market is poised for continued growth, driven by several factors including increasing sports participation, technological innovation, and evolving consumer preferences. Strategic opportunities exist in developing sustainable and personalized products, expanding into emerging markets, and leveraging technological advancements to enhance product performance and safety. The market's long-term growth potential remains strong, offering significant opportunities for both established players and new entrants.
Sports Protective Equipment Market Segmentation
-
1. Type
- 1.1. Ball Sports Protective Equipment
- 1.2. Fitness Sports Protective Equipment
- 1.3. Extreme Sports Protective Equipment
- 1.4. Others
-
2. Distribution Channel
- 2.1. Offline Retail Stores
- 2.2. Online Retail Stores
Sports Protective Equipment Market Segmentation By Geography
-
1. North America
- 1.1. United States
- 1.2. Canada
- 1.3. Mexico
- 1.4. Rest of North America
-
2. Europe
- 2.1. Spain
- 2.2. United Kingdom
- 2.3. Germany
- 2.4. France
- 2.5. Italy
- 2.6. Russia
- 2.7. Rest of Europe
-
3. Asia Pacific
- 3.1. China
- 3.2. Japan
- 3.3. India
- 3.4. Australia
- 3.5. Rest of Asia Pacific
-
4. South America
- 4.1. Brazil
- 4.2. Argentina
- 4.3. Rest of South America
-
5. Middle East and Africa
- 5.1. South Africa
- 5.2. United Arab Emirates
- 5.3. Rest of Middle East and Africa
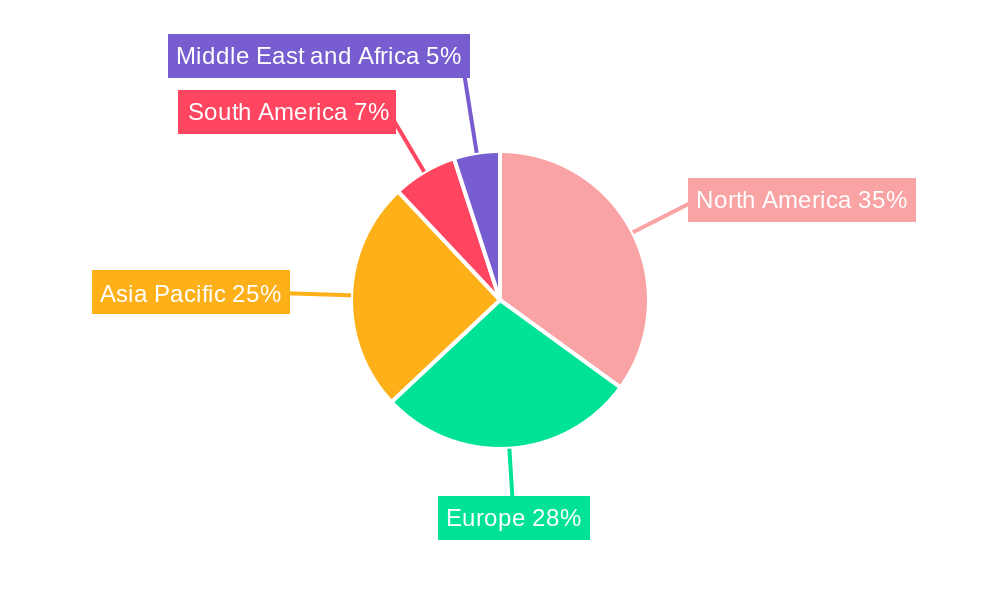
Sports Protective Equipment Market Regional Market Share
Geographic Coverage of Sports Protective Equipment Market
Sports Protective Equipment Market REPORT HIGHLIGHTS
| Aspects | Details |
|---|---|
| Study Period | 2020-2034 |
| Base Year | 2025 |
| Estimated Year | 2026 |
| Forecast Period | 2026-2034 |
| Historical Period | 2020-2025 |
| Growth Rate | CAGR of 1.2% from 2020-2034 |
| Segmentation |
|
Table of Contents
- 1. Introduction
- 1.1. Research Scope
- 1.2. Market Segmentation
- 1.3. Research Objective
- 1.4. Definitions and Assumptions
- 2. Executive Summary
- 2.1. Market Snapshot
- 3. Market Dynamics
- 3.1. Market Drivers
- 3.2. Market Restrains
- 3.3. Market Trends
- 3.4. Market Opportunities
- 4. Market Factor Analysis
- 4.1. Porters Five Forces
- 4.1.1. Bargaining Power of Suppliers
- 4.1.2. Bargaining Power of Buyers
- 4.1.3. Threat of New Entrants
- 4.1.4. Threat of Substitutes
- 4.1.5. Competitive Rivalry
- 4.2. PESTEL analysis
- 4.3. BCG Analysis
- 4.3.1. Stars (High Growth, High Market Share)
- 4.3.2. Cash Cows (Low Growth, High Market Share)
- 4.3.3. Question Mark (High Growth, Low Market Share)
- 4.3.4. Dogs (Low Growth, Low Market Share)
- 4.4. Ansoff Matrix Analysis
- 4.5. Supply Chain Analysis
- 4.6. Regulatory Landscape
- 4.7. Current Market Potential and Opportunity Assessment (TAM–SAM–SOM Framework)
- 4.8. VDR Analyst Note
- 4.1. Porters Five Forces
- 5. Market Analysis, Insights and Forecast 2021-2033
- 5.1. Market Analysis, Insights and Forecast - by Type
- 5.1.1. Ball Sports Protective Equipment
- 5.1.2. Fitness Sports Protective Equipment
- 5.1.3. Extreme Sports Protective Equipment
- 5.1.4. Others
- 5.2. Market Analysis, Insights and Forecast - by Distribution Channel
- 5.2.1. Offline Retail Stores
- 5.2.2. Online Retail Stores
- 5.3. Market Analysis, Insights and Forecast - by Region
- 5.3.1. North America
- 5.3.2. Europe
- 5.3.3. Asia Pacific
- 5.3.4. South America
- 5.3.5. Middle East and Africa
- 5.1. Market Analysis, Insights and Forecast - by Type
- 6. Global Sports Protective Equipment Market Analysis, Insights and Forecast, 2021-2033
- 6.1. Market Analysis, Insights and Forecast - by Type
- 6.1.1. Ball Sports Protective Equipment
- 6.1.2. Fitness Sports Protective Equipment
- 6.1.3. Extreme Sports Protective Equipment
- 6.1.4. Others
- 6.2. Market Analysis, Insights and Forecast - by Distribution Channel
- 6.2.1. Offline Retail Stores
- 6.2.2. Online Retail Stores
- 6.1. Market Analysis, Insights and Forecast - by Type
- 7. North America Sports Protective Equipment Market Analysis, Insights and Forecast, 2021-2033
- 7.1. Market Analysis, Insights and Forecast - by Type
- 7.1.1. Ball Sports Protective Equipment
- 7.1.2. Fitness Sports Protective Equipment
- 7.1.3. Extreme Sports Protective Equipment
- 7.1.4. Others
- 7.2. Market Analysis, Insights and Forecast - by Distribution Channel
- 7.2.1. Offline Retail Stores
- 7.2.2. Online Retail Stores
- 7.1. Market Analysis, Insights and Forecast - by Type
- 8. Europe Sports Protective Equipment Market Analysis, Insights and Forecast, 2021-2033
- 8.1. Market Analysis, Insights and Forecast - by Type
- 8.1.1. Ball Sports Protective Equipment
- 8.1.2. Fitness Sports Protective Equipment
- 8.1.3. Extreme Sports Protective Equipment
- 8.1.4. Others
- 8.2. Market Analysis, Insights and Forecast - by Distribution Channel
- 8.2.1. Offline Retail Stores
- 8.2.2. Online Retail Stores
- 8.1. Market Analysis, Insights and Forecast - by Type
- 9. Asia Pacific Sports Protective Equipment Market Analysis, Insights and Forecast, 2021-2033
- 9.1. Market Analysis, Insights and Forecast - by Type
- 9.1.1. Ball Sports Protective Equipment
- 9.1.2. Fitness Sports Protective Equipment
- 9.1.3. Extreme Sports Protective Equipment
- 9.1.4. Others
- 9.2. Market Analysis, Insights and Forecast - by Distribution Channel
- 9.2.1. Offline Retail Stores
- 9.2.2. Online Retail Stores
- 9.1. Market Analysis, Insights and Forecast - by Type
- 10. South America Sports Protective Equipment Market Analysis, Insights and Forecast, 2021-2033
- 10.1. Market Analysis, Insights and Forecast - by Type
- 10.1.1. Ball Sports Protective Equipment
- 10.1.2. Fitness Sports Protective Equipment
- 10.1.3. Extreme Sports Protective Equipment
- 10.1.4. Others
- 10.2. Market Analysis, Insights and Forecast - by Distribution Channel
- 10.2.1. Offline Retail Stores
- 10.2.2. Online Retail Stores
- 10.1. Market Analysis, Insights and Forecast - by Type
- 11. Middle East and Africa Sports Protective Equipment Market Analysis, Insights and Forecast, 2021-2033
- 11.1. Market Analysis, Insights and Forecast - by Type
- 11.1.1. Ball Sports Protective Equipment
- 11.1.2. Fitness Sports Protective Equipment
- 11.1.3. Extreme Sports Protective Equipment
- 11.1.4. Others
- 11.2. Market Analysis, Insights and Forecast - by Distribution Channel
- 11.2.1. Offline Retail Stores
- 11.2.2. Online Retail Stores
- 11.1. Market Analysis, Insights and Forecast - by Type
- 12. Competitive Analysis
- 12.1. Company Profiles
- 12.1.1 Adidas AG
- 12.1.1.1. Company Overview
- 12.1.1.2. Products
- 12.1.1.3. Company Financials
- 12.1.1.4. SWOT Analysis
- 12.1.2 Harrow Sports Inc
- 12.1.2.1. Company Overview
- 12.1.2.2. Products
- 12.1.2.3. Company Financials
- 12.1.2.4. SWOT Analysis
- 12.1.3 MIZUNO Corporation
- 12.1.3.1. Company Overview
- 12.1.3.2. Products
- 12.1.3.3. Company Financials
- 12.1.3.4. SWOT Analysis
- 12.1.4 Bauer Hockey Inc
- 12.1.4.1. Company Overview
- 12.1.4.2. Products
- 12.1.4.3. Company Financials
- 12.1.4.4. SWOT Analysis
- 12.1.5 Amer Sports
- 12.1.5.1. Company Overview
- 12.1.5.2. Products
- 12.1.5.3. Company Financials
- 12.1.5.4. SWOT Analysis
- 12.1.6 Schutt Sports Inc *List Not Exhaustive
- 12.1.6.1. Company Overview
- 12.1.6.2. Products
- 12.1.6.3. Company Financials
- 12.1.6.4. SWOT Analysis
- 12.1.7 Puma SE
- 12.1.7.1. Company Overview
- 12.1.7.2. Products
- 12.1.7.3. Company Financials
- 12.1.7.4. SWOT Analysis
- 12.1.8 Nike Inc
- 12.1.8.1. Company Overview
- 12.1.8.2. Products
- 12.1.8.3. Company Financials
- 12.1.8.4. SWOT Analysis
- 12.1.9 Under Armour
- 12.1.9.1. Company Overview
- 12.1.9.2. Products
- 12.1.9.3. Company Financials
- 12.1.9.4. SWOT Analysis
- 12.1.1 Adidas AG
- 12.2. Market Entropy
- 12.2.1 Company's Key Areas Served
- 12.2.2 Recent Developments
- 12.3. Company Market Share Analysis 2025
- 12.3.1 Top 5 Companies Market Share Analysis
- 12.3.2 Top 3 Companies Market Share Analysis
- 12.4. List of Potential Customers
- 13. Research Methodology
List of Figures
- Figure 1: Global Sports Protective Equipment Market Revenue Breakdown (million, %) by Region 2025 & 2033
- Figure 2: Global Sports Protective Equipment Market Volume Breakdown (K Units , %) by Region 2025 & 2033
- Figure 3: North America Sports Protective Equipment Market Revenue (million), by Type 2025 & 2033
- Figure 4: North America Sports Protective Equipment Market Volume (K Units ), by Type 2025 & 2033
- Figure 5: North America Sports Protective Equipment Market Revenue Share (%), by Type 2025 & 2033
- Figure 6: North America Sports Protective Equipment Market Volume Share (%), by Type 2025 & 2033
- Figure 7: North America Sports Protective Equipment Market Revenue (million), by Distribution Channel 2025 & 2033
- Figure 8: North America Sports Protective Equipment Market Volume (K Units ), by Distribution Channel 2025 & 2033
- Figure 9: North America Sports Protective Equipment Market Revenue Share (%), by Distribution Channel 2025 & 2033
- Figure 10: North America Sports Protective Equipment Market Volume Share (%), by Distribution Channel 2025 & 2033
- Figure 11: North America Sports Protective Equipment Market Revenue (million), by Country 2025 & 2033
- Figure 12: North America Sports Protective Equipment Market Volume (K Units ), by Country 2025 & 2033
- Figure 13: North America Sports Protective Equipment Market Revenue Share (%), by Country 2025 & 2033
- Figure 14: North America Sports Protective Equipment Market Volume Share (%), by Country 2025 & 2033
- Figure 15: Europe Sports Protective Equipment Market Revenue (million), by Type 2025 & 2033
- Figure 16: Europe Sports Protective Equipment Market Volume (K Units ), by Type 2025 & 2033
- Figure 17: Europe Sports Protective Equipment Market Revenue Share (%), by Type 2025 & 2033
- Figure 18: Europe Sports Protective Equipment Market Volume Share (%), by Type 2025 & 2033
- Figure 19: Europe Sports Protective Equipment Market Revenue (million), by Distribution Channel 2025 & 2033
- Figure 20: Europe Sports Protective Equipment Market Volume (K Units ), by Distribution Channel 2025 & 2033
- Figure 21: Europe Sports Protective Equipment Market Revenue Share (%), by Distribution Channel 2025 & 2033
- Figure 22: Europe Sports Protective Equipment Market Volume Share (%), by Distribution Channel 2025 & 2033
- Figure 23: Europe Sports Protective Equipment Market Revenue (million), by Country 2025 & 2033
- Figure 24: Europe Sports Protective Equipment Market Volume (K Units ), by Country 2025 & 2033
- Figure 25: Europe Sports Protective Equipment Market Revenue Share (%), by Country 2025 & 2033
- Figure 26: Europe Sports Protective Equipment Market Volume Share (%), by Country 2025 & 2033
- Figure 27: Asia Pacific Sports Protective Equipment Market Revenue (million), by Type 2025 & 2033
- Figure 28: Asia Pacific Sports Protective Equipment Market Volume (K Units ), by Type 2025 & 2033
- Figure 29: Asia Pacific Sports Protective Equipment Market Revenue Share (%), by Type 2025 & 2033
- Figure 30: Asia Pacific Sports Protective Equipment Market Volume Share (%), by Type 2025 & 2033
- Figure 31: Asia Pacific Sports Protective Equipment Market Revenue (million), by Distribution Channel 2025 & 2033
- Figure 32: Asia Pacific Sports Protective Equipment Market Volume (K Units ), by Distribution Channel 2025 & 2033
- Figure 33: Asia Pacific Sports Protective Equipment Market Revenue Share (%), by Distribution Channel 2025 & 2033
- Figure 34: Asia Pacific Sports Protective Equipment Market Volume Share (%), by Distribution Channel 2025 & 2033
- Figure 35: Asia Pacific Sports Protective Equipment Market Revenue (million), by Country 2025 & 2033
- Figure 36: Asia Pacific Sports Protective Equipment Market Volume (K Units ), by Country 2025 & 2033
- Figure 37: Asia Pacific Sports Protective Equipment Market Revenue Share (%), by Country 2025 & 2033
- Figure 38: Asia Pacific Sports Protective Equipment Market Volume Share (%), by Country 2025 & 2033
- Figure 39: South America Sports Protective Equipment Market Revenue (million), by Type 2025 & 2033
- Figure 40: South America Sports Protective Equipment Market Volume (K Units ), by Type 2025 & 2033
- Figure 41: South America Sports Protective Equipment Market Revenue Share (%), by Type 2025 & 2033
- Figure 42: South America Sports Protective Equipment Market Volume Share (%), by Type 2025 & 2033
- Figure 43: South America Sports Protective Equipment Market Revenue (million), by Distribution Channel 2025 & 2033
- Figure 44: South America Sports Protective Equipment Market Volume (K Units ), by Distribution Channel 2025 & 2033
- Figure 45: South America Sports Protective Equipment Market Revenue Share (%), by Distribution Channel 2025 & 2033
- Figure 46: South America Sports Protective Equipment Market Volume Share (%), by Distribution Channel 2025 & 2033
- Figure 47: South America Sports Protective Equipment Market Revenue (million), by Country 2025 & 2033
- Figure 48: South America Sports Protective Equipment Market Volume (K Units ), by Country 2025 & 2033
- Figure 49: South America Sports Protective Equipment Market Revenue Share (%), by Country 2025 & 2033
- Figure 50: South America Sports Protective Equipment Market Volume Share (%), by Country 2025 & 2033
- Figure 51: Middle East and Africa Sports Protective Equipment Market Revenue (million), by Type 2025 & 2033
- Figure 52: Middle East and Africa Sports Protective Equipment Market Volume (K Units ), by Type 2025 & 2033
- Figure 53: Middle East and Africa Sports Protective Equipment Market Revenue Share (%), by Type 2025 & 2033
- Figure 54: Middle East and Africa Sports Protective Equipment Market Volume Share (%), by Type 2025 & 2033
- Figure 55: Middle East and Africa Sports Protective Equipment Market Revenue (million), by Distribution Channel 2025 & 2033
- Figure 56: Middle East and Africa Sports Protective Equipment Market Volume (K Units ), by Distribution Channel 2025 & 2033
- Figure 57: Middle East and Africa Sports Protective Equipment Market Revenue Share (%), by Distribution Channel 2025 & 2033
- Figure 58: Middle East and Africa Sports Protective Equipment Market Volume Share (%), by Distribution Channel 2025 & 2033
- Figure 59: Middle East and Africa Sports Protective Equipment Market Revenue (million), by Country 2025 & 2033
- Figure 60: Middle East and Africa Sports Protective Equipment Market Volume (K Units ), by Country 2025 & 2033
- Figure 61: Middle East and Africa Sports Protective Equipment Market Revenue Share (%), by Country 2025 & 2033
- Figure 62: Middle East and Africa Sports Protective Equipment Market Volume Share (%), by Country 2025 & 2033
List of Tables
- Table 1: Global Sports Protective Equipment Market Revenue million Forecast, by Type 2020 & 2033
- Table 2: Global Sports Protective Equipment Market Volume K Units Forecast, by Type 2020 & 2033
- Table 3: Global Sports Protective Equipment Market Revenue million Forecast, by Distribution Channel 2020 & 2033
- Table 4: Global Sports Protective Equipment Market Volume K Units Forecast, by Distribution Channel 2020 & 2033
- Table 5: Global Sports Protective Equipment Market Revenue million Forecast, by Region 2020 & 2033
- Table 6: Global Sports Protective Equipment Market Volume K Units Forecast, by Region 2020 & 2033
- Table 7: Global Sports Protective Equipment Market Revenue million Forecast, by Type 2020 & 2033
- Table 8: Global Sports Protective Equipment Market Volume K Units Forecast, by Type 2020 & 2033
- Table 9: Global Sports Protective Equipment Market Revenue million Forecast, by Distribution Channel 2020 & 2033
- Table 10: Global Sports Protective Equipment Market Volume K Units Forecast, by Distribution Channel 2020 & 2033
- Table 11: Global Sports Protective Equipment Market Revenue million Forecast, by Country 2020 & 2033
- Table 12: Global Sports Protective Equipment Market Volume K Units Forecast, by Country 2020 & 2033
- Table 13: United States Sports Protective Equipment Market Revenue (million) Forecast, by Application 2020 & 2033
- Table 14: United States Sports Protective Equipment Market Volume (K Units ) Forecast, by Application 2020 & 2033
- Table 15: Canada Sports Protective Equipment Market Revenue (million) Forecast, by Application 2020 & 2033
- Table 16: Canada Sports Protective Equipment Market Volume (K Units ) Forecast, by Application 2020 & 2033
- Table 17: Mexico Sports Protective Equipment Market Revenue (million) Forecast, by Application 2020 & 2033
- Table 18: Mexico Sports Protective Equipment Market Volume (K Units ) Forecast, by Application 2020 & 2033
- Table 19: Rest of North America Sports Protective Equipment Market Revenue (million) Forecast, by Application 2020 & 2033
- Table 20: Rest of North America Sports Protective Equipment Market Volume (K Units ) Forecast, by Application 2020 & 2033
- Table 21: Global Sports Protective Equipment Market Revenue million Forecast, by Type 2020 & 2033
- Table 22: Global Sports Protective Equipment Market Volume K Units Forecast, by Type 2020 & 2033
- Table 23: Global Sports Protective Equipment Market Revenue million Forecast, by Distribution Channel 2020 & 2033
- Table 24: Global Sports Protective Equipment Market Volume K Units Forecast, by Distribution Channel 2020 & 2033
- Table 25: Global Sports Protective Equipment Market Revenue million Forecast, by Country 2020 & 2033
- Table 26: Global Sports Protective Equipment Market Volume K Units Forecast, by Country 2020 & 2033
- Table 27: Spain Sports Protective Equipment Market Revenue (million) Forecast, by Application 2020 & 2033
- Table 28: Spain Sports Protective Equipment Market Volume (K Units ) Forecast, by Application 2020 & 2033
- Table 29: United Kingdom Sports Protective Equipment Market Revenue (million) Forecast, by Application 2020 & 2033
- Table 30: United Kingdom Sports Protective Equipment Market Volume (K Units ) Forecast, by Application 2020 & 2033
- Table 31: Germany Sports Protective Equipment Market Revenue (million) Forecast, by Application 2020 & 2033
- Table 32: Germany Sports Protective Equipment Market Volume (K Units ) Forecast, by Application 2020 & 2033
- Table 33: France Sports Protective Equipment Market Revenue (million) Forecast, by Application 2020 & 2033
- Table 34: France Sports Protective Equipment Market Volume (K Units ) Forecast, by Application 2020 & 2033
- Table 35: Italy Sports Protective Equipment Market Revenue (million) Forecast, by Application 2020 & 2033
- Table 36: Italy Sports Protective Equipment Market Volume (K Units ) Forecast, by Application 2020 & 2033
- Table 37: Russia Sports Protective Equipment Market Revenue (million) Forecast, by Application 2020 & 2033
- Table 38: Russia Sports Protective Equipment Market Volume (K Units ) Forecast, by Application 2020 & 2033
- Table 39: Rest of Europe Sports Protective Equipment Market Revenue (million) Forecast, by Application 2020 & 2033
- Table 40: Rest of Europe Sports Protective Equipment Market Volume (K Units ) Forecast, by Application 2020 & 2033
- Table 41: Global Sports Protective Equipment Market Revenue million Forecast, by Type 2020 & 2033
- Table 42: Global Sports Protective Equipment Market Volume K Units Forecast, by Type 2020 & 2033
- Table 43: Global Sports Protective Equipment Market Revenue million Forecast, by Distribution Channel 2020 & 2033
- Table 44: Global Sports Protective Equipment Market Volume K Units Forecast, by Distribution Channel 2020 & 2033
- Table 45: Global Sports Protective Equipment Market Revenue million Forecast, by Country 2020 & 2033
- Table 46: Global Sports Protective Equipment Market Volume K Units Forecast, by Country 2020 & 2033
- Table 47: China Sports Protective Equipment Market Revenue (million) Forecast, by Application 2020 & 2033
- Table 48: China Sports Protective Equipment Market Volume (K Units ) Forecast, by Application 2020 & 2033
- Table 49: Japan Sports Protective Equipment Market Revenue (million) Forecast, by Application 2020 & 2033
- Table 50: Japan Sports Protective Equipment Market Volume (K Units ) Forecast, by Application 2020 & 2033
- Table 51: India Sports Protective Equipment Market Revenue (million) Forecast, by Application 2020 & 2033
- Table 52: India Sports Protective Equipment Market Volume (K Units ) Forecast, by Application 2020 & 2033
- Table 53: Australia Sports Protective Equipment Market Revenue (million) Forecast, by Application 2020 & 2033
- Table 54: Australia Sports Protective Equipment Market Volume (K Units ) Forecast, by Application 2020 & 2033
- Table 55: Rest of Asia Pacific Sports Protective Equipment Market Revenue (million) Forecast, by Application 2020 & 2033
- Table 56: Rest of Asia Pacific Sports Protective Equipment Market Volume (K Units ) Forecast, by Application 2020 & 2033
- Table 57: Global Sports Protective Equipment Market Revenue million Forecast, by Type 2020 & 2033
- Table 58: Global Sports Protective Equipment Market Volume K Units Forecast, by Type 2020 & 2033
- Table 59: Global Sports Protective Equipment Market Revenue million Forecast, by Distribution Channel 2020 & 2033
- Table 60: Global Sports Protective Equipment Market Volume K Units Forecast, by Distribution Channel 2020 & 2033
- Table 61: Global Sports Protective Equipment Market Revenue million Forecast, by Country 2020 & 2033
- Table 62: Global Sports Protective Equipment Market Volume K Units Forecast, by Country 2020 & 2033
- Table 63: Brazil Sports Protective Equipment Market Revenue (million) Forecast, by Application 2020 & 2033
- Table 64: Brazil Sports Protective Equipment Market Volume (K Units ) Forecast, by Application 2020 & 2033
- Table 65: Argentina Sports Protective Equipment Market Revenue (million) Forecast, by Application 2020 & 2033
- Table 66: Argentina Sports Protective Equipment Market Volume (K Units ) Forecast, by Application 2020 & 2033
- Table 67: Rest of South America Sports Protective Equipment Market Revenue (million) Forecast, by Application 2020 & 2033
- Table 68: Rest of South America Sports Protective Equipment Market Volume (K Units ) Forecast, by Application 2020 & 2033
- Table 69: Global Sports Protective Equipment Market Revenue million Forecast, by Type 2020 & 2033
- Table 70: Global Sports Protective Equipment Market Volume K Units Forecast, by Type 2020 & 2033
- Table 71: Global Sports Protective Equipment Market Revenue million Forecast, by Distribution Channel 2020 & 2033
- Table 72: Global Sports Protective Equipment Market Volume K Units Forecast, by Distribution Channel 2020 & 2033
- Table 73: Global Sports Protective Equipment Market Revenue million Forecast, by Country 2020 & 2033
- Table 74: Global Sports Protective Equipment Market Volume K Units Forecast, by Country 2020 & 2033
- Table 75: South Africa Sports Protective Equipment Market Revenue (million) Forecast, by Application 2020 & 2033
- Table 76: South Africa Sports Protective Equipment Market Volume (K Units ) Forecast, by Application 2020 & 2033
- Table 77: United Arab Emirates Sports Protective Equipment Market Revenue (million) Forecast, by Application 2020 & 2033
- Table 78: United Arab Emirates Sports Protective Equipment Market Volume (K Units ) Forecast, by Application 2020 & 2033
- Table 79: Rest of Middle East and Africa Sports Protective Equipment Market Revenue (million) Forecast, by Application 2020 & 2033
- Table 80: Rest of Middle East and Africa Sports Protective Equipment Market Volume (K Units ) Forecast, by Application 2020 & 2033
Frequently Asked Questions
1. What is the projected Compound Annual Growth Rate (CAGR) of the Sports Protective Equipment Market?
The projected CAGR is approximately 1.2%.
2. Which companies are prominent players in the Sports Protective Equipment Market?
Key companies in the market include Adidas AG, Harrow Sports Inc, MIZUNO Corporation, Bauer Hockey Inc, Amer Sports, Schutt Sports Inc *List Not Exhaustive, Puma SE, Nike Inc, Under Armour.
3. What are the main segments of the Sports Protective Equipment Market?
The market segments include Type, Distribution Channel.
4. Can you provide details about the market size?
The market size is estimated to be USD 325 million as of 2022.
5. What are some drivers contributing to market growth?
Aggressive Marketing and Strategic Investments by Key Players; Growing Prevalence of Smokeless Tobacco Supported By Growth in Production of Tobacco.
6. What are the notable trends driving market growth?
Increased Sports Participation Rate Owing to Favorable Government Initiatives.
7. Are there any restraints impacting market growth?
Stringent Government Regulations Leading to Ban on Smokeless Tobacco.
8. Can you provide examples of recent developments in the market?
N/A
9. What pricing options are available for accessing the report?
Pricing options include single-user, multi-user, and enterprise licenses priced at USD 4750, USD 5250, and USD 8750 respectively.
10. Is the market size provided in terms of value or volume?
The market size is provided in terms of value, measured in million and volume, measured in K Units .
11. Are there any specific market keywords associated with the report?
Yes, the market keyword associated with the report is "Sports Protective Equipment Market," which aids in identifying and referencing the specific market segment covered.
12. How do I determine which pricing option suits my needs best?
The pricing options vary based on user requirements and access needs. Individual users may opt for single-user licenses, while businesses requiring broader access may choose multi-user or enterprise licenses for cost-effective access to the report.
13. Are there any additional resources or data provided in the Sports Protective Equipment Market report?
While the report offers comprehensive insights, it's advisable to review the specific contents or supplementary materials provided to ascertain if additional resources or data are available.
14. How can I stay updated on further developments or reports in the Sports Protective Equipment Market?
To stay informed about further developments, trends, and reports in the Sports Protective Equipment Market, consider subscribing to industry newsletters, following relevant companies and organizations, or regularly checking reputable industry news sources and publications.
Methodology
Step 1 - Identification of Relevant Samples Size from Population Database


Step 2 - Approaches for Defining Global Market Size (Value, Volume* & Price*)

Note*: In applicable scenarios
Step 3 - Data Sources
Primary Research
- Web Analytics
- Survey Reports
- Research Institute
- Latest Research Reports
- Opinion Leaders
Secondary Research
- Annual Reports
- White Paper
- Latest Press Release
- Industry Association
- Paid Database
- Investor Presentations

Step 4 - Data Triangulation
Involves using different sources of information in order to increase the validity of a study
These sources are likely to be stakeholders in a program - participants, other researchers, program staff, other community members, and so on.
Then we put all data in single framework & apply various statistical tools to find out the dynamic on the market.
During the analysis stage, feedback from the stakeholder groups would be compared to determine areas of agreement as well as areas of divergence

