
Key Insights
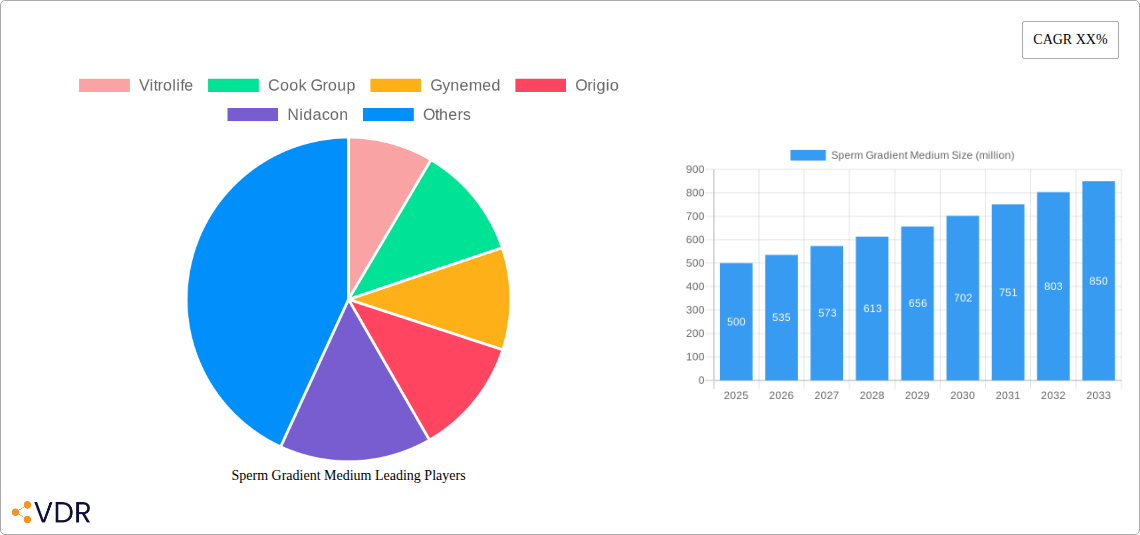
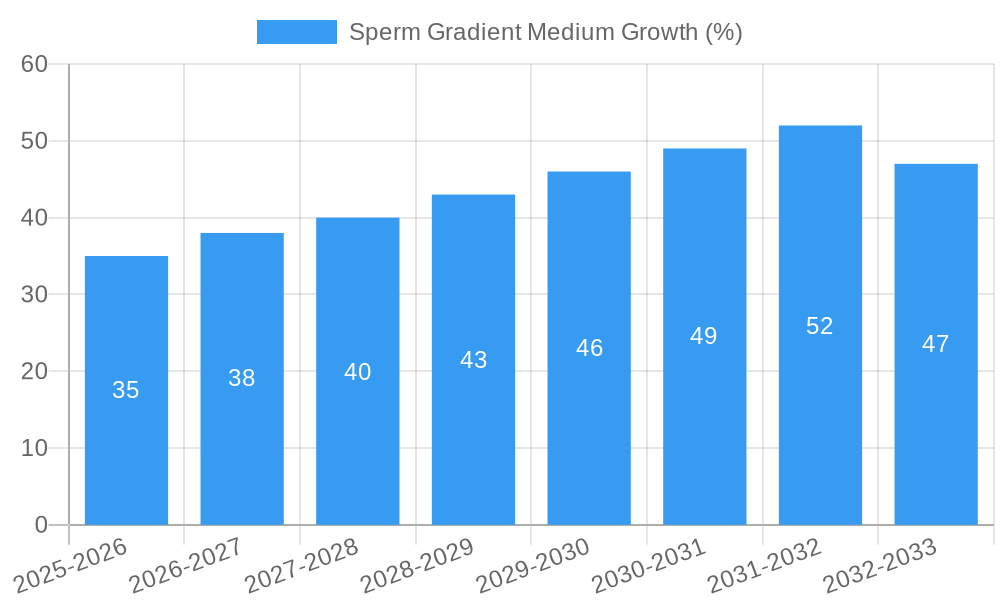
The global sperm gradient medium market is experiencing robust growth, driven by the increasing prevalence of infertility, advancements in assisted reproductive technologies (ART), and rising demand for improved sperm preparation techniques. The market, estimated at $500 million in 2025, is projected to witness a Compound Annual Growth Rate (CAGR) of 7% from 2025 to 2033, reaching approximately $850 million by 2033. Key drivers include the expanding ART sector, particularly in developing economies with growing awareness of fertility issues and increased access to ART procedures. Furthermore, technological advancements in sperm separation techniques, leading to higher-quality samples and improved fertilization rates, are fueling market expansion. The market is segmented by type (e.g., density gradient, swim-up), application (in-vitro fertilization (IVF), intra-cytoplasmic sperm injection (ICSI)), and end-user (hospitals, fertility clinics). Competition among established players like Vitrolife, Cook Group, and Origio is intense, with ongoing efforts to develop innovative products and expand market reach. Challenges include stringent regulatory approvals, high costs associated with ART procedures, and ethical considerations surrounding sperm selection and manipulation.
The competitive landscape features both established multinational corporations and smaller specialized companies. Leading players are focusing on strategic collaborations, mergers and acquisitions, and product diversification to maintain their competitive edge. Geographic expansion, particularly in emerging markets with high growth potential, is a key strategic priority. Future market growth will depend on factors such as technological advancements, regulatory changes, and evolving healthcare infrastructure. A shift towards minimally invasive procedures and personalized medicine approaches is expected to create new market opportunities. The ongoing research and development efforts to improve sperm preparation techniques and enhance the success rates of ART procedures will significantly influence the future growth trajectory of the sperm gradient medium market.
Sperm Gradient Medium Market Report: 2019-2033
This comprehensive report provides an in-depth analysis of the global Sperm Gradient Medium market, offering valuable insights for industry professionals, investors, and researchers. With a focus on market dynamics, growth trends, competitive landscape, and future outlook, this report covers the period from 2019 to 2033, with 2025 as the base and estimated year. The report leverages extensive primary and secondary research to deliver precise data and informed projections. The global market is projected to reach xx million units by 2033.
Parent Market: In-vitro fertilization (IVF) market. Child Market: Assisted Reproductive Technology (ART) consumables.
Sperm Gradient Medium Market Dynamics & Structure
The Sperm Gradient Medium market is characterized by moderate concentration, with key players like Vitrolife, Cook Group, and FUJIFILM Irvine Scientific holding significant market share. The market size in 2024 is estimated to be 150 million units. Technological innovations, primarily focused on improving sperm selection efficiency and reducing processing time, are crucial drivers. Stringent regulatory frameworks governing medical devices influence market access and product development. Competitive substitutes, such as density gradient centrifugation techniques, exist but are less efficient. The end-user demographic primarily comprises fertility clinics and hospitals. M&A activity has been relatively low in recent years, with only xx deals recorded between 2019 and 2024.
- Market Concentration: Moderately concentrated, with top 5 players holding approximately 60% market share in 2024.
- Technological Innovation: Focus on improving sperm selection purity and reducing processing time.
- Regulatory Framework: Stringent regulations impacting product approval and market entry.
- Competitive Substitutes: Density gradient centrifugation, with limitations in efficiency and cost.
- End-User Demographics: Fertility clinics and hospitals constitute the primary end-users.
- M&A Trends: Low M&A activity (xx deals) between 2019 and 2024, indicating a stable market consolidation.
- Innovation Barriers: High regulatory hurdles and significant R&D investments required.
Sperm Gradient Medium Growth Trends & Insights
The Sperm Gradient Medium market has experienced steady growth during the historical period (2019-2024), driven by increasing IVF procedures globally. The market is projected to grow at a CAGR of xx% from 2025 to 2033, reaching a projected xx million units. Increased awareness of infertility issues, coupled with advancements in ART, fuels market adoption. Technological disruptions, such as the introduction of automated systems, are improving efficiency and reducing costs, further driving market penetration. Shifting consumer preferences toward minimally invasive procedures also contribute to positive market growth.
Dominant Regions, Countries, or Segments in Sperm Gradient Medium
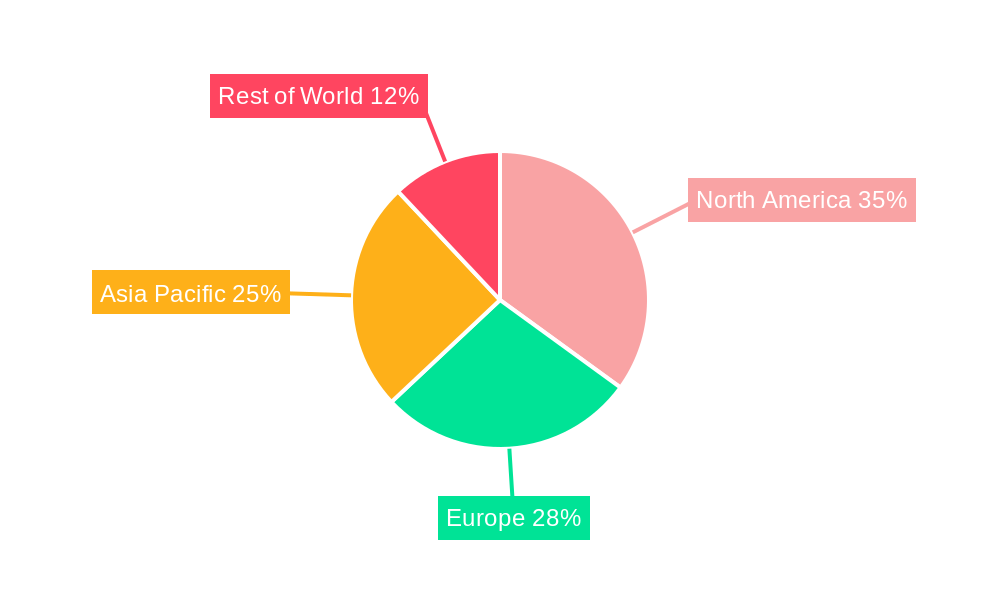
North America currently holds the largest market share, driven by high adoption rates of assisted reproductive technologies and a well-established healthcare infrastructure. Europe follows closely, with strong regulatory frameworks and high investments in fertility treatments. However, Asia-Pacific is anticipated to show the fastest growth during the forecast period due to rising disposable incomes, increasing awareness of infertility, and favorable government policies.
- North America: Largest market share due to high IVF procedure rates and advanced healthcare infrastructure.
- Europe: Strong market presence due to supportive regulatory environments and substantial investments.
- Asia-Pacific: Fastest-growing region, driven by rising disposable incomes and increasing IVF adoption.
- Key Drivers: Rising infertility rates, improved healthcare infrastructure, favorable government policies (e.g., insurance coverage for ART).
Sperm Gradient Medium Product Landscape
Sperm gradient media are available in various formulations, each optimized for specific sperm characteristics and processing requirements. Recent innovations focus on improved sperm viability, reduced DNA damage, and easier handling. Unique selling propositions center on enhanced sperm selection efficiency, leading to higher fertilization rates and improved pregnancy outcomes. Technological advancements include the development of ready-to-use kits, reducing the need for complex preparation procedures.
Key Drivers, Barriers & Challenges in Sperm Gradient Medium
Key Drivers:
- Rising infertility rates globally.
- Increasing adoption of IVF and other ART procedures.
- Technological advancements resulting in improved product efficacy.
- Favorable government policies and insurance coverage in several regions.
Key Challenges:
- Stringent regulatory approvals and compliance requirements.
- High research and development costs.
- Competition from substitute technologies.
- Supply chain disruptions impacting raw material availability and cost. (Estimated impact: xx% reduction in supply in 2023).
Emerging Opportunities in Sperm Gradient Medium
Untapped markets in developing economies with high infertility rates present significant growth potential. The development of novel media formulations with improved performance characteristics represents a key opportunity. Customized media solutions tailored to specific patient needs are gaining traction. Expanding into related areas, such as cryopreservation media, offers further avenues for growth.
Growth Accelerators in the Sperm Gradient Medium Industry
Technological breakthroughs in sperm selection and media formulation are key growth drivers. Strategic partnerships between media manufacturers and IVF clinics enhance market reach and product adoption. Market expansion strategies targeting emerging economies offer significant growth potential, particularly in Asia-Pacific and Latin America.
Key Players Shaping the Sperm Gradient Medium Market
- Vitrolife
- Cook Group
- Gynemed
- Origio
- Nidacon
- FUJIFILM Irvine Scientific
- Shenzhen Vitavitro BIOTECH Co.,Ltd.
- BRED Life Science Technology Inc
Notable Milestones in Sperm Gradient Medium Sector
- 2020: Vitrolife launched a new generation of sperm gradient media with improved sperm viability.
- 2022: Cook Group acquired a smaller competitor, expanding its product portfolio.
- 2023: New regulatory guidelines for sperm gradient media were introduced in the EU.
In-Depth Sperm Gradient Medium Market Outlook
The Sperm Gradient Medium market is poised for continued growth, fueled by technological advancements, expanding ART adoption rates, and rising infertility prevalence. Strategic partnerships, market expansion into new geographies, and the development of innovative product formulations will play crucial roles in shaping the future market landscape. The market’s potential lies in catering to the increasing demand for efficient and effective ART solutions.
Sperm Gradient Medium Segmentation
-
1. Application
- 1.1. Hospitals
- 1.2. Research Institutes
-
2. Types
- 2.1. 0.4
- 2.2. 0.45
- 2.3. 0.8
- 2.4. 0.9
- 2.5. Others
Sperm Gradient Medium Segmentation By Geography
-
1. North America
- 1.1. United States
- 1.2. Canada
- 1.3. Mexico
-
2. South America
- 2.1. Brazil
- 2.2. Argentina
- 2.3. Rest of South America
-
3. Europe
- 3.1. United Kingdom
- 3.2. Germany
- 3.3. France
- 3.4. Italy
- 3.5. Spain
- 3.6. Russia
- 3.7. Benelux
- 3.8. Nordics
- 3.9. Rest of Europe
-
4. Middle East & Africa
- 4.1. Turkey
- 4.2. Israel
- 4.3. GCC
- 4.4. North Africa
- 4.5. South Africa
- 4.6. Rest of Middle East & Africa
-
5. Asia Pacific
- 5.1. China
- 5.2. India
- 5.3. Japan
- 5.4. South Korea
- 5.5. ASEAN
- 5.6. Oceania
- 5.7. Rest of Asia Pacific
Sperm Gradient Medium REPORT HIGHLIGHTS
| Aspects | Details |
|---|---|
| Study Period | 2019-2033 |
| Base Year | 2024 |
| Estimated Year | 2025 |
| Forecast Period | 2025-2033 |
| Historical Period | 2019-2024 |
| Growth Rate | CAGR of XX% from 2019-2033 |
| Segmentation |
|
Table of Contents
- 1. Introduction
- 1.1. Research Scope
- 1.2. Market Segmentation
- 1.3. Research Methodology
- 1.4. Definitions and Assumptions
- 2. Executive Summary
- 2.1. Introduction
- 3. Market Dynamics
- 3.1. Introduction
- 3.2. Market Drivers
- 3.3. Market Restrains
- 3.4. Market Trends
- 4. Market Factor Analysis
- 4.1. Porters Five Forces
- 4.2. Supply/Value Chain
- 4.3. PESTEL analysis
- 4.4. Market Entropy
- 4.5. Patent/Trademark Analysis
- 5. Global Sperm Gradient Medium Analysis, Insights and Forecast, 2019-2031
- 5.1. Market Analysis, Insights and Forecast - by Application
- 5.1.1. Hospitals
- 5.1.2. Research Institutes
- 5.2. Market Analysis, Insights and Forecast - by Types
- 5.2.1. 0.4
- 5.2.2. 0.45
- 5.2.3. 0.8
- 5.2.4. 0.9
- 5.2.5. Others
- 5.3. Market Analysis, Insights and Forecast - by Region
- 5.3.1. North America
- 5.3.2. South America
- 5.3.3. Europe
- 5.3.4. Middle East & Africa
- 5.3.5. Asia Pacific
- 5.1. Market Analysis, Insights and Forecast - by Application
- 6. North America Sperm Gradient Medium Analysis, Insights and Forecast, 2019-2031
- 6.1. Market Analysis, Insights and Forecast - by Application
- 6.1.1. Hospitals
- 6.1.2. Research Institutes
- 6.2. Market Analysis, Insights and Forecast - by Types
- 6.2.1. 0.4
- 6.2.2. 0.45
- 6.2.3. 0.8
- 6.2.4. 0.9
- 6.2.5. Others
- 6.1. Market Analysis, Insights and Forecast - by Application
- 7. South America Sperm Gradient Medium Analysis, Insights and Forecast, 2019-2031
- 7.1. Market Analysis, Insights and Forecast - by Application
- 7.1.1. Hospitals
- 7.1.2. Research Institutes
- 7.2. Market Analysis, Insights and Forecast - by Types
- 7.2.1. 0.4
- 7.2.2. 0.45
- 7.2.3. 0.8
- 7.2.4. 0.9
- 7.2.5. Others
- 7.1. Market Analysis, Insights and Forecast - by Application
- 8. Europe Sperm Gradient Medium Analysis, Insights and Forecast, 2019-2031
- 8.1. Market Analysis, Insights and Forecast - by Application
- 8.1.1. Hospitals
- 8.1.2. Research Institutes
- 8.2. Market Analysis, Insights and Forecast - by Types
- 8.2.1. 0.4
- 8.2.2. 0.45
- 8.2.3. 0.8
- 8.2.4. 0.9
- 8.2.5. Others
- 8.1. Market Analysis, Insights and Forecast - by Application
- 9. Middle East & Africa Sperm Gradient Medium Analysis, Insights and Forecast, 2019-2031
- 9.1. Market Analysis, Insights and Forecast - by Application
- 9.1.1. Hospitals
- 9.1.2. Research Institutes
- 9.2. Market Analysis, Insights and Forecast - by Types
- 9.2.1. 0.4
- 9.2.2. 0.45
- 9.2.3. 0.8
- 9.2.4. 0.9
- 9.2.5. Others
- 9.1. Market Analysis, Insights and Forecast - by Application
- 10. Asia Pacific Sperm Gradient Medium Analysis, Insights and Forecast, 2019-2031
- 10.1. Market Analysis, Insights and Forecast - by Application
- 10.1.1. Hospitals
- 10.1.2. Research Institutes
- 10.2. Market Analysis, Insights and Forecast - by Types
- 10.2.1. 0.4
- 10.2.2. 0.45
- 10.2.3. 0.8
- 10.2.4. 0.9
- 10.2.5. Others
- 10.1. Market Analysis, Insights and Forecast - by Application
- 11. Competitive Analysis
- 11.1. Global Market Share Analysis 2024
- 11.2. Company Profiles
- 11.2.1 Vitrolife
- 11.2.1.1. Overview
- 11.2.1.2. Products
- 11.2.1.3. SWOT Analysis
- 11.2.1.4. Recent Developments
- 11.2.1.5. Financials (Based on Availability)
- 11.2.2 Cook Group
- 11.2.2.1. Overview
- 11.2.2.2. Products
- 11.2.2.3. SWOT Analysis
- 11.2.2.4. Recent Developments
- 11.2.2.5. Financials (Based on Availability)
- 11.2.3 Gynemed
- 11.2.3.1. Overview
- 11.2.3.2. Products
- 11.2.3.3. SWOT Analysis
- 11.2.3.4. Recent Developments
- 11.2.3.5. Financials (Based on Availability)
- 11.2.4 Origio
- 11.2.4.1. Overview
- 11.2.4.2. Products
- 11.2.4.3. SWOT Analysis
- 11.2.4.4. Recent Developments
- 11.2.4.5. Financials (Based on Availability)
- 11.2.5 Nidacon
- 11.2.5.1. Overview
- 11.2.5.2. Products
- 11.2.5.3. SWOT Analysis
- 11.2.5.4. Recent Developments
- 11.2.5.5. Financials (Based on Availability)
- 11.2.6 FUJIFILM Irvine Scientific
- 11.2.6.1. Overview
- 11.2.6.2. Products
- 11.2.6.3. SWOT Analysis
- 11.2.6.4. Recent Developments
- 11.2.6.5. Financials (Based on Availability)
- 11.2.7 Shenzhen Vitavitro BIOTECH Co.
- 11.2.7.1. Overview
- 11.2.7.2. Products
- 11.2.7.3. SWOT Analysis
- 11.2.7.4. Recent Developments
- 11.2.7.5. Financials (Based on Availability)
- 11.2.8 Ltd.
- 11.2.8.1. Overview
- 11.2.8.2. Products
- 11.2.8.3. SWOT Analysis
- 11.2.8.4. Recent Developments
- 11.2.8.5. Financials (Based on Availability)
- 11.2.9 BRED Life Science Technology Inc
- 11.2.9.1. Overview
- 11.2.9.2. Products
- 11.2.9.3. SWOT Analysis
- 11.2.9.4. Recent Developments
- 11.2.9.5. Financials (Based on Availability)
- 11.2.1 Vitrolife
List of Figures
- Figure 1: Global Sperm Gradient Medium Revenue Breakdown (million, %) by Region 2024 & 2032
- Figure 2: Global Sperm Gradient Medium Volume Breakdown (K, %) by Region 2024 & 2032
- Figure 3: North America Sperm Gradient Medium Revenue (million), by Application 2024 & 2032
- Figure 4: North America Sperm Gradient Medium Volume (K), by Application 2024 & 2032
- Figure 5: North America Sperm Gradient Medium Revenue Share (%), by Application 2024 & 2032
- Figure 6: North America Sperm Gradient Medium Volume Share (%), by Application 2024 & 2032
- Figure 7: North America Sperm Gradient Medium Revenue (million), by Types 2024 & 2032
- Figure 8: North America Sperm Gradient Medium Volume (K), by Types 2024 & 2032
- Figure 9: North America Sperm Gradient Medium Revenue Share (%), by Types 2024 & 2032
- Figure 10: North America Sperm Gradient Medium Volume Share (%), by Types 2024 & 2032
- Figure 11: North America Sperm Gradient Medium Revenue (million), by Country 2024 & 2032
- Figure 12: North America Sperm Gradient Medium Volume (K), by Country 2024 & 2032
- Figure 13: North America Sperm Gradient Medium Revenue Share (%), by Country 2024 & 2032
- Figure 14: North America Sperm Gradient Medium Volume Share (%), by Country 2024 & 2032
- Figure 15: South America Sperm Gradient Medium Revenue (million), by Application 2024 & 2032
- Figure 16: South America Sperm Gradient Medium Volume (K), by Application 2024 & 2032
- Figure 17: South America Sperm Gradient Medium Revenue Share (%), by Application 2024 & 2032
- Figure 18: South America Sperm Gradient Medium Volume Share (%), by Application 2024 & 2032
- Figure 19: South America Sperm Gradient Medium Revenue (million), by Types 2024 & 2032
- Figure 20: South America Sperm Gradient Medium Volume (K), by Types 2024 & 2032
- Figure 21: South America Sperm Gradient Medium Revenue Share (%), by Types 2024 & 2032
- Figure 22: South America Sperm Gradient Medium Volume Share (%), by Types 2024 & 2032
- Figure 23: South America Sperm Gradient Medium Revenue (million), by Country 2024 & 2032
- Figure 24: South America Sperm Gradient Medium Volume (K), by Country 2024 & 2032
- Figure 25: South America Sperm Gradient Medium Revenue Share (%), by Country 2024 & 2032
- Figure 26: South America Sperm Gradient Medium Volume Share (%), by Country 2024 & 2032
- Figure 27: Europe Sperm Gradient Medium Revenue (million), by Application 2024 & 2032
- Figure 28: Europe Sperm Gradient Medium Volume (K), by Application 2024 & 2032
- Figure 29: Europe Sperm Gradient Medium Revenue Share (%), by Application 2024 & 2032
- Figure 30: Europe Sperm Gradient Medium Volume Share (%), by Application 2024 & 2032
- Figure 31: Europe Sperm Gradient Medium Revenue (million), by Types 2024 & 2032
- Figure 32: Europe Sperm Gradient Medium Volume (K), by Types 2024 & 2032
- Figure 33: Europe Sperm Gradient Medium Revenue Share (%), by Types 2024 & 2032
- Figure 34: Europe Sperm Gradient Medium Volume Share (%), by Types 2024 & 2032
- Figure 35: Europe Sperm Gradient Medium Revenue (million), by Country 2024 & 2032
- Figure 36: Europe Sperm Gradient Medium Volume (K), by Country 2024 & 2032
- Figure 37: Europe Sperm Gradient Medium Revenue Share (%), by Country 2024 & 2032
- Figure 38: Europe Sperm Gradient Medium Volume Share (%), by Country 2024 & 2032
- Figure 39: Middle East & Africa Sperm Gradient Medium Revenue (million), by Application 2024 & 2032
- Figure 40: Middle East & Africa Sperm Gradient Medium Volume (K), by Application 2024 & 2032
- Figure 41: Middle East & Africa Sperm Gradient Medium Revenue Share (%), by Application 2024 & 2032
- Figure 42: Middle East & Africa Sperm Gradient Medium Volume Share (%), by Application 2024 & 2032
- Figure 43: Middle East & Africa Sperm Gradient Medium Revenue (million), by Types 2024 & 2032
- Figure 44: Middle East & Africa Sperm Gradient Medium Volume (K), by Types 2024 & 2032
- Figure 45: Middle East & Africa Sperm Gradient Medium Revenue Share (%), by Types 2024 & 2032
- Figure 46: Middle East & Africa Sperm Gradient Medium Volume Share (%), by Types 2024 & 2032
- Figure 47: Middle East & Africa Sperm Gradient Medium Revenue (million), by Country 2024 & 2032
- Figure 48: Middle East & Africa Sperm Gradient Medium Volume (K), by Country 2024 & 2032
- Figure 49: Middle East & Africa Sperm Gradient Medium Revenue Share (%), by Country 2024 & 2032
- Figure 50: Middle East & Africa Sperm Gradient Medium Volume Share (%), by Country 2024 & 2032
- Figure 51: Asia Pacific Sperm Gradient Medium Revenue (million), by Application 2024 & 2032
- Figure 52: Asia Pacific Sperm Gradient Medium Volume (K), by Application 2024 & 2032
- Figure 53: Asia Pacific Sperm Gradient Medium Revenue Share (%), by Application 2024 & 2032
- Figure 54: Asia Pacific Sperm Gradient Medium Volume Share (%), by Application 2024 & 2032
- Figure 55: Asia Pacific Sperm Gradient Medium Revenue (million), by Types 2024 & 2032
- Figure 56: Asia Pacific Sperm Gradient Medium Volume (K), by Types 2024 & 2032
- Figure 57: Asia Pacific Sperm Gradient Medium Revenue Share (%), by Types 2024 & 2032
- Figure 58: Asia Pacific Sperm Gradient Medium Volume Share (%), by Types 2024 & 2032
- Figure 59: Asia Pacific Sperm Gradient Medium Revenue (million), by Country 2024 & 2032
- Figure 60: Asia Pacific Sperm Gradient Medium Volume (K), by Country 2024 & 2032
- Figure 61: Asia Pacific Sperm Gradient Medium Revenue Share (%), by Country 2024 & 2032
- Figure 62: Asia Pacific Sperm Gradient Medium Volume Share (%), by Country 2024 & 2032
List of Tables
- Table 1: Global Sperm Gradient Medium Revenue million Forecast, by Region 2019 & 2032
- Table 2: Global Sperm Gradient Medium Volume K Forecast, by Region 2019 & 2032
- Table 3: Global Sperm Gradient Medium Revenue million Forecast, by Application 2019 & 2032
- Table 4: Global Sperm Gradient Medium Volume K Forecast, by Application 2019 & 2032
- Table 5: Global Sperm Gradient Medium Revenue million Forecast, by Types 2019 & 2032
- Table 6: Global Sperm Gradient Medium Volume K Forecast, by Types 2019 & 2032
- Table 7: Global Sperm Gradient Medium Revenue million Forecast, by Region 2019 & 2032
- Table 8: Global Sperm Gradient Medium Volume K Forecast, by Region 2019 & 2032
- Table 9: Global Sperm Gradient Medium Revenue million Forecast, by Application 2019 & 2032
- Table 10: Global Sperm Gradient Medium Volume K Forecast, by Application 2019 & 2032
- Table 11: Global Sperm Gradient Medium Revenue million Forecast, by Types 2019 & 2032
- Table 12: Global Sperm Gradient Medium Volume K Forecast, by Types 2019 & 2032
- Table 13: Global Sperm Gradient Medium Revenue million Forecast, by Country 2019 & 2032
- Table 14: Global Sperm Gradient Medium Volume K Forecast, by Country 2019 & 2032
- Table 15: United States Sperm Gradient Medium Revenue (million) Forecast, by Application 2019 & 2032
- Table 16: United States Sperm Gradient Medium Volume (K) Forecast, by Application 2019 & 2032
- Table 17: Canada Sperm Gradient Medium Revenue (million) Forecast, by Application 2019 & 2032
- Table 18: Canada Sperm Gradient Medium Volume (K) Forecast, by Application 2019 & 2032
- Table 19: Mexico Sperm Gradient Medium Revenue (million) Forecast, by Application 2019 & 2032
- Table 20: Mexico Sperm Gradient Medium Volume (K) Forecast, by Application 2019 & 2032
- Table 21: Global Sperm Gradient Medium Revenue million Forecast, by Application 2019 & 2032
- Table 22: Global Sperm Gradient Medium Volume K Forecast, by Application 2019 & 2032
- Table 23: Global Sperm Gradient Medium Revenue million Forecast, by Types 2019 & 2032
- Table 24: Global Sperm Gradient Medium Volume K Forecast, by Types 2019 & 2032
- Table 25: Global Sperm Gradient Medium Revenue million Forecast, by Country 2019 & 2032
- Table 26: Global Sperm Gradient Medium Volume K Forecast, by Country 2019 & 2032
- Table 27: Brazil Sperm Gradient Medium Revenue (million) Forecast, by Application 2019 & 2032
- Table 28: Brazil Sperm Gradient Medium Volume (K) Forecast, by Application 2019 & 2032
- Table 29: Argentina Sperm Gradient Medium Revenue (million) Forecast, by Application 2019 & 2032
- Table 30: Argentina Sperm Gradient Medium Volume (K) Forecast, by Application 2019 & 2032
- Table 31: Rest of South America Sperm Gradient Medium Revenue (million) Forecast, by Application 2019 & 2032
- Table 32: Rest of South America Sperm Gradient Medium Volume (K) Forecast, by Application 2019 & 2032
- Table 33: Global Sperm Gradient Medium Revenue million Forecast, by Application 2019 & 2032
- Table 34: Global Sperm Gradient Medium Volume K Forecast, by Application 2019 & 2032
- Table 35: Global Sperm Gradient Medium Revenue million Forecast, by Types 2019 & 2032
- Table 36: Global Sperm Gradient Medium Volume K Forecast, by Types 2019 & 2032
- Table 37: Global Sperm Gradient Medium Revenue million Forecast, by Country 2019 & 2032
- Table 38: Global Sperm Gradient Medium Volume K Forecast, by Country 2019 & 2032
- Table 39: United Kingdom Sperm Gradient Medium Revenue (million) Forecast, by Application 2019 & 2032
- Table 40: United Kingdom Sperm Gradient Medium Volume (K) Forecast, by Application 2019 & 2032
- Table 41: Germany Sperm Gradient Medium Revenue (million) Forecast, by Application 2019 & 2032
- Table 42: Germany Sperm Gradient Medium Volume (K) Forecast, by Application 2019 & 2032
- Table 43: France Sperm Gradient Medium Revenue (million) Forecast, by Application 2019 & 2032
- Table 44: France Sperm Gradient Medium Volume (K) Forecast, by Application 2019 & 2032
- Table 45: Italy Sperm Gradient Medium Revenue (million) Forecast, by Application 2019 & 2032
- Table 46: Italy Sperm Gradient Medium Volume (K) Forecast, by Application 2019 & 2032
- Table 47: Spain Sperm Gradient Medium Revenue (million) Forecast, by Application 2019 & 2032
- Table 48: Spain Sperm Gradient Medium Volume (K) Forecast, by Application 2019 & 2032
- Table 49: Russia Sperm Gradient Medium Revenue (million) Forecast, by Application 2019 & 2032
- Table 50: Russia Sperm Gradient Medium Volume (K) Forecast, by Application 2019 & 2032
- Table 51: Benelux Sperm Gradient Medium Revenue (million) Forecast, by Application 2019 & 2032
- Table 52: Benelux Sperm Gradient Medium Volume (K) Forecast, by Application 2019 & 2032
- Table 53: Nordics Sperm Gradient Medium Revenue (million) Forecast, by Application 2019 & 2032
- Table 54: Nordics Sperm Gradient Medium Volume (K) Forecast, by Application 2019 & 2032
- Table 55: Rest of Europe Sperm Gradient Medium Revenue (million) Forecast, by Application 2019 & 2032
- Table 56: Rest of Europe Sperm Gradient Medium Volume (K) Forecast, by Application 2019 & 2032
- Table 57: Global Sperm Gradient Medium Revenue million Forecast, by Application 2019 & 2032
- Table 58: Global Sperm Gradient Medium Volume K Forecast, by Application 2019 & 2032
- Table 59: Global Sperm Gradient Medium Revenue million Forecast, by Types 2019 & 2032
- Table 60: Global Sperm Gradient Medium Volume K Forecast, by Types 2019 & 2032
- Table 61: Global Sperm Gradient Medium Revenue million Forecast, by Country 2019 & 2032
- Table 62: Global Sperm Gradient Medium Volume K Forecast, by Country 2019 & 2032
- Table 63: Turkey Sperm Gradient Medium Revenue (million) Forecast, by Application 2019 & 2032
- Table 64: Turkey Sperm Gradient Medium Volume (K) Forecast, by Application 2019 & 2032
- Table 65: Israel Sperm Gradient Medium Revenue (million) Forecast, by Application 2019 & 2032
- Table 66: Israel Sperm Gradient Medium Volume (K) Forecast, by Application 2019 & 2032
- Table 67: GCC Sperm Gradient Medium Revenue (million) Forecast, by Application 2019 & 2032
- Table 68: GCC Sperm Gradient Medium Volume (K) Forecast, by Application 2019 & 2032
- Table 69: North Africa Sperm Gradient Medium Revenue (million) Forecast, by Application 2019 & 2032
- Table 70: North Africa Sperm Gradient Medium Volume (K) Forecast, by Application 2019 & 2032
- Table 71: South Africa Sperm Gradient Medium Revenue (million) Forecast, by Application 2019 & 2032
- Table 72: South Africa Sperm Gradient Medium Volume (K) Forecast, by Application 2019 & 2032
- Table 73: Rest of Middle East & Africa Sperm Gradient Medium Revenue (million) Forecast, by Application 2019 & 2032
- Table 74: Rest of Middle East & Africa Sperm Gradient Medium Volume (K) Forecast, by Application 2019 & 2032
- Table 75: Global Sperm Gradient Medium Revenue million Forecast, by Application 2019 & 2032
- Table 76: Global Sperm Gradient Medium Volume K Forecast, by Application 2019 & 2032
- Table 77: Global Sperm Gradient Medium Revenue million Forecast, by Types 2019 & 2032
- Table 78: Global Sperm Gradient Medium Volume K Forecast, by Types 2019 & 2032
- Table 79: Global Sperm Gradient Medium Revenue million Forecast, by Country 2019 & 2032
- Table 80: Global Sperm Gradient Medium Volume K Forecast, by Country 2019 & 2032
- Table 81: China Sperm Gradient Medium Revenue (million) Forecast, by Application 2019 & 2032
- Table 82: China Sperm Gradient Medium Volume (K) Forecast, by Application 2019 & 2032
- Table 83: India Sperm Gradient Medium Revenue (million) Forecast, by Application 2019 & 2032
- Table 84: India Sperm Gradient Medium Volume (K) Forecast, by Application 2019 & 2032
- Table 85: Japan Sperm Gradient Medium Revenue (million) Forecast, by Application 2019 & 2032
- Table 86: Japan Sperm Gradient Medium Volume (K) Forecast, by Application 2019 & 2032
- Table 87: South Korea Sperm Gradient Medium Revenue (million) Forecast, by Application 2019 & 2032
- Table 88: South Korea Sperm Gradient Medium Volume (K) Forecast, by Application 2019 & 2032
- Table 89: ASEAN Sperm Gradient Medium Revenue (million) Forecast, by Application 2019 & 2032
- Table 90: ASEAN Sperm Gradient Medium Volume (K) Forecast, by Application 2019 & 2032
- Table 91: Oceania Sperm Gradient Medium Revenue (million) Forecast, by Application 2019 & 2032
- Table 92: Oceania Sperm Gradient Medium Volume (K) Forecast, by Application 2019 & 2032
- Table 93: Rest of Asia Pacific Sperm Gradient Medium Revenue (million) Forecast, by Application 2019 & 2032
- Table 94: Rest of Asia Pacific Sperm Gradient Medium Volume (K) Forecast, by Application 2019 & 2032
Frequently Asked Questions
1. What is the projected Compound Annual Growth Rate (CAGR) of the Sperm Gradient Medium?
The projected CAGR is approximately XX%.
2. Which companies are prominent players in the Sperm Gradient Medium?
Key companies in the market include Vitrolife, Cook Group, Gynemed, Origio, Nidacon, FUJIFILM Irvine Scientific, Shenzhen Vitavitro BIOTECH Co., Ltd., BRED Life Science Technology Inc.
3. What are the main segments of the Sperm Gradient Medium?
The market segments include Application, Types.
4. Can you provide details about the market size?
The market size is estimated to be USD XXX million as of 2022.
5. What are some drivers contributing to market growth?
N/A
6. What are the notable trends driving market growth?
N/A
7. Are there any restraints impacting market growth?
N/A
8. Can you provide examples of recent developments in the market?
N/A
9. What pricing options are available for accessing the report?
Pricing options include single-user, multi-user, and enterprise licenses priced at USD 3350.00, USD 5025.00, and USD 6700.00 respectively.
10. Is the market size provided in terms of value or volume?
The market size is provided in terms of value, measured in million and volume, measured in K.
11. Are there any specific market keywords associated with the report?
Yes, the market keyword associated with the report is "Sperm Gradient Medium," which aids in identifying and referencing the specific market segment covered.
12. How do I determine which pricing option suits my needs best?
The pricing options vary based on user requirements and access needs. Individual users may opt for single-user licenses, while businesses requiring broader access may choose multi-user or enterprise licenses for cost-effective access to the report.
13. Are there any additional resources or data provided in the Sperm Gradient Medium report?
While the report offers comprehensive insights, it's advisable to review the specific contents or supplementary materials provided to ascertain if additional resources or data are available.
14. How can I stay updated on further developments or reports in the Sperm Gradient Medium?
To stay informed about further developments, trends, and reports in the Sperm Gradient Medium, consider subscribing to industry newsletters, following relevant companies and organizations, or regularly checking reputable industry news sources and publications.
Methodology
Step 1 - Identification of Relevant Samples Size from Population Database


Step 2 - Approaches for Defining Global Market Size (Value, Volume* & Price*)

Note*: In applicable scenarios
Step 3 - Data Sources
Primary Research
- Web Analytics
- Survey Reports
- Research Institute
- Latest Research Reports
- Opinion Leaders
Secondary Research
- Annual Reports
- White Paper
- Latest Press Release
- Industry Association
- Paid Database
- Investor Presentations

Step 4 - Data Triangulation
Involves using different sources of information in order to increase the validity of a study
These sources are likely to be stakeholders in a program - participants, other researchers, program staff, other community members, and so on.
Then we put all data in single framework & apply various statistical tools to find out the dynamic on the market.
During the analysis stage, feedback from the stakeholder groups would be compared to determine areas of agreement as well as areas of divergence


