
Key Insights
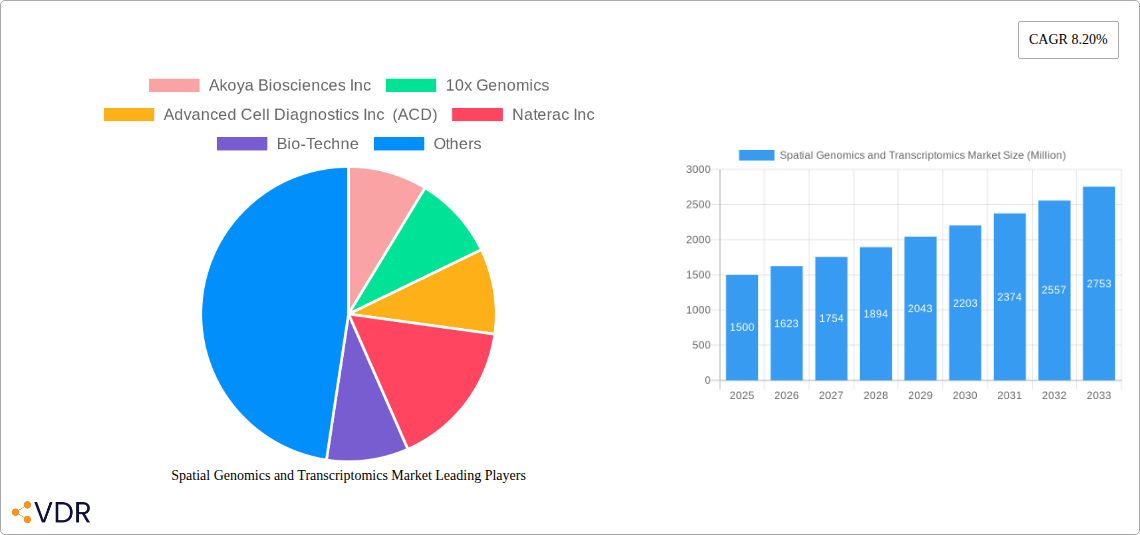
The spatial genomics and transcriptomics market is experiencing robust growth, driven by the increasing need to understand the spatial organization of cells and molecules within tissues. This technology allows researchers to analyze gene expression and genomic variations within their native tissue context, providing a more comprehensive understanding of biological processes than traditional methods. The market's expansion is fueled by advancements in imaging technologies, the development of sophisticated software for data analysis, and the rising adoption of spatial genomics in various research areas, including oncology, immunology, and neuroscience. Pharmaceutical manufacturers are increasingly incorporating spatial data into drug discovery and development, further driving market growth. The segment dominated by instruments is expected to maintain its leading position, followed by consumables and software. North America currently holds a significant market share, benefiting from strong research infrastructure and funding, but the Asia-Pacific region is projected to witness rapid growth due to increasing investments in life sciences and a growing number of research institutions.
The market's segmentation, including technologies like spatial transcriptomics and spatial genomics, products such as instruments, software, and consumables, and end-users spanning pharmaceutical manufacturers and diagnostic customers, reflects the multifaceted nature of this field. While the high cost of instrumentation and the complexity of data analysis present challenges, ongoing technological advancements are mitigating these limitations, making spatial genomics more accessible to a wider range of researchers. The competitive landscape features prominent players like 10x Genomics, Illumina, and Akoya Biosciences, constantly innovating and expanding their product portfolios. The forecast period (2025-2033) anticipates sustained growth driven by expanding applications, technological improvements, and increased investment in research and development. The projected Compound Annual Growth Rate (CAGR) of 8.20% indicates a significant market expansion over the coming years.
Spatial Genomics and Transcriptomics Market: A Comprehensive Report (2019-2033)
This comprehensive report provides a detailed analysis of the Spatial Genomics and Transcriptomics market, encompassing market dynamics, growth trends, regional segmentation, product landscape, key players, and future outlook. The study period covers 2019-2033, with 2025 as the base and estimated year, and a forecast period of 2025-2033. The historical period analyzed is 2019-2024. The market is segmented by technology (Spatial Transcriptomics, Spatial Genomics), product (Instruments, Software, Consumables), and end-user (Pharmaceutical Manufacturers, Diagnostic Customers, Others). Key players analyzed include Akoya Biosciences Inc, 10x Genomics, Advanced Cell Diagnostics Inc (ACD), Naterac Inc, Bio-Techne, Illumina Inc, Fluidigm, S2 Genomics Inc, Seven Bridges Genomics, Dovetail Genomics, NanoString Technologies Inc, and Horizon Discovery Group plc. This report is crucial for investors, researchers, and industry professionals seeking in-depth insights into this rapidly evolving field.
Spatial Genomics and Transcriptomics Market Market Dynamics & Structure
The Spatial Genomics and Transcriptomics market is characterized by moderate concentration, with a few dominant players and numerous smaller companies vying for market share. Technological innovation is a significant driver, with ongoing advancements in sequencing technologies, imaging techniques, and data analysis software pushing market growth. Stringent regulatory frameworks, particularly concerning diagnostic applications, influence market access and adoption. Competitive product substitutes, such as traditional gene expression profiling methods, continue to pose challenges. The end-user demographic is diverse, including pharmaceutical manufacturers, diagnostic companies, and research institutions, each with specific needs and adoption rates. M&A activity has been moderate, indicating a dynamic landscape with consolidation and strategic partnerships shaping market structure.
- Market Concentration: Moderate, with top 5 players holding approximately xx% market share in 2025.
- Technological Innovation: Rapid advancements in NGS, image analysis, and bioinformatics are key drivers.
- Regulatory Framework: Stringent regulations, especially for diagnostic applications, impact market entry and growth.
- Competitive Substitutes: Traditional gene expression analysis methods create competitive pressure.
- End-User Demographics: Pharmaceutical manufacturers, diagnostic labs, and academic research institutions are key end-users.
- M&A Trends: Moderate M&A activity, with xx deals recorded between 2019 and 2024.
Spatial Genomics and Transcriptomics Market Growth Trends & Insights
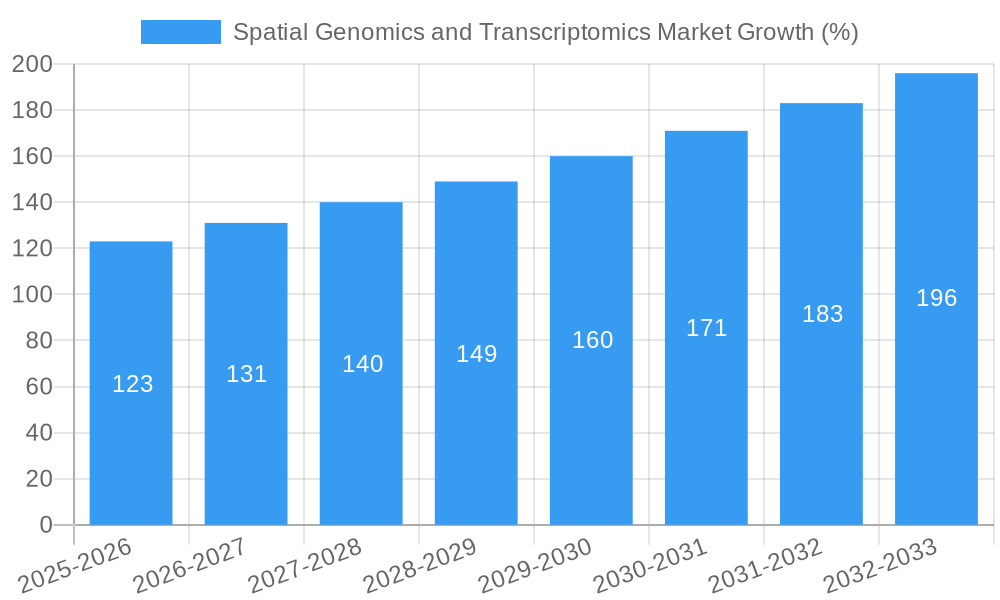
The Spatial Genomics and Transcriptomics market experienced substantial growth during the historical period (2019-2024), with a CAGR of xx%. This growth is primarily attributed to the increasing adoption of spatial omics technologies in biomedical research and drug discovery. Technological advancements, such as the development of higher-throughput and more cost-effective platforms, have further fueled market expansion. The market is expected to continue its robust growth trajectory during the forecast period (2025-2033), with a projected CAGR of xx%, driven by the rising prevalence of chronic diseases, increased investment in R&D, and growing demand for personalized medicine. Adoption rates are increasing across various end-user segments, particularly in the pharmaceutical and diagnostic sectors. Emerging technologies, such as single-cell spatial omics, are poised to disrupt the market further. Shifting consumer preferences towards more precise and efficient diagnostic and therapeutic approaches are also contributing to market growth. Market penetration is expected to reach xx% by 2033. The total market size is projected to reach $xx Million by 2033.
Dominant Regions, Countries, or Segments in Spatial Genomics and Transcriptomics Market
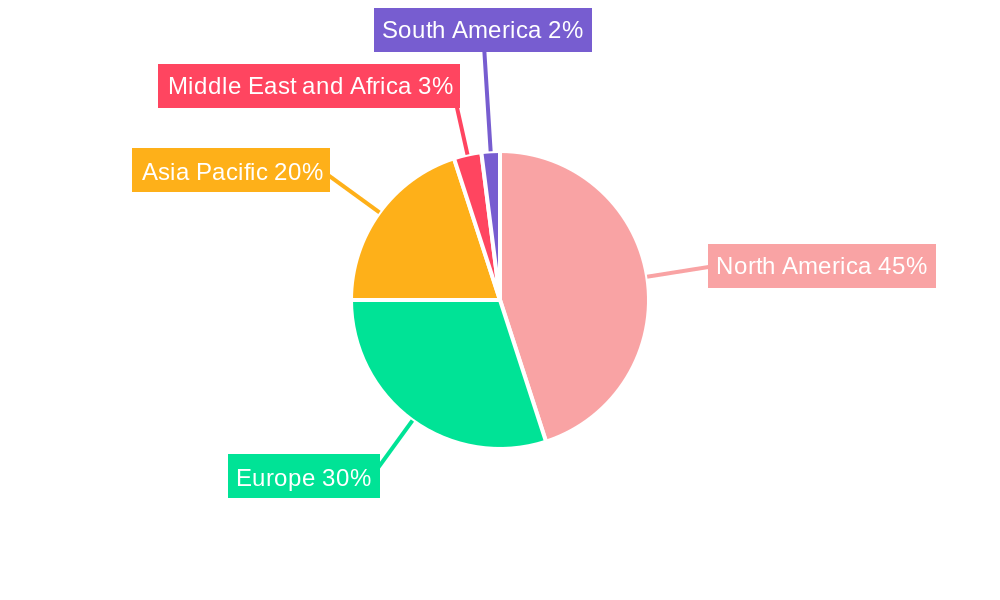
North America currently dominates the Spatial Genomics and Transcriptomics market, holding the largest market share (xx%) in 2025, driven by robust funding for research and development, presence of major industry players and well-established healthcare infrastructure. Europe follows as the second-largest market, exhibiting significant growth potential due to increasing investments in healthcare research. Within the segments, the Spatial Transcriptomics technology segment is currently experiencing faster growth compared to Spatial Genomics, primarily due to its relatively lower cost and easier accessibility. The Instruments segment holds the largest share within the product category, followed by Consumables and Software. Pharmaceutical manufacturers account for the majority of end-user spending due to the high demand for targeted therapies and precision medicine.
- North America: Strong R&D investments, presence of key players, and advanced healthcare infrastructure.
- Europe: Growing healthcare expenditure and increasing adoption of advanced technologies.
- Asia-Pacific: Rapid technological advancements and increasing prevalence of chronic diseases contribute to growth.
- Spatial Transcriptomics: Faster growth due to lower cost and wider accessibility.
- Instruments: Largest product segment driven by high demand for advanced platforms.
- Pharmaceutical Manufacturers: Largest end-user segment due to demand for targeted therapies.
Spatial Genomics and Transcriptomics Market Product Landscape
The Spatial Genomics and Transcriptomics market offers a diverse range of products, including high-throughput sequencing platforms, advanced imaging systems, comprehensive data analysis software, and specialized consumables. Recent innovations have focused on enhancing throughput, improving resolution, and reducing costs. Unique selling propositions include high-plexity analysis, single-cell resolution, and integrated workflow solutions. Technological advancements have enabled the integration of multiple omics technologies, allowing for a more holistic understanding of biological systems. The market witnesses an increasing trend towards user-friendly software and cloud-based solutions for data analysis and interpretation.
Key Drivers, Barriers & Challenges in Spatial Genomics and Transcriptomics Market
Key Drivers:
- Technological advancements in sequencing, imaging, and data analysis.
- Growing demand for personalized medicine and precision diagnostics.
- Increased funding for biomedical research and drug discovery.
Key Challenges & Restraints:
- High cost of instruments and consumables limiting accessibility.
- Complex data analysis requiring specialized expertise and computational resources.
- Regulatory hurdles for diagnostic applications and data privacy.
- Intense competition among established and emerging players.
Emerging Opportunities in Spatial Genomics and Transcriptomics Market
- Expanding applications in oncology, immunology, and neuroscience.
- Development of novel spatial omics technologies with higher throughput and resolution.
- Integration of artificial intelligence and machine learning for data analysis.
- Growing demand for spatial omics services and contract research organizations.
Growth Accelerators in the Spatial Genomics and Transcriptomics Market Industry
The Spatial Genomics and Transcriptomics market is poised for sustained growth, fueled by continuous technological breakthroughs leading to more efficient and affordable platforms. Strategic partnerships between technology providers and pharmaceutical companies are accelerating the adoption of spatial omics in drug development. Expansion into new clinical applications and the development of user-friendly analysis tools are also expected to drive substantial market expansion.
Key Players Shaping the Spatial Genomics and Transcriptomics Market Market
- Akoya Biosciences Inc
- 10x Genomics
- Advanced Cell Diagnostics Inc (ACD)
- Naterac Inc
- Bio-Techne
- Illumina Inc
- Fluidigm
- S2 Genomics Inc
- Seven Bridges Genomics
- Dovetail Genomics
- NanoString Technologies Inc
- Horizon Discovery Group plc
Notable Milestones in Spatial Genomics and Transcriptomics Market Sector
- May 2022: NanoString announced a seamless, cloud-based workflow improving spatial data analysis for Illumina NextSeq systems and the GeoMx Digital Spatial Profiler, facilitating spatial biology research using next-generation sequencing.
- January 2022: Illumina Inc. and Nashville Biosciences LLC partnered to utilize Illumina's NGS platforms for clinical genomic resource establishment and accelerating new medicine development.
In-Depth Spatial Genomics and Transcriptomics Market Market Outlook
The future of the Spatial Genomics and Transcriptomics market is exceptionally bright, with significant growth potential driven by ongoing technological advancements, strategic partnerships, and expanding applications across various sectors. The market is expected to witness substantial growth, driven by increased demand for precise diagnostic and therapeutic tools and the adoption of spatial omics across various research domains and clinical settings. Strategic investments in R&D, coupled with the development of more accessible and cost-effective technologies, will further accelerate market growth, creating substantial opportunities for both established and emerging players.
Spatial Genomics and Transcriptomics Market Segmentation
-
1. Technology
- 1.1. Spatial Transcriptomics
- 1.2. Spatial Genomics
-
2. Product
- 2.1. Instruments
- 2.2. Software
- 2.3. Consumables
-
3. End-User
- 3.1. Pharmaceutical Manufacturer
- 3.2. Diagnostic Customers
- 3.3. Others
Spatial Genomics and Transcriptomics Market Segmentation By Geography
-
1. North America
- 1.1. United States
- 1.2. Canada
- 1.3. Mexico
-
2. Europe
- 2.1. Germany
- 2.2. United Kingdom
- 2.3. France
- 2.4. Italy
- 2.5. Spain
- 2.6. Rest of Europe
-
3. Asia Pacific
- 3.1. China
- 3.2. Japan
- 3.3. India
- 3.4. Australia
- 3.5. South Korea
- 3.6. Rest of Asia Pacific
-
4. Middle East and Africa
- 4.1. GCC
- 4.2. South Africa
- 4.3. Rest of Middle East and Africa
-
5. South America
- 5.1. Brazil
- 5.2. Argentina
- 5.3. Rest of South America
Spatial Genomics and Transcriptomics Market REPORT HIGHLIGHTS
| Aspects | Details |
|---|---|
| Study Period | 2019-2033 |
| Base Year | 2024 |
| Estimated Year | 2025 |
| Forecast Period | 2025-2033 |
| Historical Period | 2019-2024 |
| Growth Rate | CAGR of 8.20% from 2019-2033 |
| Segmentation |
|
Table of Contents
- 1. Introduction
- 1.1. Research Scope
- 1.2. Market Segmentation
- 1.3. Research Methodology
- 1.4. Definitions and Assumptions
- 2. Executive Summary
- 2.1. Introduction
- 3. Market Dynamics
- 3.1. Introduction
- 3.2. Market Drivers
- 3.2.1. Emerging Potential of Spatial Genomic Analysis as Cancer Diagnostic Tool; Increasing Advanced Technologies of Spatial Genomics and Transcriptomics; Advent of Fourth Generation of Sequencing
- 3.3. Market Restrains
- 3.3.1. Slow Implementation of Technology; Well-Established Workflows for Conventional Genomics and Transcriptomics Analysis
- 3.4. Market Trends
- 3.4.1. Consumables Segment is Expected to Witness Healthy Growth During the Forecast Period
- 4. Market Factor Analysis
- 4.1. Porters Five Forces
- 4.2. Supply/Value Chain
- 4.3. PESTEL analysis
- 4.4. Market Entropy
- 4.5. Patent/Trademark Analysis
- 5. Global Spatial Genomics and Transcriptomics Market Analysis, Insights and Forecast, 2019-2031
- 5.1. Market Analysis, Insights and Forecast - by Technology
- 5.1.1. Spatial Transcriptomics
- 5.1.2. Spatial Genomics
- 5.2. Market Analysis, Insights and Forecast - by Product
- 5.2.1. Instruments
- 5.2.2. Software
- 5.2.3. Consumables
- 5.3. Market Analysis, Insights and Forecast - by End-User
- 5.3.1. Pharmaceutical Manufacturer
- 5.3.2. Diagnostic Customers
- 5.3.3. Others
- 5.4. Market Analysis, Insights and Forecast - by Region
- 5.4.1. North America
- 5.4.2. Europe
- 5.4.3. Asia Pacific
- 5.4.4. Middle East and Africa
- 5.4.5. South America
- 5.1. Market Analysis, Insights and Forecast - by Technology
- 6. North America Spatial Genomics and Transcriptomics Market Analysis, Insights and Forecast, 2019-2031
- 6.1. Market Analysis, Insights and Forecast - by Technology
- 6.1.1. Spatial Transcriptomics
- 6.1.2. Spatial Genomics
- 6.2. Market Analysis, Insights and Forecast - by Product
- 6.2.1. Instruments
- 6.2.2. Software
- 6.2.3. Consumables
- 6.3. Market Analysis, Insights and Forecast - by End-User
- 6.3.1. Pharmaceutical Manufacturer
- 6.3.2. Diagnostic Customers
- 6.3.3. Others
- 6.1. Market Analysis, Insights and Forecast - by Technology
- 7. Europe Spatial Genomics and Transcriptomics Market Analysis, Insights and Forecast, 2019-2031
- 7.1. Market Analysis, Insights and Forecast - by Technology
- 7.1.1. Spatial Transcriptomics
- 7.1.2. Spatial Genomics
- 7.2. Market Analysis, Insights and Forecast - by Product
- 7.2.1. Instruments
- 7.2.2. Software
- 7.2.3. Consumables
- 7.3. Market Analysis, Insights and Forecast - by End-User
- 7.3.1. Pharmaceutical Manufacturer
- 7.3.2. Diagnostic Customers
- 7.3.3. Others
- 7.1. Market Analysis, Insights and Forecast - by Technology
- 8. Asia Pacific Spatial Genomics and Transcriptomics Market Analysis, Insights and Forecast, 2019-2031
- 8.1. Market Analysis, Insights and Forecast - by Technology
- 8.1.1. Spatial Transcriptomics
- 8.1.2. Spatial Genomics
- 8.2. Market Analysis, Insights and Forecast - by Product
- 8.2.1. Instruments
- 8.2.2. Software
- 8.2.3. Consumables
- 8.3. Market Analysis, Insights and Forecast - by End-User
- 8.3.1. Pharmaceutical Manufacturer
- 8.3.2. Diagnostic Customers
- 8.3.3. Others
- 8.1. Market Analysis, Insights and Forecast - by Technology
- 9. Middle East and Africa Spatial Genomics and Transcriptomics Market Analysis, Insights and Forecast, 2019-2031
- 9.1. Market Analysis, Insights and Forecast - by Technology
- 9.1.1. Spatial Transcriptomics
- 9.1.2. Spatial Genomics
- 9.2. Market Analysis, Insights and Forecast - by Product
- 9.2.1. Instruments
- 9.2.2. Software
- 9.2.3. Consumables
- 9.3. Market Analysis, Insights and Forecast - by End-User
- 9.3.1. Pharmaceutical Manufacturer
- 9.3.2. Diagnostic Customers
- 9.3.3. Others
- 9.1. Market Analysis, Insights and Forecast - by Technology
- 10. South America Spatial Genomics and Transcriptomics Market Analysis, Insights and Forecast, 2019-2031
- 10.1. Market Analysis, Insights and Forecast - by Technology
- 10.1.1. Spatial Transcriptomics
- 10.1.2. Spatial Genomics
- 10.2. Market Analysis, Insights and Forecast - by Product
- 10.2.1. Instruments
- 10.2.2. Software
- 10.2.3. Consumables
- 10.3. Market Analysis, Insights and Forecast - by End-User
- 10.3.1. Pharmaceutical Manufacturer
- 10.3.2. Diagnostic Customers
- 10.3.3. Others
- 10.1. Market Analysis, Insights and Forecast - by Technology
- 11. North America Spatial Genomics and Transcriptomics Market Analysis, Insights and Forecast, 2019-2031
- 11.1. Market Analysis, Insights and Forecast - By Country/Sub-region
- 11.1.1 United States
- 11.1.2 Canada
- 11.1.3 Mexico
- 12. Europe Spatial Genomics and Transcriptomics Market Analysis, Insights and Forecast, 2019-2031
- 12.1. Market Analysis, Insights and Forecast - By Country/Sub-region
- 12.1.1 Germany
- 12.1.2 United Kingdom
- 12.1.3 France
- 12.1.4 Italy
- 12.1.5 Spain
- 12.1.6 Rest of Europe
- 13. Asia Pacific Spatial Genomics and Transcriptomics Market Analysis, Insights and Forecast, 2019-2031
- 13.1. Market Analysis, Insights and Forecast - By Country/Sub-region
- 13.1.1 China
- 13.1.2 Japan
- 13.1.3 India
- 13.1.4 Australia
- 13.1.5 South Korea
- 13.1.6 Rest of Asia Pacific
- 14. Middle East and Africa Spatial Genomics and Transcriptomics Market Analysis, Insights and Forecast, 2019-2031
- 14.1. Market Analysis, Insights and Forecast - By Country/Sub-region
- 14.1.1 GCC
- 14.1.2 South Africa
- 14.1.3 Rest of Middle East and Africa
- 15. South America Spatial Genomics and Transcriptomics Market Analysis, Insights and Forecast, 2019-2031
- 15.1. Market Analysis, Insights and Forecast - By Country/Sub-region
- 15.1.1 Brazil
- 15.1.2 Argentina
- 15.1.3 Rest of South America
- 16. Competitive Analysis
- 16.1. Global Market Share Analysis 2024
- 16.2. Company Profiles
- 16.2.1 Akoya Biosciences Inc
- 16.2.1.1. Overview
- 16.2.1.2. Products
- 16.2.1.3. SWOT Analysis
- 16.2.1.4. Recent Developments
- 16.2.1.5. Financials (Based on Availability)
- 16.2.2 10x Genomics
- 16.2.2.1. Overview
- 16.2.2.2. Products
- 16.2.2.3. SWOT Analysis
- 16.2.2.4. Recent Developments
- 16.2.2.5. Financials (Based on Availability)
- 16.2.3 Advanced Cell Diagnostics Inc (ACD)
- 16.2.3.1. Overview
- 16.2.3.2. Products
- 16.2.3.3. SWOT Analysis
- 16.2.3.4. Recent Developments
- 16.2.3.5. Financials (Based on Availability)
- 16.2.4 Naterac Inc
- 16.2.4.1. Overview
- 16.2.4.2. Products
- 16.2.4.3. SWOT Analysis
- 16.2.4.4. Recent Developments
- 16.2.4.5. Financials (Based on Availability)
- 16.2.5 Bio-Techne
- 16.2.5.1. Overview
- 16.2.5.2. Products
- 16.2.5.3. SWOT Analysis
- 16.2.5.4. Recent Developments
- 16.2.5.5. Financials (Based on Availability)
- 16.2.6 Illumina Inc
- 16.2.6.1. Overview
- 16.2.6.2. Products
- 16.2.6.3. SWOT Analysis
- 16.2.6.4. Recent Developments
- 16.2.6.5. Financials (Based on Availability)
- 16.2.7 Fluidigm
- 16.2.7.1. Overview
- 16.2.7.2. Products
- 16.2.7.3. SWOT Analysis
- 16.2.7.4. Recent Developments
- 16.2.7.5. Financials (Based on Availability)
- 16.2.8 S2 Genomics Inc
- 16.2.8.1. Overview
- 16.2.8.2. Products
- 16.2.8.3. SWOT Analysis
- 16.2.8.4. Recent Developments
- 16.2.8.5. Financials (Based on Availability)
- 16.2.9 Seven Bridges Genomics*List Not Exhaustive
- 16.2.9.1. Overview
- 16.2.9.2. Products
- 16.2.9.3. SWOT Analysis
- 16.2.9.4. Recent Developments
- 16.2.9.5. Financials (Based on Availability)
- 16.2.10 Dovetail Genomics
- 16.2.10.1. Overview
- 16.2.10.2. Products
- 16.2.10.3. SWOT Analysis
- 16.2.10.4. Recent Developments
- 16.2.10.5. Financials (Based on Availability)
- 16.2.11 NanoString Technologies Inc
- 16.2.11.1. Overview
- 16.2.11.2. Products
- 16.2.11.3. SWOT Analysis
- 16.2.11.4. Recent Developments
- 16.2.11.5. Financials (Based on Availability)
- 16.2.12 Horizon Discovery Group plc
- 16.2.12.1. Overview
- 16.2.12.2. Products
- 16.2.12.3. SWOT Analysis
- 16.2.12.4. Recent Developments
- 16.2.12.5. Financials (Based on Availability)
- 16.2.1 Akoya Biosciences Inc
List of Figures
- Figure 1: Global Spatial Genomics and Transcriptomics Market Revenue Breakdown (Million, %) by Region 2024 & 2032
- Figure 2: North America Spatial Genomics and Transcriptomics Market Revenue (Million), by Country 2024 & 2032
- Figure 3: North America Spatial Genomics and Transcriptomics Market Revenue Share (%), by Country 2024 & 2032
- Figure 4: Europe Spatial Genomics and Transcriptomics Market Revenue (Million), by Country 2024 & 2032
- Figure 5: Europe Spatial Genomics and Transcriptomics Market Revenue Share (%), by Country 2024 & 2032
- Figure 6: Asia Pacific Spatial Genomics and Transcriptomics Market Revenue (Million), by Country 2024 & 2032
- Figure 7: Asia Pacific Spatial Genomics and Transcriptomics Market Revenue Share (%), by Country 2024 & 2032
- Figure 8: Middle East and Africa Spatial Genomics and Transcriptomics Market Revenue (Million), by Country 2024 & 2032
- Figure 9: Middle East and Africa Spatial Genomics and Transcriptomics Market Revenue Share (%), by Country 2024 & 2032
- Figure 10: South America Spatial Genomics and Transcriptomics Market Revenue (Million), by Country 2024 & 2032
- Figure 11: South America Spatial Genomics and Transcriptomics Market Revenue Share (%), by Country 2024 & 2032
- Figure 12: North America Spatial Genomics and Transcriptomics Market Revenue (Million), by Technology 2024 & 2032
- Figure 13: North America Spatial Genomics and Transcriptomics Market Revenue Share (%), by Technology 2024 & 2032
- Figure 14: North America Spatial Genomics and Transcriptomics Market Revenue (Million), by Product 2024 & 2032
- Figure 15: North America Spatial Genomics and Transcriptomics Market Revenue Share (%), by Product 2024 & 2032
- Figure 16: North America Spatial Genomics and Transcriptomics Market Revenue (Million), by End-User 2024 & 2032
- Figure 17: North America Spatial Genomics and Transcriptomics Market Revenue Share (%), by End-User 2024 & 2032
- Figure 18: North America Spatial Genomics and Transcriptomics Market Revenue (Million), by Country 2024 & 2032
- Figure 19: North America Spatial Genomics and Transcriptomics Market Revenue Share (%), by Country 2024 & 2032
- Figure 20: Europe Spatial Genomics and Transcriptomics Market Revenue (Million), by Technology 2024 & 2032
- Figure 21: Europe Spatial Genomics and Transcriptomics Market Revenue Share (%), by Technology 2024 & 2032
- Figure 22: Europe Spatial Genomics and Transcriptomics Market Revenue (Million), by Product 2024 & 2032
- Figure 23: Europe Spatial Genomics and Transcriptomics Market Revenue Share (%), by Product 2024 & 2032
- Figure 24: Europe Spatial Genomics and Transcriptomics Market Revenue (Million), by End-User 2024 & 2032
- Figure 25: Europe Spatial Genomics and Transcriptomics Market Revenue Share (%), by End-User 2024 & 2032
- Figure 26: Europe Spatial Genomics and Transcriptomics Market Revenue (Million), by Country 2024 & 2032
- Figure 27: Europe Spatial Genomics and Transcriptomics Market Revenue Share (%), by Country 2024 & 2032
- Figure 28: Asia Pacific Spatial Genomics and Transcriptomics Market Revenue (Million), by Technology 2024 & 2032
- Figure 29: Asia Pacific Spatial Genomics and Transcriptomics Market Revenue Share (%), by Technology 2024 & 2032
- Figure 30: Asia Pacific Spatial Genomics and Transcriptomics Market Revenue (Million), by Product 2024 & 2032
- Figure 31: Asia Pacific Spatial Genomics and Transcriptomics Market Revenue Share (%), by Product 2024 & 2032
- Figure 32: Asia Pacific Spatial Genomics and Transcriptomics Market Revenue (Million), by End-User 2024 & 2032
- Figure 33: Asia Pacific Spatial Genomics and Transcriptomics Market Revenue Share (%), by End-User 2024 & 2032
- Figure 34: Asia Pacific Spatial Genomics and Transcriptomics Market Revenue (Million), by Country 2024 & 2032
- Figure 35: Asia Pacific Spatial Genomics and Transcriptomics Market Revenue Share (%), by Country 2024 & 2032
- Figure 36: Middle East and Africa Spatial Genomics and Transcriptomics Market Revenue (Million), by Technology 2024 & 2032
- Figure 37: Middle East and Africa Spatial Genomics and Transcriptomics Market Revenue Share (%), by Technology 2024 & 2032
- Figure 38: Middle East and Africa Spatial Genomics and Transcriptomics Market Revenue (Million), by Product 2024 & 2032
- Figure 39: Middle East and Africa Spatial Genomics and Transcriptomics Market Revenue Share (%), by Product 2024 & 2032
- Figure 40: Middle East and Africa Spatial Genomics and Transcriptomics Market Revenue (Million), by End-User 2024 & 2032
- Figure 41: Middle East and Africa Spatial Genomics and Transcriptomics Market Revenue Share (%), by End-User 2024 & 2032
- Figure 42: Middle East and Africa Spatial Genomics and Transcriptomics Market Revenue (Million), by Country 2024 & 2032
- Figure 43: Middle East and Africa Spatial Genomics and Transcriptomics Market Revenue Share (%), by Country 2024 & 2032
- Figure 44: South America Spatial Genomics and Transcriptomics Market Revenue (Million), by Technology 2024 & 2032
- Figure 45: South America Spatial Genomics and Transcriptomics Market Revenue Share (%), by Technology 2024 & 2032
- Figure 46: South America Spatial Genomics and Transcriptomics Market Revenue (Million), by Product 2024 & 2032
- Figure 47: South America Spatial Genomics and Transcriptomics Market Revenue Share (%), by Product 2024 & 2032
- Figure 48: South America Spatial Genomics and Transcriptomics Market Revenue (Million), by End-User 2024 & 2032
- Figure 49: South America Spatial Genomics and Transcriptomics Market Revenue Share (%), by End-User 2024 & 2032
- Figure 50: South America Spatial Genomics and Transcriptomics Market Revenue (Million), by Country 2024 & 2032
- Figure 51: South America Spatial Genomics and Transcriptomics Market Revenue Share (%), by Country 2024 & 2032
List of Tables
- Table 1: Global Spatial Genomics and Transcriptomics Market Revenue Million Forecast, by Region 2019 & 2032
- Table 2: Global Spatial Genomics and Transcriptomics Market Revenue Million Forecast, by Technology 2019 & 2032
- Table 3: Global Spatial Genomics and Transcriptomics Market Revenue Million Forecast, by Product 2019 & 2032
- Table 4: Global Spatial Genomics and Transcriptomics Market Revenue Million Forecast, by End-User 2019 & 2032
- Table 5: Global Spatial Genomics and Transcriptomics Market Revenue Million Forecast, by Region 2019 & 2032
- Table 6: Global Spatial Genomics and Transcriptomics Market Revenue Million Forecast, by Country 2019 & 2032
- Table 7: United States Spatial Genomics and Transcriptomics Market Revenue (Million) Forecast, by Application 2019 & 2032
- Table 8: Canada Spatial Genomics and Transcriptomics Market Revenue (Million) Forecast, by Application 2019 & 2032
- Table 9: Mexico Spatial Genomics and Transcriptomics Market Revenue (Million) Forecast, by Application 2019 & 2032
- Table 10: Global Spatial Genomics and Transcriptomics Market Revenue Million Forecast, by Country 2019 & 2032
- Table 11: Germany Spatial Genomics and Transcriptomics Market Revenue (Million) Forecast, by Application 2019 & 2032
- Table 12: United Kingdom Spatial Genomics and Transcriptomics Market Revenue (Million) Forecast, by Application 2019 & 2032
- Table 13: France Spatial Genomics and Transcriptomics Market Revenue (Million) Forecast, by Application 2019 & 2032
- Table 14: Italy Spatial Genomics and Transcriptomics Market Revenue (Million) Forecast, by Application 2019 & 2032
- Table 15: Spain Spatial Genomics and Transcriptomics Market Revenue (Million) Forecast, by Application 2019 & 2032
- Table 16: Rest of Europe Spatial Genomics and Transcriptomics Market Revenue (Million) Forecast, by Application 2019 & 2032
- Table 17: Global Spatial Genomics and Transcriptomics Market Revenue Million Forecast, by Country 2019 & 2032
- Table 18: China Spatial Genomics and Transcriptomics Market Revenue (Million) Forecast, by Application 2019 & 2032
- Table 19: Japan Spatial Genomics and Transcriptomics Market Revenue (Million) Forecast, by Application 2019 & 2032
- Table 20: India Spatial Genomics and Transcriptomics Market Revenue (Million) Forecast, by Application 2019 & 2032
- Table 21: Australia Spatial Genomics and Transcriptomics Market Revenue (Million) Forecast, by Application 2019 & 2032
- Table 22: South Korea Spatial Genomics and Transcriptomics Market Revenue (Million) Forecast, by Application 2019 & 2032
- Table 23: Rest of Asia Pacific Spatial Genomics and Transcriptomics Market Revenue (Million) Forecast, by Application 2019 & 2032
- Table 24: Global Spatial Genomics and Transcriptomics Market Revenue Million Forecast, by Country 2019 & 2032
- Table 25: GCC Spatial Genomics and Transcriptomics Market Revenue (Million) Forecast, by Application 2019 & 2032
- Table 26: South Africa Spatial Genomics and Transcriptomics Market Revenue (Million) Forecast, by Application 2019 & 2032
- Table 27: Rest of Middle East and Africa Spatial Genomics and Transcriptomics Market Revenue (Million) Forecast, by Application 2019 & 2032
- Table 28: Global Spatial Genomics and Transcriptomics Market Revenue Million Forecast, by Country 2019 & 2032
- Table 29: Brazil Spatial Genomics and Transcriptomics Market Revenue (Million) Forecast, by Application 2019 & 2032
- Table 30: Argentina Spatial Genomics and Transcriptomics Market Revenue (Million) Forecast, by Application 2019 & 2032
- Table 31: Rest of South America Spatial Genomics and Transcriptomics Market Revenue (Million) Forecast, by Application 2019 & 2032
- Table 32: Global Spatial Genomics and Transcriptomics Market Revenue Million Forecast, by Technology 2019 & 2032
- Table 33: Global Spatial Genomics and Transcriptomics Market Revenue Million Forecast, by Product 2019 & 2032
- Table 34: Global Spatial Genomics and Transcriptomics Market Revenue Million Forecast, by End-User 2019 & 2032
- Table 35: Global Spatial Genomics and Transcriptomics Market Revenue Million Forecast, by Country 2019 & 2032
- Table 36: United States Spatial Genomics and Transcriptomics Market Revenue (Million) Forecast, by Application 2019 & 2032
- Table 37: Canada Spatial Genomics and Transcriptomics Market Revenue (Million) Forecast, by Application 2019 & 2032
- Table 38: Mexico Spatial Genomics and Transcriptomics Market Revenue (Million) Forecast, by Application 2019 & 2032
- Table 39: Global Spatial Genomics and Transcriptomics Market Revenue Million Forecast, by Technology 2019 & 2032
- Table 40: Global Spatial Genomics and Transcriptomics Market Revenue Million Forecast, by Product 2019 & 2032
- Table 41: Global Spatial Genomics and Transcriptomics Market Revenue Million Forecast, by End-User 2019 & 2032
- Table 42: Global Spatial Genomics and Transcriptomics Market Revenue Million Forecast, by Country 2019 & 2032
- Table 43: Germany Spatial Genomics and Transcriptomics Market Revenue (Million) Forecast, by Application 2019 & 2032
- Table 44: United Kingdom Spatial Genomics and Transcriptomics Market Revenue (Million) Forecast, by Application 2019 & 2032
- Table 45: France Spatial Genomics and Transcriptomics Market Revenue (Million) Forecast, by Application 2019 & 2032
- Table 46: Italy Spatial Genomics and Transcriptomics Market Revenue (Million) Forecast, by Application 2019 & 2032
- Table 47: Spain Spatial Genomics and Transcriptomics Market Revenue (Million) Forecast, by Application 2019 & 2032
- Table 48: Rest of Europe Spatial Genomics and Transcriptomics Market Revenue (Million) Forecast, by Application 2019 & 2032
- Table 49: Global Spatial Genomics and Transcriptomics Market Revenue Million Forecast, by Technology 2019 & 2032
- Table 50: Global Spatial Genomics and Transcriptomics Market Revenue Million Forecast, by Product 2019 & 2032
- Table 51: Global Spatial Genomics and Transcriptomics Market Revenue Million Forecast, by End-User 2019 & 2032
- Table 52: Global Spatial Genomics and Transcriptomics Market Revenue Million Forecast, by Country 2019 & 2032
- Table 53: China Spatial Genomics and Transcriptomics Market Revenue (Million) Forecast, by Application 2019 & 2032
- Table 54: Japan Spatial Genomics and Transcriptomics Market Revenue (Million) Forecast, by Application 2019 & 2032
- Table 55: India Spatial Genomics and Transcriptomics Market Revenue (Million) Forecast, by Application 2019 & 2032
- Table 56: Australia Spatial Genomics and Transcriptomics Market Revenue (Million) Forecast, by Application 2019 & 2032
- Table 57: South Korea Spatial Genomics and Transcriptomics Market Revenue (Million) Forecast, by Application 2019 & 2032
- Table 58: Rest of Asia Pacific Spatial Genomics and Transcriptomics Market Revenue (Million) Forecast, by Application 2019 & 2032
- Table 59: Global Spatial Genomics and Transcriptomics Market Revenue Million Forecast, by Technology 2019 & 2032
- Table 60: Global Spatial Genomics and Transcriptomics Market Revenue Million Forecast, by Product 2019 & 2032
- Table 61: Global Spatial Genomics and Transcriptomics Market Revenue Million Forecast, by End-User 2019 & 2032
- Table 62: Global Spatial Genomics and Transcriptomics Market Revenue Million Forecast, by Country 2019 & 2032
- Table 63: GCC Spatial Genomics and Transcriptomics Market Revenue (Million) Forecast, by Application 2019 & 2032
- Table 64: South Africa Spatial Genomics and Transcriptomics Market Revenue (Million) Forecast, by Application 2019 & 2032
- Table 65: Rest of Middle East and Africa Spatial Genomics and Transcriptomics Market Revenue (Million) Forecast, by Application 2019 & 2032
- Table 66: Global Spatial Genomics and Transcriptomics Market Revenue Million Forecast, by Technology 2019 & 2032
- Table 67: Global Spatial Genomics and Transcriptomics Market Revenue Million Forecast, by Product 2019 & 2032
- Table 68: Global Spatial Genomics and Transcriptomics Market Revenue Million Forecast, by End-User 2019 & 2032
- Table 69: Global Spatial Genomics and Transcriptomics Market Revenue Million Forecast, by Country 2019 & 2032
- Table 70: Brazil Spatial Genomics and Transcriptomics Market Revenue (Million) Forecast, by Application 2019 & 2032
- Table 71: Argentina Spatial Genomics and Transcriptomics Market Revenue (Million) Forecast, by Application 2019 & 2032
- Table 72: Rest of South America Spatial Genomics and Transcriptomics Market Revenue (Million) Forecast, by Application 2019 & 2032
Frequently Asked Questions
1. What is the projected Compound Annual Growth Rate (CAGR) of the Spatial Genomics and Transcriptomics Market?
The projected CAGR is approximately 8.20%.
2. Which companies are prominent players in the Spatial Genomics and Transcriptomics Market?
Key companies in the market include Akoya Biosciences Inc, 10x Genomics, Advanced Cell Diagnostics Inc (ACD), Naterac Inc, Bio-Techne, Illumina Inc, Fluidigm, S2 Genomics Inc, Seven Bridges Genomics*List Not Exhaustive, Dovetail Genomics, NanoString Technologies Inc, Horizon Discovery Group plc.
3. What are the main segments of the Spatial Genomics and Transcriptomics Market?
The market segments include Technology, Product, End-User.
4. Can you provide details about the market size?
The market size is estimated to be USD XX Million as of 2022.
5. What are some drivers contributing to market growth?
Emerging Potential of Spatial Genomic Analysis as Cancer Diagnostic Tool; Increasing Advanced Technologies of Spatial Genomics and Transcriptomics; Advent of Fourth Generation of Sequencing.
6. What are the notable trends driving market growth?
Consumables Segment is Expected to Witness Healthy Growth During the Forecast Period.
7. Are there any restraints impacting market growth?
Slow Implementation of Technology; Well-Established Workflows for Conventional Genomics and Transcriptomics Analysis.
8. Can you provide examples of recent developments in the market?
May 2022: NanoString announced a seamless, cloud-based workflow that improves the spatial data analysis experience of customers using Illumina NextSeq 1000 and NextSeq 2000 sequencing systems and the GeoMx Digital Spatial Profiler to facilitate spatial biology research using next-generation sequencing.
9. What pricing options are available for accessing the report?
Pricing options include single-user, multi-user, and enterprise licenses priced at USD 4750, USD 5250, and USD 8750 respectively.
10. Is the market size provided in terms of value or volume?
The market size is provided in terms of value, measured in Million.
11. Are there any specific market keywords associated with the report?
Yes, the market keyword associated with the report is "Spatial Genomics and Transcriptomics Market," which aids in identifying and referencing the specific market segment covered.
12. How do I determine which pricing option suits my needs best?
The pricing options vary based on user requirements and access needs. Individual users may opt for single-user licenses, while businesses requiring broader access may choose multi-user or enterprise licenses for cost-effective access to the report.
13. Are there any additional resources or data provided in the Spatial Genomics and Transcriptomics Market report?
While the report offers comprehensive insights, it's advisable to review the specific contents or supplementary materials provided to ascertain if additional resources or data are available.
14. How can I stay updated on further developments or reports in the Spatial Genomics and Transcriptomics Market?
To stay informed about further developments, trends, and reports in the Spatial Genomics and Transcriptomics Market, consider subscribing to industry newsletters, following relevant companies and organizations, or regularly checking reputable industry news sources and publications.
Methodology
Step 1 - Identification of Relevant Samples Size from Population Database


Step 2 - Approaches for Defining Global Market Size (Value, Volume* & Price*)

Note*: In applicable scenarios
Step 3 - Data Sources
Primary Research
- Web Analytics
- Survey Reports
- Research Institute
- Latest Research Reports
- Opinion Leaders
Secondary Research
- Annual Reports
- White Paper
- Latest Press Release
- Industry Association
- Paid Database
- Investor Presentations

Step 4 - Data Triangulation
Involves using different sources of information in order to increase the validity of a study
These sources are likely to be stakeholders in a program - participants, other researchers, program staff, other community members, and so on.
Then we put all data in single framework & apply various statistical tools to find out the dynamic on the market.
During the analysis stage, feedback from the stakeholder groups would be compared to determine areas of agreement as well as areas of divergence


