

Key Insights
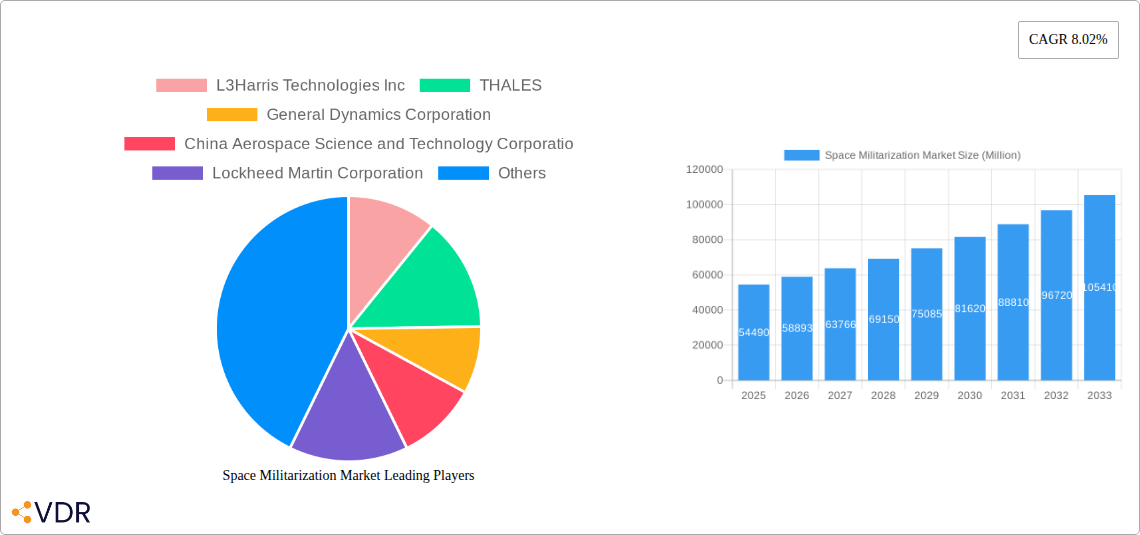
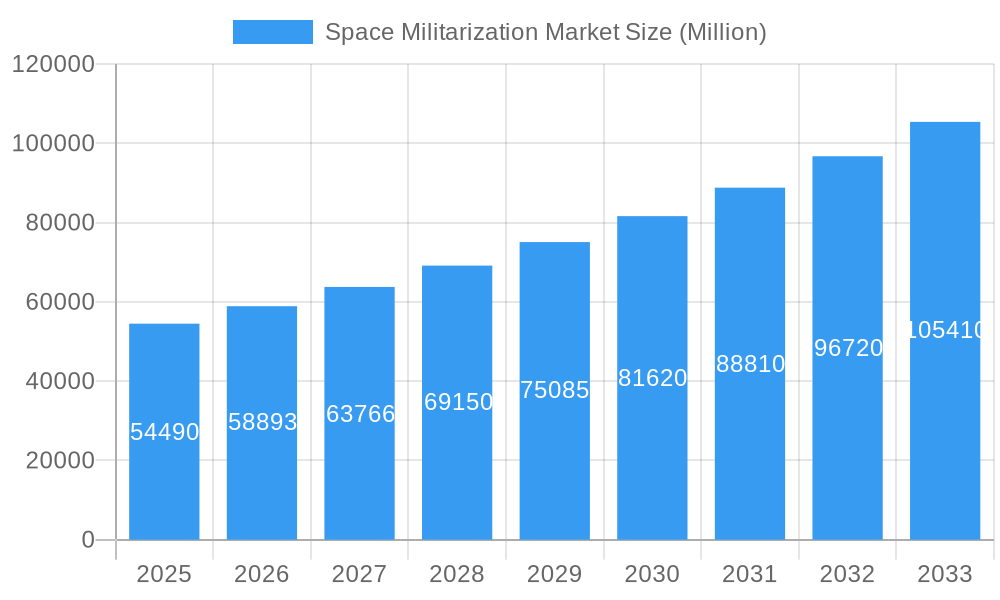
The global space militarization market, valued at $54.49 billion in 2025, is projected to experience robust growth, driven by escalating geopolitical tensions and the increasing need for space-based surveillance, communication, and defense systems. A compound annual growth rate (CAGR) of 8.02% from 2025 to 2033 suggests a significant expansion of this market over the forecast period. Key drivers include the modernization of existing military space assets, the development of advanced anti-satellite (ASAT) weapons, and the growing reliance on space-based intelligence gathering for strategic decision-making. The market is segmented by capability (defense and support) and mode of operation (space-based and ground-based). Major players such as L3Harris Technologies, Thales, General Dynamics, and Lockheed Martin are actively investing in research and development to maintain their competitive edge, leading to continuous technological advancements within the sector. North America currently dominates the market, followed by Europe and the Asia-Pacific region. However, increased space capabilities in nations like China and India are expected to shift the regional landscape significantly over the forecast period.
Space Militarization Market Market Size (In Billion)
The growth in the space militarization market is also influenced by evolving trends such as the miniaturization of satellites, the increased use of artificial intelligence (AI) in space-based systems, and the development of resilient space architectures that are less susceptible to attack. Despite these positive trends, the high cost of space-based technologies and the potential for the escalation of conflict in space act as significant restraints. Regulatory uncertainties and international treaties aimed at limiting space weaponization also influence the market's trajectory. The increasing focus on cybersecurity in space assets will further shape market dynamics, driving demand for robust security solutions. Over the next decade, we anticipate a steady rise in market value, with a significant contribution from government spending on defense and strategic space programs worldwide. The continued development of advanced space technologies, coupled with escalating geopolitical tensions, will likely sustain the high growth trajectory projected for this market.
Space Militarization Market Company Market Share
Space Militarization Market: A Comprehensive Market Report (2019-2033)
This comprehensive report provides an in-depth analysis of the Space Militarization Market, encompassing market dynamics, growth trends, regional dominance, product landscape, key players, and future outlook. The study period covers 2019-2033, with 2025 as the base and estimated year. The forecast period extends from 2025 to 2033, and the historical period analyzed is 2019-2024. The market is segmented by Capability (Defense, Support) and Mode of Operation (Space-based, Ground-based). The total market size in 2025 is estimated at $xx Million.
Space Militarization Market Dynamics & Structure
The Space Militarization market is characterized by a moderately concentrated landscape, with a handful of major players holding significant market share. Market concentration is estimated at xx% in 2025. Technological innovation, particularly in areas like AI, hypersonic weapons, and advanced sensors, is a key driver, while stringent regulatory frameworks and international treaties pose significant challenges. The market experiences competition from emerging technologies focused on cyber warfare and electronic warfare capabilities. End-users primarily consist of national defense agencies and space agencies, with growing adoption by commercial entities for defensive purposes. M&A activity has been moderate, with xx major deals reported in the past five years, primarily focused on technology integration and expansion into new geographical markets.
- Market Concentration: xx% in 2025 (estimated)
- Key Innovation Drivers: AI, hypersonic weapons, advanced sensors, cyber warfare.
- Regulatory Landscape: Stringent international treaties and national regulations.
- Competitive Substitutes: Emerging cyber and electronic warfare technologies.
- M&A Activity: xx major deals in the past 5 years.
- Innovation Barriers: High R&D costs, technological complexity, regulatory hurdles.
Space Militarization Market Growth Trends & Insights
The Space Militarization market is experiencing robust growth, driven by increasing geopolitical tensions, the need for enhanced space-based surveillance and communication, and the development of offensive and defensive space capabilities. The market witnessed a CAGR of xx% during the historical period (2019-2024) and is projected to maintain a CAGR of xx% during the forecast period (2025-2033). This growth is fueled by increased government spending on defense and space programs, coupled with technological advancements enabling smaller, more cost-effective, and agile space systems. The market penetration rate for space-based defense systems is currently estimated at xx% and is projected to reach xx% by 2033. Changes in consumer behavior involve a shift towards more agile and adaptable systems, along with greater reliance on AI and machine learning for autonomous operations.
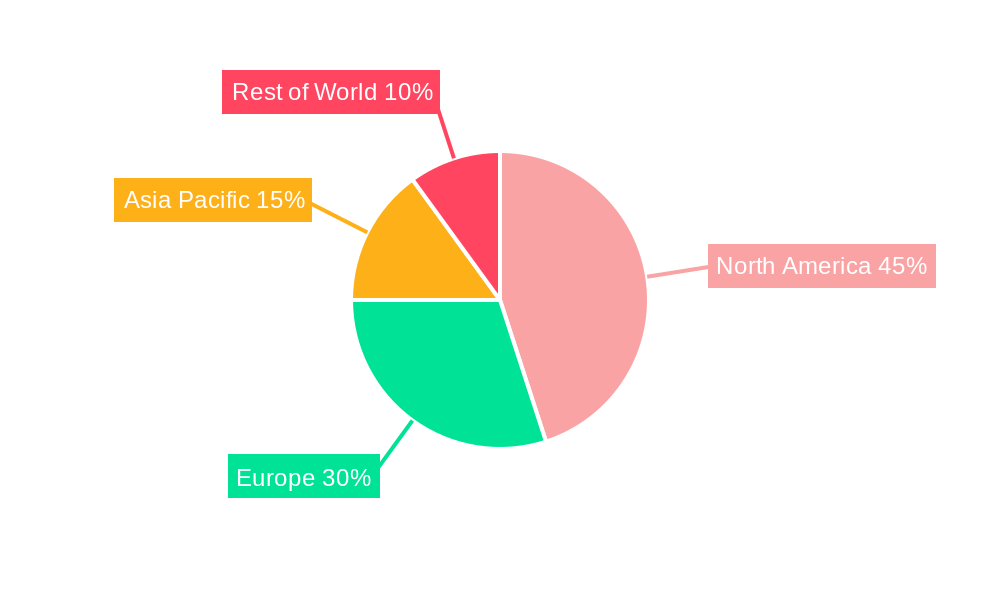
Dominant Regions, Countries, or Segments in Space Militarization Market
The North American region currently commands the largest market share in the space militarization market. This dominance is attributed to significant government investments in advanced space-based defense systems, a highly developed technological infrastructure, and a well-established aerospace and defense ecosystem. Simultaneously, the Asia-Pacific region is exhibiting the most rapid growth trajectory. This surge is primarily fueled by escalating geopolitical tensions, a discernible increase in military spending by key nations such as China and India, and the strategic imperative to bolster national security in the space domain.
- North America: Continues to lead due to substantial government funding for space defense initiatives, unparalleled technological innovation, and a deeply entrenched defense industry. Projected market share: ~40% in 2025.
- Asia-Pacific: Demonstrates the fastest growth, propelled by complex geopolitical dynamics, aggressive military modernization programs, and a growing emphasis on space as a critical national security asset. Projected market share: ~25% in 2025.
- Europe: Maintains a significant market presence, bolstered by strong national defense industries, collaborative European defense projects, and persistent regional security challenges that necessitate robust space capabilities. Projected market share: ~20% in 2025.
- Dominant Segment (Capability): The 'Defense' segment remains the largest, driven by the paramount importance of space assets for military operations, intelligence gathering, and strategic deterrence, leading to substantial government allocation of resources.
- Dominant Segment (Mode of Operation): Space-based systems are the primary focus, offering unparalleled advantages in global surveillance, secure communication networks, and enhanced command and control capabilities essential for modern military operations.
Space Militarization Market Product Landscape
The Space Militarization market is characterized by a sophisticated and expanding array of products designed to secure and enhance operations in the space domain. This includes cutting-edge anti-satellite (ASAT) weapons, advanced space-based sensors for intelligence, surveillance, and reconnaissance (ISR), resilient communication systems, and a suite of defensive countermeasures. Recent product development is intensely focused on miniaturization for greater deployment flexibility, enhanced precision and accuracy, improved intelligence gathering and analytical capabilities through AI and machine learning for autonomous operations, and increased resilience against threats. The key selling propositions of these products center on delivering superior situational awareness, enabling rapid response times to evolving threats, and providing actionable intelligence for strategic decision-making. Technological advancements are particularly concentrated on the integration of artificial intelligence, the development of smaller and more capable satellite platforms, and the creation of robust systems designed to withstand the harsh space environment and potential adversarial actions.
Key Drivers, Barriers & Challenges in Space Militarization Market
Key Drivers: Increased geopolitical instability and strategic competition are primary drivers, alongside the rising demand for enhanced space-based situational awareness and the proliferation of space-based technologies. Government funding and technological innovation are also crucial factors.
Key Barriers & Challenges: High development costs and the complexity of space-based systems create significant barriers to entry. International treaties and arms control agreements pose regulatory hurdles. Supply chain disruptions and the dependence on specific technologies pose further challenges. Competitive pressures from both established players and new entrants also impact market growth.
Emerging Opportunities in Space Militarization Market
The space militarization landscape is ripe with emerging opportunities, driven by evolving threats and technological advancements. A significant area of growth lies in the increasing demand for sophisticated space-based cybersecurity solutions to protect critical national infrastructure and military assets in orbit. The development and deployment of advanced counter-space capabilities, designed to deter or neutralize threats, are also gaining prominence. Furthermore, the integration and adaptation of commercial off-the-shelf (COTS) space technologies for defense applications present a substantial opportunity for cost-effective and rapid capability enhancement. The expansion into novel applications, such as the development of space-based missile defense systems capable of tracking and intercepting ballistic missiles, and the creation of highly autonomous space vehicles for reconnaissance, logistics, and defense, represent significant potential growth frontiers for market participants.
Growth Accelerators in the Space Militarization Market Industry
Technological breakthroughs in areas such as AI, hypersonic weapons, and advanced sensors are driving long-term growth. Strategic partnerships between government agencies and private companies facilitate innovation and accelerate the development and deployment of new space-based systems. Market expansion into new geographical regions, especially in developing countries with increasing military budgets, fuels long-term market expansion.
Key Players Shaping the Space Militarization Market Market
- L3Harris Technologies Inc
- THALES
- General Dynamics Corporation
- China Aerospace Science and Technology Corporation
- Lockheed Martin Corporation
- Airbus SE
- RTX Corporation
- BAE Systems plc
- Northrop Grumman Corporation
- Saab AB
- The Boeing Company
Notable Milestones in Space Militarization Market Sector
- 2020: Successful test of a new anti-satellite weapon by Country X.
- 2021: Launch of a new generation of space-based surveillance satellites by Company Y.
- 2022: Announcement of a major strategic partnership between Company Z and a government agency.
- 2023: Successful deployment of a new space-based laser weapon system by Country A.
- 2024: Merger between two major aerospace companies leading to increased market consolidation.
In-Depth Space Militarization Market Market Outlook
The Space Militarization market is poised for continued robust growth, driven by sustained government investment in space-based defense capabilities and ongoing technological innovation. Strategic partnerships and collaborations between governments and private companies will play a critical role in driving future growth. The development of advanced technologies and new applications will unlock new market opportunities and create significant value for key stakeholders in the coming decade. The market is expected to reach $xx Million by 2033.
Space Militarization Market Segmentation
-
1. Capability
- 1.1. Defense
- 1.2. Support
-
2. Mode of Operation
- 2.1. Space-based
- 2.2. Ground-based
Space Militarization Market Segmentation By Geography
-
1. North America
- 1.1. United States
- 1.2. Canada
-
2. Europe
- 2.1. United Kingdom
- 2.2. France
- 2.3. Germany
- 2.4. Russia
- 2.5. Rest of Europe
-
3. Asia Pacific
- 3.1. China
- 3.2. India
- 3.3. Japan
- 3.4. South Korea
- 3.5. Rest of Asia Pacific
- 4. Rest of the World
Space Militarization Market Regional Market Share
Geographic Coverage of Space Militarization Market
Space Militarization Market REPORT HIGHLIGHTS
| Aspects | Details |
|---|---|
| Study Period | 2020-2034 |
| Base Year | 2025 |
| Estimated Year | 2026 |
| Forecast Period | 2026-2034 |
| Historical Period | 2020-2025 |
| Growth Rate | CAGR of 8.02% from 2020-2034 |
| Segmentation |
|
Table of Contents
- 1. Introduction
- 1.1. Research Scope
- 1.2. Market Segmentation
- 1.3. Research Objective
- 1.4. Definitions and Assumptions
- 2. Executive Summary
- 2.1. Market Snapshot
- 3. Market Dynamics
- 3.1. Market Drivers
- 3.2. Market Restrains
- 3.3. Market Trends
- 3.4. Market Opportunities
- 4. Market Factor Analysis
- 4.1. Porters Five Forces
- 4.1.1. Bargaining Power of Suppliers
- 4.1.2. Bargaining Power of Buyers
- 4.1.3. Threat of New Entrants
- 4.1.4. Threat of Substitutes
- 4.1.5. Competitive Rivalry
- 4.2. PESTEL analysis
- 4.3. BCG Analysis
- 4.3.1. Stars (High Growth, High Market Share)
- 4.3.2. Cash Cows (Low Growth, High Market Share)
- 4.3.3. Question Mark (High Growth, Low Market Share)
- 4.3.4. Dogs (Low Growth, Low Market Share)
- 4.4. Ansoff Matrix Analysis
- 4.5. Supply Chain Analysis
- 4.6. Regulatory Landscape
- 4.7. Current Market Potential and Opportunity Assessment (TAM–SAM–SOM Framework)
- 4.8. VDR Analyst Note
- 4.1. Porters Five Forces
- 5. Market Analysis, Insights and Forecast 2021-2033
- 5.1. Market Analysis, Insights and Forecast - by Capability
- 5.1.1. Defense
- 5.1.2. Support
- 5.2. Market Analysis, Insights and Forecast - by Mode of Operation
- 5.2.1. Space-based
- 5.2.2. Ground-based
- 5.3. Market Analysis, Insights and Forecast - by Region
- 5.3.1. North America
- 5.3.2. Europe
- 5.3.3. Asia Pacific
- 5.3.4. Rest of the World
- 5.1. Market Analysis, Insights and Forecast - by Capability
- 6. Global Space Militarization Market Analysis, Insights and Forecast, 2021-2033
- 6.1. Market Analysis, Insights and Forecast - by Capability
- 6.1.1. Defense
- 6.1.2. Support
- 6.2. Market Analysis, Insights and Forecast - by Mode of Operation
- 6.2.1. Space-based
- 6.2.2. Ground-based
- 6.1. Market Analysis, Insights and Forecast - by Capability
- 7. North America Space Militarization Market Analysis, Insights and Forecast, 2021-2033
- 7.1. Market Analysis, Insights and Forecast - by Capability
- 7.1.1. Defense
- 7.1.2. Support
- 7.2. Market Analysis, Insights and Forecast - by Mode of Operation
- 7.2.1. Space-based
- 7.2.2. Ground-based
- 7.1. Market Analysis, Insights and Forecast - by Capability
- 8. Europe Space Militarization Market Analysis, Insights and Forecast, 2021-2033
- 8.1. Market Analysis, Insights and Forecast - by Capability
- 8.1.1. Defense
- 8.1.2. Support
- 8.2. Market Analysis, Insights and Forecast - by Mode of Operation
- 8.2.1. Space-based
- 8.2.2. Ground-based
- 8.1. Market Analysis, Insights and Forecast - by Capability
- 9. Asia Pacific Space Militarization Market Analysis, Insights and Forecast, 2021-2033
- 9.1. Market Analysis, Insights and Forecast - by Capability
- 9.1.1. Defense
- 9.1.2. Support
- 9.2. Market Analysis, Insights and Forecast - by Mode of Operation
- 9.2.1. Space-based
- 9.2.2. Ground-based
- 9.1. Market Analysis, Insights and Forecast - by Capability
- 10. Rest of the World Space Militarization Market Analysis, Insights and Forecast, 2021-2033
- 10.1. Market Analysis, Insights and Forecast - by Capability
- 10.1.1. Defense
- 10.1.2. Support
- 10.2. Market Analysis, Insights and Forecast - by Mode of Operation
- 10.2.1. Space-based
- 10.2.2. Ground-based
- 10.1. Market Analysis, Insights and Forecast - by Capability
- 11. Competitive Analysis
- 11.1. Company Profiles
- 11.1.1 L3Harris Technologies Inc
- 11.1.1.1. Company Overview
- 11.1.1.2. Products
- 11.1.1.3. Company Financials
- 11.1.1.4. SWOT Analysis
- 11.1.2 THALES
- 11.1.2.1. Company Overview
- 11.1.2.2. Products
- 11.1.2.3. Company Financials
- 11.1.2.4. SWOT Analysis
- 11.1.3 General Dynamics Corporation
- 11.1.3.1. Company Overview
- 11.1.3.2. Products
- 11.1.3.3. Company Financials
- 11.1.3.4. SWOT Analysis
- 11.1.4 China Aerospace Science and Technology Corporatio
- 11.1.4.1. Company Overview
- 11.1.4.2. Products
- 11.1.4.3. Company Financials
- 11.1.4.4. SWOT Analysis
- 11.1.5 Lockheed Martin Corporation
- 11.1.5.1. Company Overview
- 11.1.5.2. Products
- 11.1.5.3. Company Financials
- 11.1.5.4. SWOT Analysis
- 11.1.6 Airbus SE
- 11.1.6.1. Company Overview
- 11.1.6.2. Products
- 11.1.6.3. Company Financials
- 11.1.6.4. SWOT Analysis
- 11.1.7 RTX Corporation
- 11.1.7.1. Company Overview
- 11.1.7.2. Products
- 11.1.7.3. Company Financials
- 11.1.7.4. SWOT Analysis
- 11.1.8 BAE Systems plc
- 11.1.8.1. Company Overview
- 11.1.8.2. Products
- 11.1.8.3. Company Financials
- 11.1.8.4. SWOT Analysis
- 11.1.9 Northrop Grumman Corporation
- 11.1.9.1. Company Overview
- 11.1.9.2. Products
- 11.1.9.3. Company Financials
- 11.1.9.4. SWOT Analysis
- 11.1.10 Saab AB
- 11.1.10.1. Company Overview
- 11.1.10.2. Products
- 11.1.10.3. Company Financials
- 11.1.10.4. SWOT Analysis
- 11.1.11 The Boeing Company
- 11.1.11.1. Company Overview
- 11.1.11.2. Products
- 11.1.11.3. Company Financials
- 11.1.11.4. SWOT Analysis
- 11.1.1 L3Harris Technologies Inc
- 11.2. Market Entropy
- 11.2.1 Company's Key Areas Served
- 11.2.2 Recent Developments
- 11.3. Company Market Share Analysis 2025
- 11.3.1 Top 5 Companies Market Share Analysis
- 11.3.2 Top 3 Companies Market Share Analysis
- 11.4. List of Potential Customers
- 12. Research Methodology
List of Figures
- Figure 1: Global Space Militarization Market Revenue Breakdown (Million, %) by Region 2025 & 2033
- Figure 2: North America Space Militarization Market Revenue (Million), by Capability 2025 & 2033
- Figure 3: North America Space Militarization Market Revenue Share (%), by Capability 2025 & 2033
- Figure 4: North America Space Militarization Market Revenue (Million), by Mode of Operation 2025 & 2033
- Figure 5: North America Space Militarization Market Revenue Share (%), by Mode of Operation 2025 & 2033
- Figure 6: North America Space Militarization Market Revenue (Million), by Country 2025 & 2033
- Figure 7: North America Space Militarization Market Revenue Share (%), by Country 2025 & 2033
- Figure 8: Europe Space Militarization Market Revenue (Million), by Capability 2025 & 2033
- Figure 9: Europe Space Militarization Market Revenue Share (%), by Capability 2025 & 2033
- Figure 10: Europe Space Militarization Market Revenue (Million), by Mode of Operation 2025 & 2033
- Figure 11: Europe Space Militarization Market Revenue Share (%), by Mode of Operation 2025 & 2033
- Figure 12: Europe Space Militarization Market Revenue (Million), by Country 2025 & 2033
- Figure 13: Europe Space Militarization Market Revenue Share (%), by Country 2025 & 2033
- Figure 14: Asia Pacific Space Militarization Market Revenue (Million), by Capability 2025 & 2033
- Figure 15: Asia Pacific Space Militarization Market Revenue Share (%), by Capability 2025 & 2033
- Figure 16: Asia Pacific Space Militarization Market Revenue (Million), by Mode of Operation 2025 & 2033
- Figure 17: Asia Pacific Space Militarization Market Revenue Share (%), by Mode of Operation 2025 & 2033
- Figure 18: Asia Pacific Space Militarization Market Revenue (Million), by Country 2025 & 2033
- Figure 19: Asia Pacific Space Militarization Market Revenue Share (%), by Country 2025 & 2033
- Figure 20: Rest of the World Space Militarization Market Revenue (Million), by Capability 2025 & 2033
- Figure 21: Rest of the World Space Militarization Market Revenue Share (%), by Capability 2025 & 2033
- Figure 22: Rest of the World Space Militarization Market Revenue (Million), by Mode of Operation 2025 & 2033
- Figure 23: Rest of the World Space Militarization Market Revenue Share (%), by Mode of Operation 2025 & 2033
- Figure 24: Rest of the World Space Militarization Market Revenue (Million), by Country 2025 & 2033
- Figure 25: Rest of the World Space Militarization Market Revenue Share (%), by Country 2025 & 2033
List of Tables
- Table 1: Global Space Militarization Market Revenue Million Forecast, by Capability 2020 & 2033
- Table 2: Global Space Militarization Market Revenue Million Forecast, by Mode of Operation 2020 & 2033
- Table 3: Global Space Militarization Market Revenue Million Forecast, by Region 2020 & 2033
- Table 4: Global Space Militarization Market Revenue Million Forecast, by Capability 2020 & 2033
- Table 5: Global Space Militarization Market Revenue Million Forecast, by Mode of Operation 2020 & 2033
- Table 6: Global Space Militarization Market Revenue Million Forecast, by Country 2020 & 2033
- Table 7: United States Space Militarization Market Revenue (Million) Forecast, by Application 2020 & 2033
- Table 8: Canada Space Militarization Market Revenue (Million) Forecast, by Application 2020 & 2033
- Table 9: Global Space Militarization Market Revenue Million Forecast, by Capability 2020 & 2033
- Table 10: Global Space Militarization Market Revenue Million Forecast, by Mode of Operation 2020 & 2033
- Table 11: Global Space Militarization Market Revenue Million Forecast, by Country 2020 & 2033
- Table 12: United Kingdom Space Militarization Market Revenue (Million) Forecast, by Application 2020 & 2033
- Table 13: France Space Militarization Market Revenue (Million) Forecast, by Application 2020 & 2033
- Table 14: Germany Space Militarization Market Revenue (Million) Forecast, by Application 2020 & 2033
- Table 15: Russia Space Militarization Market Revenue (Million) Forecast, by Application 2020 & 2033
- Table 16: Rest of Europe Space Militarization Market Revenue (Million) Forecast, by Application 2020 & 2033
- Table 17: Global Space Militarization Market Revenue Million Forecast, by Capability 2020 & 2033
- Table 18: Global Space Militarization Market Revenue Million Forecast, by Mode of Operation 2020 & 2033
- Table 19: Global Space Militarization Market Revenue Million Forecast, by Country 2020 & 2033
- Table 20: China Space Militarization Market Revenue (Million) Forecast, by Application 2020 & 2033
- Table 21: India Space Militarization Market Revenue (Million) Forecast, by Application 2020 & 2033
- Table 22: Japan Space Militarization Market Revenue (Million) Forecast, by Application 2020 & 2033
- Table 23: South Korea Space Militarization Market Revenue (Million) Forecast, by Application 2020 & 2033
- Table 24: Rest of Asia Pacific Space Militarization Market Revenue (Million) Forecast, by Application 2020 & 2033
- Table 25: Global Space Militarization Market Revenue Million Forecast, by Capability 2020 & 2033
- Table 26: Global Space Militarization Market Revenue Million Forecast, by Mode of Operation 2020 & 2033
- Table 27: Global Space Militarization Market Revenue Million Forecast, by Country 2020 & 2033
Frequently Asked Questions
1. What is the projected Compound Annual Growth Rate (CAGR) of the Space Militarization Market?
The projected CAGR is approximately 8.02%.
2. Which companies are prominent players in the Space Militarization Market?
Key companies in the market include L3Harris Technologies Inc, THALES, General Dynamics Corporation, China Aerospace Science and Technology Corporatio, Lockheed Martin Corporation, Airbus SE, RTX Corporation, BAE Systems plc, Northrop Grumman Corporation, Saab AB, The Boeing Company.
3. What are the main segments of the Space Militarization Market?
The market segments include Capability, Mode of Operation.
4. Can you provide details about the market size?
The market size is estimated to be USD 54.49 Million as of 2022.
5. What are some drivers contributing to market growth?
Increase in Internet of Things (IoT) and Autonomous Systems; Rise in Demand for Military and Defense Satellite Communication Solutions.
6. What are the notable trends driving market growth?
The Defense Segment will Dominate the Market.
7. Are there any restraints impacting market growth?
Cybersecurity Threats to Satellite Communication; Interference in Transmission of Data.
8. Can you provide examples of recent developments in the market?
N/A
9. What pricing options are available for accessing the report?
Pricing options include single-user, multi-user, and enterprise licenses priced at USD 4750, USD 5250, and USD 8750 respectively.
10. Is the market size provided in terms of value or volume?
The market size is provided in terms of value, measured in Million.
11. Are there any specific market keywords associated with the report?
Yes, the market keyword associated with the report is "Space Militarization Market," which aids in identifying and referencing the specific market segment covered.
12. How do I determine which pricing option suits my needs best?
The pricing options vary based on user requirements and access needs. Individual users may opt for single-user licenses, while businesses requiring broader access may choose multi-user or enterprise licenses for cost-effective access to the report.
13. Are there any additional resources or data provided in the Space Militarization Market report?
While the report offers comprehensive insights, it's advisable to review the specific contents or supplementary materials provided to ascertain if additional resources or data are available.
14. How can I stay updated on further developments or reports in the Space Militarization Market?
To stay informed about further developments, trends, and reports in the Space Militarization Market, consider subscribing to industry newsletters, following relevant companies and organizations, or regularly checking reputable industry news sources and publications.
Methodology
Step 1 - Identification of Relevant Samples Size from Population Database


Step 2 - Approaches for Defining Global Market Size (Value, Volume* & Price*)

Note*: In applicable scenarios
Step 3 - Data Sources
Primary Research
- Web Analytics
- Survey Reports
- Research Institute
- Latest Research Reports
- Opinion Leaders
Secondary Research
- Annual Reports
- White Paper
- Latest Press Release
- Industry Association
- Paid Database
- Investor Presentations

Step 4 - Data Triangulation
Involves using different sources of information in order to increase the validity of a study
These sources are likely to be stakeholders in a program - participants, other researchers, program staff, other community members, and so on.
Then we put all data in single framework & apply various statistical tools to find out the dynamic on the market.
During the analysis stage, feedback from the stakeholder groups would be compared to determine areas of agreement as well as areas of divergence