

Key Insights
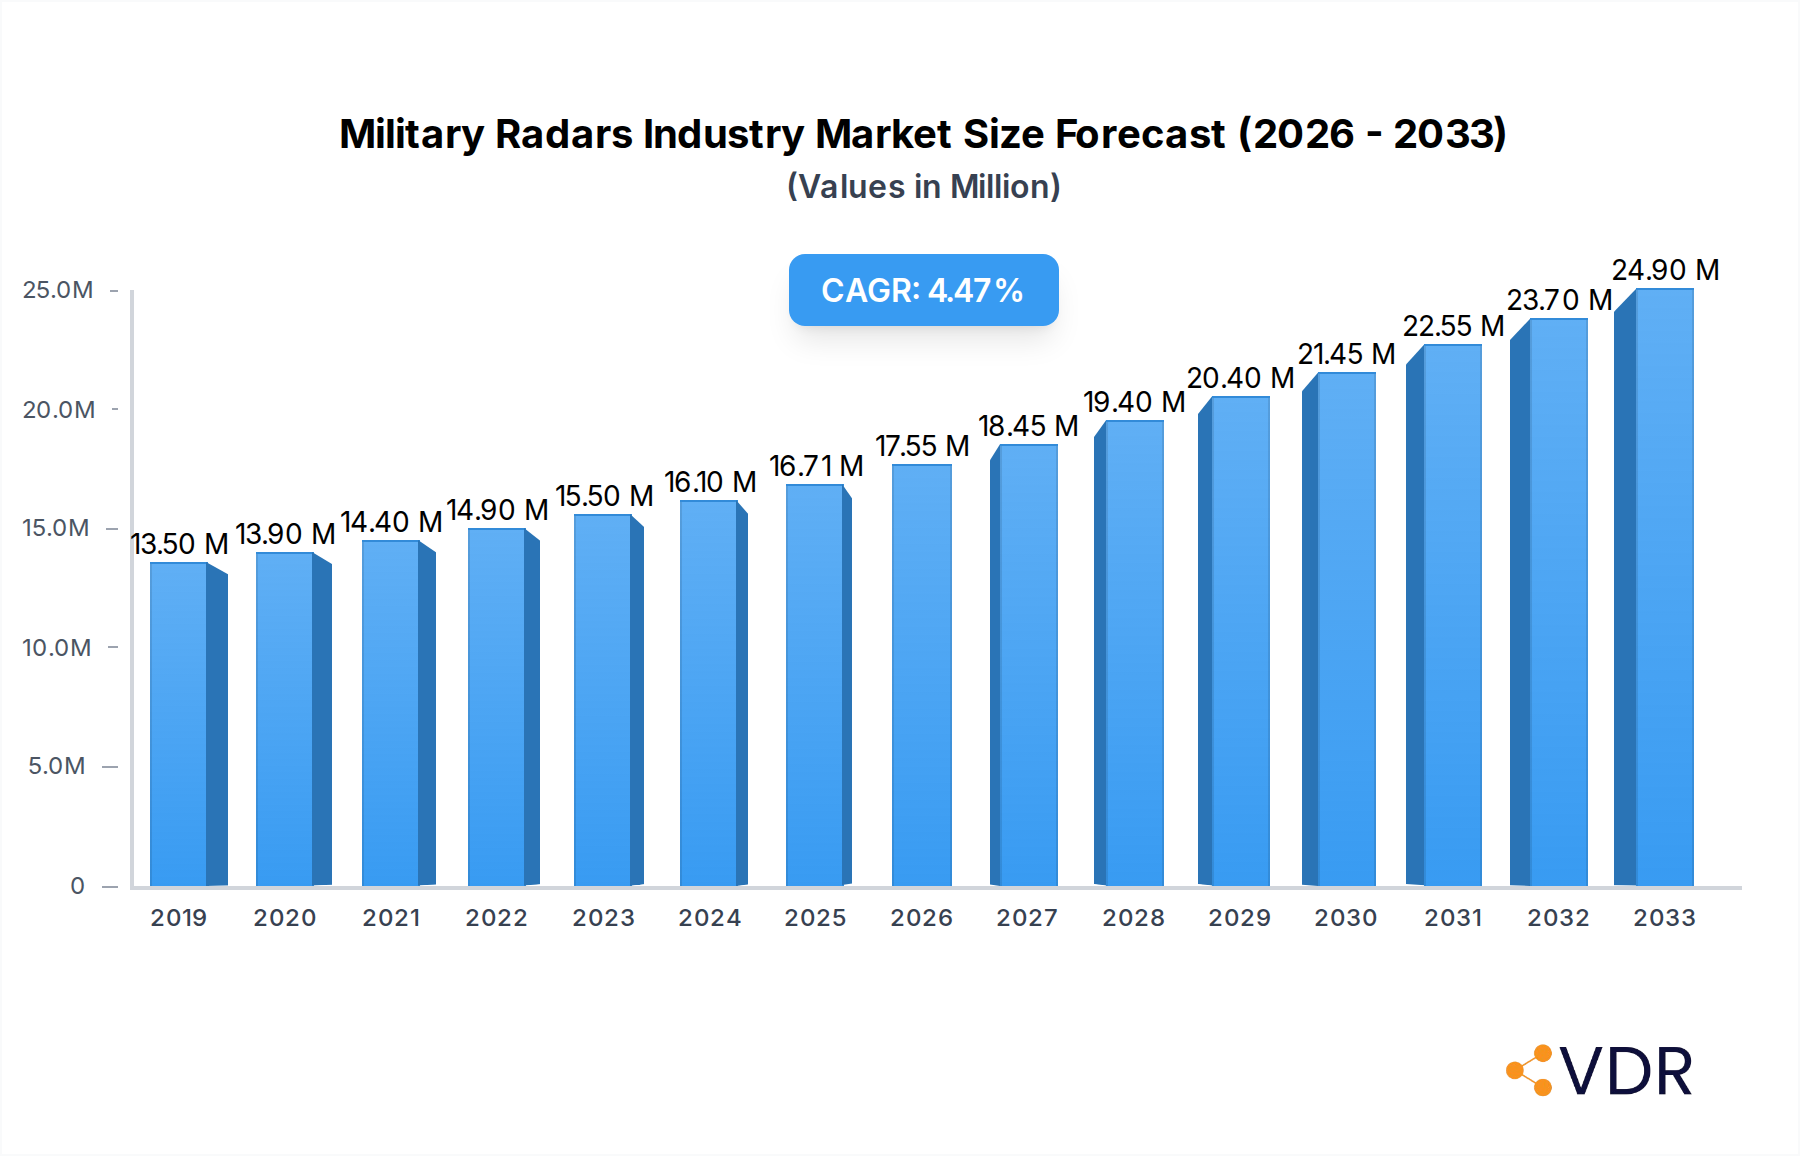
The global Military Radars Industry is poised for significant expansion, with a projected market size of $16.71 billion by 2025, exhibiting a Compound Annual Growth Rate (CAGR) of 5.15% through 2033. This robust growth is primarily fueled by escalating geopolitical tensions and a persistent need for advanced surveillance and defense capabilities across nations. Key drivers include the increasing adoption of sophisticated radar technologies, such as AESA (Active Electronically Scanned Array) and multi-function radars, designed for enhanced target detection, tracking, and electronic warfare. Governments worldwide are heavily investing in modernizing their defense infrastructure, recognizing the critical role of radar systems in maintaining strategic superiority and national security. Furthermore, the integration of artificial intelligence (AI) and machine learning (ML) into radar systems is enhancing their operational efficiency, data processing capabilities, and threat identification accuracy, thereby creating new avenues for market penetration and innovation.

Military Radars Industry Market Size (In Million)
The industry's trajectory is further shaped by emerging trends like the development of miniaturized and portable radar solutions for tactical operations and the growing demand for airborne early warning and control (AEW&C) systems. The continuous evolution of threats, including the proliferation of drones and hypersonic missiles, necessitates the development of more agile and responsive radar technologies. While the market is robust, certain restraints may influence its growth. These include high research and development costs associated with cutting-edge radar technologies and stringent regulatory frameworks governing military hardware procurement. However, the sustained demand from major defense players and the ongoing global focus on defense modernization are expected to largely offset these challenges. The market is segmented across various applications, including air surveillance, ground surveillance, naval surveillance, and airborne early warning, each contributing to the overall market dynamics and offering diverse growth opportunities. Leading companies such as Thales, Lockheed Martin, and BAE Systems are at the forefront of this evolving landscape, driving innovation and catering to the sophisticated needs of global defense forces.
Military Radars Industry Company Market Share
This in-depth report provides a strategic overview of the global Military Radars market, offering critical insights into its dynamics, growth trajectory, and future outlook. Spanning the historical period from 2019 to 2024 and projecting growth through 2033, this analysis is essential for understanding the evolving landscape of advanced defense technology.
Military Radars Industry Market Dynamics & Structure
The Military Radars industry is characterized by a moderate to high degree of market concentration, with key players like Lockheed Martin Corporation, RTX Corporation, Northrop Grumman Corporation, BAE Systems PLC, and THALES dominating the global landscape. Technological innovation remains the primary driver, fueled by relentless demand for enhanced situational awareness, precision targeting, and electronic warfare capabilities. Emerging technologies such as Artificial Intelligence (AI) for data processing and machine learning for threat detection are rapidly being integrated into next-generation radar systems. Regulatory frameworks, primarily driven by national defense strategies and international arms control treaties, significantly influence market access and product development. Competitive product substitutes, while limited in advanced military applications, include passive sensing technologies and intelligence, surveillance, and reconnaissance (ISR) platforms that offer complementary capabilities. End-user demographics are predominantly governmental defense agencies and armed forces worldwide, with a growing emphasis on modernization programs and platform upgrades. Mergers and acquisitions (M&A) trends are evident as larger defense contractors consolidate their market positions and acquire specialized technology firms to broaden their portfolios. For instance, recent M&A activities have focused on acquiring expertise in areas like gallium nitride (GaN) technology and AI-driven radar algorithms.
- Market Concentration: Dominated by a few major defense prime contractors.
- Technological Innovation Drivers: AI integration, advanced sensor technology (GaN), miniaturization, and multi-functionality.
- Regulatory Frameworks: National defense budgets, export controls (e.g., ITAR), and international security agreements.
- Competitive Product Substitutes: ISR platforms, passive sensing technologies.
- End-User Demographics: National defense ministries, military branches (air force, navy, army).
- M&A Trends: Consolidation for broader capabilities, acquisition of specialized tech firms.
Military Radars Industry Growth Trends & Insights
The global Military Radars market is poised for substantial expansion, driven by escalating geopolitical tensions, the modernization of defense forces, and the increasing sophistication of aerial and ground threats. From a market size of approximately $15,000 million units in the base year 2025, the industry is projected to witness a robust Compound Annual Growth Rate (CAGR) of around 5.5% over the forecast period of 2025–2033. This growth is underpinned by the escalating adoption of advanced radar systems across various military platforms, including fighter jets, naval vessels, ground-based air defense systems, and unmanned aerial vehicles (UAVs). Technological disruptions, such as the widespread integration of Gallium Nitride (GaN) technology, are enabling the development of more powerful, efficient, and compact radar systems with enhanced detection and tracking capabilities. Furthermore, the proliferation of stealth technology by potential adversaries necessitates the development of increasingly sophisticated counter-stealth radar solutions, further fueling market demand. Consumer behavior shifts, or rather, the evolving operational requirements of defense forces, are directing investments towards multi-function radars capable of performing surveillance, targeting, electronic warfare, and communication functions simultaneously. This demand for versatility and adaptability in radar systems is a significant growth catalyst. The market penetration of AESA (Active Electronically Scanned Array) radars, known for their superior performance, flexibility, and reliability, is steadily increasing, replacing older mechanically scanned radar systems. This technological migration represents a key growth area. The increasing focus on network-centric warfare and the integration of sensor data from multiple sources also amplifies the importance of advanced radar systems as critical nodes in the battlefield information network. The market is also witnessing a growing demand for airborne early warning and control (AEW&C) systems, which rely heavily on advanced radar technology to provide broad battlefield awareness.
Dominant Regions, Countries, or Segments in Military Radars Industry
The North America region stands out as the dominant force in the global Military Radars market, driven by significant government defense spending, continuous technological innovation, and the presence of leading defense contractors. Within North America, the United States represents the largest single country market for military radars, consistently investing heavily in research, development, and procurement of advanced radar systems for its formidable armed forces. This dominance is evident across all analyzed segments:
- Production Analysis: The United States leads in the production of sophisticated radar systems, including AESA radars for fighter aircraft, naval surveillance radars, and ground-based air defense radars. Domestic manufacturing capabilities are robust, supported by a strong industrial base and government incentives. Production volumes are estimated to be in the range of 4,500-5,000 million units in 2025.
- Consumption Analysis: US defense agencies are the largest consumers of military radars, with extensive modernization programs and an ongoing need to replace aging equipment and enhance existing capabilities. Consumption figures for 2025 are projected to be around 4,200-4,700 million units.
- Import Market Analysis (Value & Volume): While the US is a net exporter, it does import specialized components or niche radar systems to augment its domestic capabilities, though the volume is relatively small compared to production. Import values might be in the range of $500-$700 million, with volumes around 50-70 million units.
- Export Market Analysis (Value & Volume): The US is a major exporter of military radars, supplying advanced systems to allied nations worldwide. Export values are substantial, estimated to be between $2,000-$2,500 million, with export volumes reaching 200-250 million units.
- Price Trend Analysis: Prices for advanced military radars, especially AESA systems, remain high due to R&D costs, complexity, and limited production runs. However, economies of scale in large procurement programs can lead to slight price reductions over time. The average unit price for advanced military radars is estimated to be between $10-12 million.
Other significant regions contributing to market growth include Europe (driven by countries like Germany, France, and the UK, with companies like Airbus SE, Leonardo SpA, HENSOLDT Holding Germany GmbH, and BAE Systems PLC) and Asia-Pacific (with growing defense budgets in countries like China, India, and South Korea). However, North America's sustained investment and technological leadership solidify its position as the dominant market driver.
Military Radars Industry Product Landscape
The Military Radars product landscape is defined by a commitment to enhanced performance, multi-functionality, and resilience. Key innovations include the widespread adoption of Active Electronically Scanned Array (AESA) technology, offering superior beam steering, multi-target tracking, and electronic warfare capabilities. Gallium Nitride (GaN) semiconductor technology is revolutionizing radar power and efficiency, enabling smaller, more powerful, and heat-resistant systems. Applications span a broad spectrum, from fighter jet fire control and airborne early warning to naval surveillance, ground-based air and missile defense, and tactical battlefield reconnaissance. Performance metrics are increasingly focused on detection range, resolution, jam resistance, and integration with networked C4ISR systems. Unique selling propositions revolve around enhanced situational awareness, precision targeting, and the ability to operate effectively in contested electromagnetic environments.
Key Drivers, Barriers & Challenges in Military Radars Industry
Key Drivers:
- Geopolitical Instability & Defense Modernization: Rising global tensions and the need for militaries to maintain technological superiority are driving significant investment in advanced radar systems.
- Technological Advancements: Innovations in AI, GaN technology, and sensor fusion are enabling more capable and versatile radar platforms.
- Emergence of New Threats: The proliferation of stealth aircraft, hypersonic missiles, and drone swarms necessitates sophisticated counter-detection and tracking capabilities.
- Network-Centric Warfare: The integration of radar data into broader battlefield networks enhances command and control, increasing demand for interoperable systems.
Key Barriers & Challenges:
- High Development & Procurement Costs: Advanced military radars are extremely expensive to develop and procure, requiring substantial government funding and long procurement cycles.
- Stringent Regulatory & Export Controls: National security concerns and international arms control treaties can limit market access and complicate export operations.
- Supply Chain Vulnerabilities: Reliance on specialized components and materials can lead to supply chain disruptions, impacting production timelines.
- Skilled Workforce Shortage: The development and maintenance of complex radar systems require a highly skilled engineering and technical workforce, which can be a bottleneck.
- Cybersecurity Threats: Radar systems are increasingly networked, making them vulnerable to cyberattacks that could compromise their functionality or data integrity.
Emerging Opportunities in Military Radars Industry
Emerging opportunities in the Military Radars industry are centered around the integration of artificial intelligence and machine learning for enhanced data analysis and autonomous operation. The growing demand for Counter-UAS (C-UAS) radar solutions presents a significant untapped market as defense forces grapple with the proliferation of unmanned threats. Furthermore, the development of smaller, more portable, and multi-functional radars for special operations forces and ground troops offers new avenues for growth. The increasing adoption of open systems architecture and modular design principles in radar development allows for easier upgrades and customization, catering to evolving operational needs and reducing lifecycle costs.
Growth Accelerators in the Military Radars Industry Industry
Growth accelerators in the Military Radars industry are primarily driven by technological breakthroughs in areas like advanced signal processing and electronic counter-countermeasures (ECCM). Strategic partnerships between prime defense contractors and smaller technology firms are crucial for rapid innovation and market penetration. Market expansion strategies, including increased focus on export markets in regions with growing defense budgets, will further fuel long-term growth. The ongoing digital transformation within defense sectors, emphasizing data-driven decision-making, further solidifies the role of advanced radar systems as essential data providers.
Key Players Shaping the Military Radars Industry Market
- THALES
- Leonardo SpA
- Lockheed Martin Corporation
- Airbus SE
- QinetiQ Group PL
- Teledyne Technologies Incorporated
- BAE Systems PLC
- RTX Corporation
- HENSOLDT Holding Germany GmbH
- Israel Aerospace Industries Ltd
- Northrop Grumman Corporation
- Saab AB
Notable Milestones in Military Radars Industry Sector
- 2023/2024: Increased focus on AI-driven target recognition and classification in radar systems.
- 2023: Rollout of next-generation GaN-based radar components promising enhanced power and efficiency.
- 2022: Significant advancements in counter-stealth radar technologies to address evolving aerial threats.
- 2021: Integration of advanced multi-function radars capable of EW and targeting capabilities.
- 2020: Increased investment in robust Counter-UAS radar solutions due to drone proliferation.
- 2019: Widespread adoption of AESA radar technology in new fighter aircraft programs.
In-Depth Military Radars Industry Market Outlook
The Military Radars industry is set for a period of sustained and robust growth, propelled by geopolitical imperatives and technological advancements. Future market potential lies in the continued development and integration of AI, quantum sensing, and advanced electronic warfare capabilities. Strategic opportunities include catering to the growing demand for specialized radar systems for emerging domains such as space-based ISR and cyber warfare. The increasing emphasis on interoperability and common data architectures across allied forces will also shape future market dynamics, favoring solutions that can seamlessly integrate into existing and future defense networks.
Military Radars Industry Segmentation
- 1. Production Analysis
- 2. Consumption Analysis
- 3. Import Market Analysis (Value & Volume)
- 4. Export Market Analysis (Value & Volume)
- 5. Price Trend Analysis
Military Radars Industry Segmentation By Geography
-
1. North America
- 1.1. United States
- 1.2. Canada
- 1.3. Mexico
-
2. South America
- 2.1. Brazil
- 2.2. Argentina
- 2.3. Rest of South America
-
3. Europe
- 3.1. United Kingdom
- 3.2. Germany
- 3.3. France
- 3.4. Italy
- 3.5. Spain
- 3.6. Russia
- 3.7. Benelux
- 3.8. Nordics
- 3.9. Rest of Europe
-
4. Middle East & Africa
- 4.1. Turkey
- 4.2. Israel
- 4.3. GCC
- 4.4. North Africa
- 4.5. South Africa
- 4.6. Rest of Middle East & Africa
-
5. Asia Pacific
- 5.1. China
- 5.2. India
- 5.3. Japan
- 5.4. South Korea
- 5.5. ASEAN
- 5.6. Oceania
- 5.7. Rest of Asia Pacific

Military Radars Industry Regional Market Share
Geographic Coverage of Military Radars Industry
Military Radars Industry REPORT HIGHLIGHTS
| Aspects | Details |
|---|---|
| Study Period | 2020-2034 |
| Base Year | 2025 |
| Estimated Year | 2026 |
| Forecast Period | 2026-2034 |
| Historical Period | 2020-2025 |
| Growth Rate | CAGR of 5.15% from 2020-2034 |
| Segmentation |
|
Table of Contents
- 1. Introduction
- 1.1. Research Scope
- 1.2. Market Segmentation
- 1.3. Research Objective
- 1.4. Definitions and Assumptions
- 2. Executive Summary
- 2.1. Market Snapshot
- 3. Market Dynamics
- 3.1. Market Drivers
- 3.2. Market Restrains
- 3.3. Market Trends
- 3.4. Market Opportunities
- 4. Market Factor Analysis
- 4.1. Porters Five Forces
- 4.1.1. Bargaining Power of Suppliers
- 4.1.2. Bargaining Power of Buyers
- 4.1.3. Threat of New Entrants
- 4.1.4. Threat of Substitutes
- 4.1.5. Competitive Rivalry
- 4.2. PESTEL analysis
- 4.3. BCG Analysis
- 4.3.1. Stars (High Growth, High Market Share)
- 4.3.2. Cash Cows (Low Growth, High Market Share)
- 4.3.3. Question Mark (High Growth, Low Market Share)
- 4.3.4. Dogs (Low Growth, Low Market Share)
- 4.4. Ansoff Matrix Analysis
- 4.5. Supply Chain Analysis
- 4.6. Regulatory Landscape
- 4.7. Current Market Potential and Opportunity Assessment (TAM–SAM–SOM Framework)
- 4.8. VDR Analyst Note
- 4.1. Porters Five Forces
- 5. Market Analysis, Insights and Forecast 2021-2033
- 5.1. Market Analysis, Insights and Forecast - by Production Analysis
- 5.2. Market Analysis, Insights and Forecast - by Consumption Analysis
- 5.3. Market Analysis, Insights and Forecast - by Import Market Analysis (Value & Volume)
- 5.4. Market Analysis, Insights and Forecast - by Export Market Analysis (Value & Volume)
- 5.5. Market Analysis, Insights and Forecast - by Price Trend Analysis
- 5.6. Market Analysis, Insights and Forecast - by Region
- 5.6.1. North America
- 5.6.2. South America
- 5.6.3. Europe
- 5.6.4. Middle East & Africa
- 5.6.5. Asia Pacific
- 6. Global Military Radars Industry Analysis, Insights and Forecast, 2021-2033
- 6.1. Market Analysis, Insights and Forecast - by Production Analysis
- 6.2. Market Analysis, Insights and Forecast - by Consumption Analysis
- 6.3. Market Analysis, Insights and Forecast - by Import Market Analysis (Value & Volume)
- 6.4. Market Analysis, Insights and Forecast - by Export Market Analysis (Value & Volume)
- 6.5. Market Analysis, Insights and Forecast - by Price Trend Analysis
- 7. North America Military Radars Industry Analysis, Insights and Forecast, 2021-2033
- 7.1. Market Analysis, Insights and Forecast - by Production Analysis
- 7.2. Market Analysis, Insights and Forecast - by Consumption Analysis
- 7.3. Market Analysis, Insights and Forecast - by Import Market Analysis (Value & Volume)
- 7.4. Market Analysis, Insights and Forecast - by Export Market Analysis (Value & Volume)
- 7.5. Market Analysis, Insights and Forecast - by Price Trend Analysis
- 8. South America Military Radars Industry Analysis, Insights and Forecast, 2021-2033
- 8.1. Market Analysis, Insights and Forecast - by Production Analysis
- 8.2. Market Analysis, Insights and Forecast - by Consumption Analysis
- 8.3. Market Analysis, Insights and Forecast - by Import Market Analysis (Value & Volume)
- 8.4. Market Analysis, Insights and Forecast - by Export Market Analysis (Value & Volume)
- 8.5. Market Analysis, Insights and Forecast - by Price Trend Analysis
- 9. Europe Military Radars Industry Analysis, Insights and Forecast, 2021-2033
- 9.1. Market Analysis, Insights and Forecast - by Production Analysis
- 9.2. Market Analysis, Insights and Forecast - by Consumption Analysis
- 9.3. Market Analysis, Insights and Forecast - by Import Market Analysis (Value & Volume)
- 9.4. Market Analysis, Insights and Forecast - by Export Market Analysis (Value & Volume)
- 9.5. Market Analysis, Insights and Forecast - by Price Trend Analysis
- 10. Middle East & Africa Military Radars Industry Analysis, Insights and Forecast, 2021-2033
- 10.1. Market Analysis, Insights and Forecast - by Production Analysis
- 10.2. Market Analysis, Insights and Forecast - by Consumption Analysis
- 10.3. Market Analysis, Insights and Forecast - by Import Market Analysis (Value & Volume)
- 10.4. Market Analysis, Insights and Forecast - by Export Market Analysis (Value & Volume)
- 10.5. Market Analysis, Insights and Forecast - by Price Trend Analysis
- 11. Asia Pacific Military Radars Industry Analysis, Insights and Forecast, 2021-2033
- 11.1. Market Analysis, Insights and Forecast - by Production Analysis
- 11.2. Market Analysis, Insights and Forecast - by Consumption Analysis
- 11.3. Market Analysis, Insights and Forecast - by Import Market Analysis (Value & Volume)
- 11.4. Market Analysis, Insights and Forecast - by Export Market Analysis (Value & Volume)
- 11.5. Market Analysis, Insights and Forecast - by Price Trend Analysis
- 12. Competitive Analysis
- 12.1. Company Profiles
- 12.1.1 THALES
- 12.1.1.1. Company Overview
- 12.1.1.2. Products
- 12.1.1.3. Company Financials
- 12.1.1.4. SWOT Analysis
- 12.1.2 Leonardo SpA
- 12.1.2.1. Company Overview
- 12.1.2.2. Products
- 12.1.2.3. Company Financials
- 12.1.2.4. SWOT Analysis
- 12.1.3 Lockheed Martin Corporation
- 12.1.3.1. Company Overview
- 12.1.3.2. Products
- 12.1.3.3. Company Financials
- 12.1.3.4. SWOT Analysis
- 12.1.4 Airbus SE
- 12.1.4.1. Company Overview
- 12.1.4.2. Products
- 12.1.4.3. Company Financials
- 12.1.4.4. SWOT Analysis
- 12.1.5 QinetiQ Group PL
- 12.1.5.1. Company Overview
- 12.1.5.2. Products
- 12.1.5.3. Company Financials
- 12.1.5.4. SWOT Analysis
- 12.1.6 Teledyne Technologies Incorporated
- 12.1.6.1. Company Overview
- 12.1.6.2. Products
- 12.1.6.3. Company Financials
- 12.1.6.4. SWOT Analysis
- 12.1.7 BAE Systems PLC
- 12.1.7.1. Company Overview
- 12.1.7.2. Products
- 12.1.7.3. Company Financials
- 12.1.7.4. SWOT Analysis
- 12.1.8 RTX Corporation
- 12.1.8.1. Company Overview
- 12.1.8.2. Products
- 12.1.8.3. Company Financials
- 12.1.8.4. SWOT Analysis
- 12.1.9 HENSOLDT Holding Germany GmbH
- 12.1.9.1. Company Overview
- 12.1.9.2. Products
- 12.1.9.3. Company Financials
- 12.1.9.4. SWOT Analysis
- 12.1.10 Israel Aerospace Industries Ltd
- 12.1.10.1. Company Overview
- 12.1.10.2. Products
- 12.1.10.3. Company Financials
- 12.1.10.4. SWOT Analysis
- 12.1.11 Northrop Grumman Corporation
- 12.1.11.1. Company Overview
- 12.1.11.2. Products
- 12.1.11.3. Company Financials
- 12.1.11.4. SWOT Analysis
- 12.1.12 Saab AB
- 12.1.12.1. Company Overview
- 12.1.12.2. Products
- 12.1.12.3. Company Financials
- 12.1.12.4. SWOT Analysis
- 12.1.1 THALES
- 12.2. Market Entropy
- 12.2.1 Company's Key Areas Served
- 12.2.2 Recent Developments
- 12.3. Company Market Share Analysis 2025
- 12.3.1 Top 5 Companies Market Share Analysis
- 12.3.2 Top 3 Companies Market Share Analysis
- 12.4. List of Potential Customers
- 13. Research Methodology
List of Figures
- Figure 1: Global Military Radars Industry Revenue Breakdown (Million, %) by Region 2025 & 2033
- Figure 2: North America Military Radars Industry Revenue (Million), by Production Analysis 2025 & 2033
- Figure 3: North America Military Radars Industry Revenue Share (%), by Production Analysis 2025 & 2033
- Figure 4: North America Military Radars Industry Revenue (Million), by Consumption Analysis 2025 & 2033
- Figure 5: North America Military Radars Industry Revenue Share (%), by Consumption Analysis 2025 & 2033
- Figure 6: North America Military Radars Industry Revenue (Million), by Import Market Analysis (Value & Volume) 2025 & 2033
- Figure 7: North America Military Radars Industry Revenue Share (%), by Import Market Analysis (Value & Volume) 2025 & 2033
- Figure 8: North America Military Radars Industry Revenue (Million), by Export Market Analysis (Value & Volume) 2025 & 2033
- Figure 9: North America Military Radars Industry Revenue Share (%), by Export Market Analysis (Value & Volume) 2025 & 2033
- Figure 10: North America Military Radars Industry Revenue (Million), by Price Trend Analysis 2025 & 2033
- Figure 11: North America Military Radars Industry Revenue Share (%), by Price Trend Analysis 2025 & 2033
- Figure 12: North America Military Radars Industry Revenue (Million), by Country 2025 & 2033
- Figure 13: North America Military Radars Industry Revenue Share (%), by Country 2025 & 2033
- Figure 14: South America Military Radars Industry Revenue (Million), by Production Analysis 2025 & 2033
- Figure 15: South America Military Radars Industry Revenue Share (%), by Production Analysis 2025 & 2033
- Figure 16: South America Military Radars Industry Revenue (Million), by Consumption Analysis 2025 & 2033
- Figure 17: South America Military Radars Industry Revenue Share (%), by Consumption Analysis 2025 & 2033
- Figure 18: South America Military Radars Industry Revenue (Million), by Import Market Analysis (Value & Volume) 2025 & 2033
- Figure 19: South America Military Radars Industry Revenue Share (%), by Import Market Analysis (Value & Volume) 2025 & 2033
- Figure 20: South America Military Radars Industry Revenue (Million), by Export Market Analysis (Value & Volume) 2025 & 2033
- Figure 21: South America Military Radars Industry Revenue Share (%), by Export Market Analysis (Value & Volume) 2025 & 2033
- Figure 22: South America Military Radars Industry Revenue (Million), by Price Trend Analysis 2025 & 2033
- Figure 23: South America Military Radars Industry Revenue Share (%), by Price Trend Analysis 2025 & 2033
- Figure 24: South America Military Radars Industry Revenue (Million), by Country 2025 & 2033
- Figure 25: South America Military Radars Industry Revenue Share (%), by Country 2025 & 2033
- Figure 26: Europe Military Radars Industry Revenue (Million), by Production Analysis 2025 & 2033
- Figure 27: Europe Military Radars Industry Revenue Share (%), by Production Analysis 2025 & 2033
- Figure 28: Europe Military Radars Industry Revenue (Million), by Consumption Analysis 2025 & 2033
- Figure 29: Europe Military Radars Industry Revenue Share (%), by Consumption Analysis 2025 & 2033
- Figure 30: Europe Military Radars Industry Revenue (Million), by Import Market Analysis (Value & Volume) 2025 & 2033
- Figure 31: Europe Military Radars Industry Revenue Share (%), by Import Market Analysis (Value & Volume) 2025 & 2033
- Figure 32: Europe Military Radars Industry Revenue (Million), by Export Market Analysis (Value & Volume) 2025 & 2033
- Figure 33: Europe Military Radars Industry Revenue Share (%), by Export Market Analysis (Value & Volume) 2025 & 2033
- Figure 34: Europe Military Radars Industry Revenue (Million), by Price Trend Analysis 2025 & 2033
- Figure 35: Europe Military Radars Industry Revenue Share (%), by Price Trend Analysis 2025 & 2033
- Figure 36: Europe Military Radars Industry Revenue (Million), by Country 2025 & 2033
- Figure 37: Europe Military Radars Industry Revenue Share (%), by Country 2025 & 2033
- Figure 38: Middle East & Africa Military Radars Industry Revenue (Million), by Production Analysis 2025 & 2033
- Figure 39: Middle East & Africa Military Radars Industry Revenue Share (%), by Production Analysis 2025 & 2033
- Figure 40: Middle East & Africa Military Radars Industry Revenue (Million), by Consumption Analysis 2025 & 2033
- Figure 41: Middle East & Africa Military Radars Industry Revenue Share (%), by Consumption Analysis 2025 & 2033
- Figure 42: Middle East & Africa Military Radars Industry Revenue (Million), by Import Market Analysis (Value & Volume) 2025 & 2033
- Figure 43: Middle East & Africa Military Radars Industry Revenue Share (%), by Import Market Analysis (Value & Volume) 2025 & 2033
- Figure 44: Middle East & Africa Military Radars Industry Revenue (Million), by Export Market Analysis (Value & Volume) 2025 & 2033
- Figure 45: Middle East & Africa Military Radars Industry Revenue Share (%), by Export Market Analysis (Value & Volume) 2025 & 2033
- Figure 46: Middle East & Africa Military Radars Industry Revenue (Million), by Price Trend Analysis 2025 & 2033
- Figure 47: Middle East & Africa Military Radars Industry Revenue Share (%), by Price Trend Analysis 2025 & 2033
- Figure 48: Middle East & Africa Military Radars Industry Revenue (Million), by Country 2025 & 2033
- Figure 49: Middle East & Africa Military Radars Industry Revenue Share (%), by Country 2025 & 2033
- Figure 50: Asia Pacific Military Radars Industry Revenue (Million), by Production Analysis 2025 & 2033
- Figure 51: Asia Pacific Military Radars Industry Revenue Share (%), by Production Analysis 2025 & 2033
- Figure 52: Asia Pacific Military Radars Industry Revenue (Million), by Consumption Analysis 2025 & 2033
- Figure 53: Asia Pacific Military Radars Industry Revenue Share (%), by Consumption Analysis 2025 & 2033
- Figure 54: Asia Pacific Military Radars Industry Revenue (Million), by Import Market Analysis (Value & Volume) 2025 & 2033
- Figure 55: Asia Pacific Military Radars Industry Revenue Share (%), by Import Market Analysis (Value & Volume) 2025 & 2033
- Figure 56: Asia Pacific Military Radars Industry Revenue (Million), by Export Market Analysis (Value & Volume) 2025 & 2033
- Figure 57: Asia Pacific Military Radars Industry Revenue Share (%), by Export Market Analysis (Value & Volume) 2025 & 2033
- Figure 58: Asia Pacific Military Radars Industry Revenue (Million), by Price Trend Analysis 2025 & 2033
- Figure 59: Asia Pacific Military Radars Industry Revenue Share (%), by Price Trend Analysis 2025 & 2033
- Figure 60: Asia Pacific Military Radars Industry Revenue (Million), by Country 2025 & 2033
- Figure 61: Asia Pacific Military Radars Industry Revenue Share (%), by Country 2025 & 2033
List of Tables
- Table 1: Global Military Radars Industry Revenue Million Forecast, by Production Analysis 2020 & 2033
- Table 2: Global Military Radars Industry Revenue Million Forecast, by Consumption Analysis 2020 & 2033
- Table 3: Global Military Radars Industry Revenue Million Forecast, by Import Market Analysis (Value & Volume) 2020 & 2033
- Table 4: Global Military Radars Industry Revenue Million Forecast, by Export Market Analysis (Value & Volume) 2020 & 2033
- Table 5: Global Military Radars Industry Revenue Million Forecast, by Price Trend Analysis 2020 & 2033
- Table 6: Global Military Radars Industry Revenue Million Forecast, by Region 2020 & 2033
- Table 7: Global Military Radars Industry Revenue Million Forecast, by Production Analysis 2020 & 2033
- Table 8: Global Military Radars Industry Revenue Million Forecast, by Consumption Analysis 2020 & 2033
- Table 9: Global Military Radars Industry Revenue Million Forecast, by Import Market Analysis (Value & Volume) 2020 & 2033
- Table 10: Global Military Radars Industry Revenue Million Forecast, by Export Market Analysis (Value & Volume) 2020 & 2033
- Table 11: Global Military Radars Industry Revenue Million Forecast, by Price Trend Analysis 2020 & 2033
- Table 12: Global Military Radars Industry Revenue Million Forecast, by Country 2020 & 2033
- Table 13: United States Military Radars Industry Revenue (Million) Forecast, by Application 2020 & 2033
- Table 14: Canada Military Radars Industry Revenue (Million) Forecast, by Application 2020 & 2033
- Table 15: Mexico Military Radars Industry Revenue (Million) Forecast, by Application 2020 & 2033
- Table 16: Global Military Radars Industry Revenue Million Forecast, by Production Analysis 2020 & 2033
- Table 17: Global Military Radars Industry Revenue Million Forecast, by Consumption Analysis 2020 & 2033
- Table 18: Global Military Radars Industry Revenue Million Forecast, by Import Market Analysis (Value & Volume) 2020 & 2033
- Table 19: Global Military Radars Industry Revenue Million Forecast, by Export Market Analysis (Value & Volume) 2020 & 2033
- Table 20: Global Military Radars Industry Revenue Million Forecast, by Price Trend Analysis 2020 & 2033
- Table 21: Global Military Radars Industry Revenue Million Forecast, by Country 2020 & 2033
- Table 22: Brazil Military Radars Industry Revenue (Million) Forecast, by Application 2020 & 2033
- Table 23: Argentina Military Radars Industry Revenue (Million) Forecast, by Application 2020 & 2033
- Table 24: Rest of South America Military Radars Industry Revenue (Million) Forecast, by Application 2020 & 2033
- Table 25: Global Military Radars Industry Revenue Million Forecast, by Production Analysis 2020 & 2033
- Table 26: Global Military Radars Industry Revenue Million Forecast, by Consumption Analysis 2020 & 2033
- Table 27: Global Military Radars Industry Revenue Million Forecast, by Import Market Analysis (Value & Volume) 2020 & 2033
- Table 28: Global Military Radars Industry Revenue Million Forecast, by Export Market Analysis (Value & Volume) 2020 & 2033
- Table 29: Global Military Radars Industry Revenue Million Forecast, by Price Trend Analysis 2020 & 2033
- Table 30: Global Military Radars Industry Revenue Million Forecast, by Country 2020 & 2033
- Table 31: United Kingdom Military Radars Industry Revenue (Million) Forecast, by Application 2020 & 2033
- Table 32: Germany Military Radars Industry Revenue (Million) Forecast, by Application 2020 & 2033
- Table 33: France Military Radars Industry Revenue (Million) Forecast, by Application 2020 & 2033
- Table 34: Italy Military Radars Industry Revenue (Million) Forecast, by Application 2020 & 2033
- Table 35: Spain Military Radars Industry Revenue (Million) Forecast, by Application 2020 & 2033
- Table 36: Russia Military Radars Industry Revenue (Million) Forecast, by Application 2020 & 2033
- Table 37: Benelux Military Radars Industry Revenue (Million) Forecast, by Application 2020 & 2033
- Table 38: Nordics Military Radars Industry Revenue (Million) Forecast, by Application 2020 & 2033
- Table 39: Rest of Europe Military Radars Industry Revenue (Million) Forecast, by Application 2020 & 2033
- Table 40: Global Military Radars Industry Revenue Million Forecast, by Production Analysis 2020 & 2033
- Table 41: Global Military Radars Industry Revenue Million Forecast, by Consumption Analysis 2020 & 2033
- Table 42: Global Military Radars Industry Revenue Million Forecast, by Import Market Analysis (Value & Volume) 2020 & 2033
- Table 43: Global Military Radars Industry Revenue Million Forecast, by Export Market Analysis (Value & Volume) 2020 & 2033
- Table 44: Global Military Radars Industry Revenue Million Forecast, by Price Trend Analysis 2020 & 2033
- Table 45: Global Military Radars Industry Revenue Million Forecast, by Country 2020 & 2033
- Table 46: Turkey Military Radars Industry Revenue (Million) Forecast, by Application 2020 & 2033
- Table 47: Israel Military Radars Industry Revenue (Million) Forecast, by Application 2020 & 2033
- Table 48: GCC Military Radars Industry Revenue (Million) Forecast, by Application 2020 & 2033
- Table 49: North Africa Military Radars Industry Revenue (Million) Forecast, by Application 2020 & 2033
- Table 50: South Africa Military Radars Industry Revenue (Million) Forecast, by Application 2020 & 2033
- Table 51: Rest of Middle East & Africa Military Radars Industry Revenue (Million) Forecast, by Application 2020 & 2033
- Table 52: Global Military Radars Industry Revenue Million Forecast, by Production Analysis 2020 & 2033
- Table 53: Global Military Radars Industry Revenue Million Forecast, by Consumption Analysis 2020 & 2033
- Table 54: Global Military Radars Industry Revenue Million Forecast, by Import Market Analysis (Value & Volume) 2020 & 2033
- Table 55: Global Military Radars Industry Revenue Million Forecast, by Export Market Analysis (Value & Volume) 2020 & 2033
- Table 56: Global Military Radars Industry Revenue Million Forecast, by Price Trend Analysis 2020 & 2033
- Table 57: Global Military Radars Industry Revenue Million Forecast, by Country 2020 & 2033
- Table 58: China Military Radars Industry Revenue (Million) Forecast, by Application 2020 & 2033
- Table 59: India Military Radars Industry Revenue (Million) Forecast, by Application 2020 & 2033
- Table 60: Japan Military Radars Industry Revenue (Million) Forecast, by Application 2020 & 2033
- Table 61: South Korea Military Radars Industry Revenue (Million) Forecast, by Application 2020 & 2033
- Table 62: ASEAN Military Radars Industry Revenue (Million) Forecast, by Application 2020 & 2033
- Table 63: Oceania Military Radars Industry Revenue (Million) Forecast, by Application 2020 & 2033
- Table 64: Rest of Asia Pacific Military Radars Industry Revenue (Million) Forecast, by Application 2020 & 2033
Frequently Asked Questions
1. What is the projected Compound Annual Growth Rate (CAGR) of the Military Radars Industry?
The projected CAGR is approximately 5.15%.
2. Which companies are prominent players in the Military Radars Industry?
Key companies in the market include THALES, Leonardo SpA, Lockheed Martin Corporation, Airbus SE, QinetiQ Group PL, Teledyne Technologies Incorporated, BAE Systems PLC, RTX Corporation, HENSOLDT Holding Germany GmbH, Israel Aerospace Industries Ltd, Northrop Grumman Corporation, Saab AB.
3. What are the main segments of the Military Radars Industry?
The market segments include Production Analysis, Consumption Analysis, Import Market Analysis (Value & Volume), Export Market Analysis (Value & Volume), Price Trend Analysis.
4. Can you provide details about the market size?
The market size is estimated to be USD 16.71 Million as of 2022.
5. What are some drivers contributing to market growth?
Increase in Internet of Things (IoT) and Autonomous Systems; Rise in Demand for Military and Defense Satellite Communication Solutions.
6. What are the notable trends driving market growth?
Airborne Segment Expected to Register the Highest CAGR During the Forecast Period.
7. Are there any restraints impacting market growth?
Cybersecurity Threats to Satellite Communication; Interference in Transmission of Data.
8. Can you provide examples of recent developments in the market?
N/A
9. What pricing options are available for accessing the report?
Pricing options include single-user, multi-user, and enterprise licenses priced at USD 4750, USD 5250, and USD 8750 respectively.
10. Is the market size provided in terms of value or volume?
The market size is provided in terms of value, measured in Million.
11. Are there any specific market keywords associated with the report?
Yes, the market keyword associated with the report is "Military Radars Industry," which aids in identifying and referencing the specific market segment covered.
12. How do I determine which pricing option suits my needs best?
The pricing options vary based on user requirements and access needs. Individual users may opt for single-user licenses, while businesses requiring broader access may choose multi-user or enterprise licenses for cost-effective access to the report.
13. Are there any additional resources or data provided in the Military Radars Industry report?
While the report offers comprehensive insights, it's advisable to review the specific contents or supplementary materials provided to ascertain if additional resources or data are available.
14. How can I stay updated on further developments or reports in the Military Radars Industry?
To stay informed about further developments, trends, and reports in the Military Radars Industry, consider subscribing to industry newsletters, following relevant companies and organizations, or regularly checking reputable industry news sources and publications.
Methodology
Step 1 - Identification of Relevant Samples Size from Population Database


Step 2 - Approaches for Defining Global Market Size (Value, Volume* & Price*)

Note*: In applicable scenarios
Step 3 - Data Sources
Primary Research
- Web Analytics
- Survey Reports
- Research Institute
- Latest Research Reports
- Opinion Leaders
Secondary Research
- Annual Reports
- White Paper
- Latest Press Release
- Industry Association
- Paid Database
- Investor Presentations

Step 4 - Data Triangulation
Involves using different sources of information in order to increase the validity of a study
These sources are likely to be stakeholders in a program - participants, other researchers, program staff, other community members, and so on.
Then we put all data in single framework & apply various statistical tools to find out the dynamic on the market.
During the analysis stage, feedback from the stakeholder groups would be compared to determine areas of agreement as well as areas of divergence